MUSIC IN THE AIR STAIRWAY TO HEAVEN - Streaming grows up and puts music back on path to growth after decades of disruption - Goldman Sachs

Page created by Marcus Ford
 
CONTINUE READING
MUSIC IN THE AIR STAIRWAY TO HEAVEN - Streaming grows up and puts music back on path to growth after decades of disruption - Goldman Sachs
EQUITY RESEARCH | October 4, 2016

MUSIC IN THE AIR
 STAIRWAY TO HEAVEN
Streaming grows up and puts music
back on path to growth after
decades of disruption

The music industry is on the cusp of a new era of growth
after nearly two decades of disruption. The rising popularity
and sophistication of streaming platforms like Spotify and
Pandora is ushering in a second digital music revolution –
one that is creating value rather than destroying it like the
                                                                                            U B L E
piracy and unbundling that came before. In this first of a
                                                                                         DO UM
                                                                                          ALB
“double album“ on the nascent industry turnaround, we lay
out the converging trends that we expect to almost double
global music revenues over the next 15 years to $104bn,
spreading benefits across the ecosystem.

Lisa Yang          Heath P. Terry, CFA    Masaru Sugiyama          Simona Jankowski, CFA     Heather Bellini, CFA
+44(20)7552-3713   (212) 357-1849         +81(3)6437-4691          (415) 249-7437            (212) 357-7710
lisa.yang@gs.com   heath.terry@gs.com     masaru.sugiyama@gs.com   simona.jankowski@gs.com   heather.bellini@gs.com
Goldman Sachs      Goldman, Sachs & Co.   Goldman Sachs            Goldman, Sachs & Co.      Goldman, Sachs & Co.
International                             Japan Co., Ltd.

Goldman Sachs does and seeks to do business with companies covered in its research reports. As a
result, investors should be aware that the firm may have a conflict of interest that could affect the
objectivity of this report. Investors should consider this report as only a single factor in making their
investment decision. For Reg AC certification and other important disclosures, see the Disclosure
Appendix, or go to www.gs.com/research/hedge.html. Analysts employed by non-US affiliates are not
registered/qualified as research analysts with FINRA in the U.S.

                                                                             The Goldman Sachs Group, Inc.
MUSIC IN THE AIR STAIRWAY TO HEAVEN - Streaming grows up and puts music back on path to growth after decades of disruption - Goldman Sachs
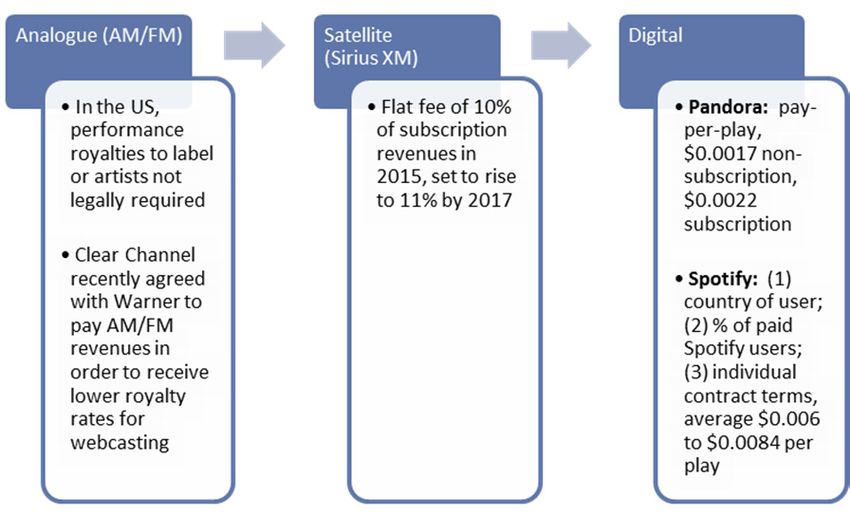
October 4, 2016                                                                                           Global: Media

Table of contents

Stairway to Heaven: Streaming drives new era of growth                                                         4
The ecosystem                                                                                                  6
Stairway to $50 bn of additional revenue opportunity                                                           9
Regulation sets the stage – streaming positive for rights holders                                             15
An interview with… John Enser, Head of Music and Partner, Olswang                                             27
An interview with… Leslie Jose Zigel, Chair of Entertainment Practice, Greenspoon Marder                      29
Streaming drives greater monetization for music owners                                                        31
Streaming benefits from a growing and captive audience                                                        39
A rising tide lifts (almost) all boats                                                                        51
Labels have the most to gain from the growth of streaming and growing competition among distributors          51
Music publishers should benefit from streaming growth but to a lesser extent than labels                      56
An interview with… Jane Dyball, CEO of UK Music Publishing Association                                        59
Subscription streaming platforms have significant growth potential but also face growing competition          61
An interview with… Dr. Hans-Holger Albrecht, CEO of Deezer                                                    68
Ad funded streaming to eat into terrestrial radio                                                             70
Sync revenues: An additional growth opportunity for rights holders                                            75
Live entertainment will become more important and a growth opportunity for streaming platforms                76
Stock implications                                                                                            78
Appendix                                                                                                      81
Disclosure Appendix                                                                                           82

The prices in the body of this report are based on the market close of October 3, 2016.

Contributing authors: Lisa Yang, Heath P. Terry CFA, Masaru Sugiyama, Simona Jankowski CFA, Heather Bellini CFA,
Robert D. Boroujerdi, Hugo Scott-Gall, Piyush Mubayi, Brett Feldman, Drew Borst, Otilia Bologan, Mark Grant, Yusuke
Noguchi, Matthew Cabral, Shateel T. Alam, Stephen Laszczyk, Aditya Buddhavarapu, Katherine Tait. We also would like
to thank Annabel Hazlitt and Kieran Chalmers for their contribution to this report.

Goldman Sachs Global Investment Research                                                                              2
MUSIC IN THE AIR STAIRWAY TO HEAVEN - Streaming grows up and puts music back on path to growth after decades of disruption - Goldman Sachs
MUSIC’S RETURN TO GROWTH                                                                                  in numbers

EASY LISTENING                                                  ROOM TO GROW IN PAY-TO-PLAY

                                                                                       Paid streaming penetration globally as a
     630                   Audio streams consumed per day
                           by the US population during                2%               % of smartphone subscribers. (p. 9)
                           1H2016—a 97% yoy jump. (p. 32)
    million                                                                           Percentage of the DM population that
                                                                                      pays to listen to music. According to
                           The number of streaming
MUSIC IN THE AIR STAIRWAY TO HEAVEN - Streaming grows up and puts music back on path to growth after decades of disruption - Goldman Sachs
October 4, 2016                                                                                                         Global: Media

Stairway to Heaven: Streaming drives new era of growth
                                 We believe new technology changes such as the emergence of internet radio and music
                                 streaming are driving a new era of growth for the recorded music industry. New tech
                                 enablers such as Spotify, Apple or Pandora have disentangled music content from its
                                 delivery. The resulting convenience, accessibility and personalization has driven more
                                 consumption of legal music and greater willingness to pay for it, at a time of improving
                                 connectivity and growing consumer preference for accessing rather than owning music.
                                 Unlike its predecessor, this “second” digital revolution creates more value for rights
                                 holders (rather than destroys it), shifting revenue streams from structurally declining
                                 markets (physical, download sales) to a significantly larger new revenue pool (ad-funded
                                 and subscription streaming). This shift has enabled the recorded music market to return to
                                 growth in 2015 following almost two decades of value destruction led by piracy and
                                 unbundling.

                                 We believe the overall music industry, including recording, publishing and live, is now set
                                 to double to over $100 bn by 2030. In this first of a “double album“, we explore the
                                 converging trends that make this digital revolution different to and more profitable than the last.

                                 Streaming drives greater monetization of music content…
                                 By revolutionizing the listening experience, making it seamless and personalized,
                                 streaming improves the monetization of music content through 1) a range of subscription
                                 streaming options with multiple price points that address consumers willing to pay for
                                 better access and convenience, and 2) ad-funded, free streaming that addresses
                                 consumers not able or willing to pay (therefore reducing piracy). Moreover, streaming
                                 improves the discoverability of catalogues and increases their value.

                                 … while benefitting from a growing and captive audience
                                 We see particularly attractive forces supporting streaming growth:

                                     Room to grow penetration of subscription services in DMs, currently at 3%. We see
                                      scope to catch up with the Nordics, already at over 20% as user mix continues to
                                      evolve favourably towards paid tiers. Globally, we forecast paid streaming to grow to
                                      9% of the smartphone population in 2030 from 2% in 2015.

                                     The nascent music markets in EMs, which stand to benefit from improving
                                      recognition of IP, new business models (ad-funded, prepaid, telecom bundles, etc.) and
                                      innovative payment capabilities. EMs accounted for just 10% of the global recorded
                                      music market in 2015 and the Chinese music market was smaller than that of Sweden.

                                     Media consumption habits of Generation Z and Millennials, who are the ideal
                                      audience for streaming given their inherent characteristics of being “digital natives”
                                      focused on experience and convenience. Millennials already spend more on music
                                      than the average person in the US driven by paid streaming and live music.

                                     Further benefit from telecom and tech companies’ large marketing budgets and
                                      existing customer base as these players increasingly leverage music content to drive
                                      greater differentiation of their services and upselling.

                                 Further upside from regulatory changes
                                 Convoluted rules and regulations dictate the flows of payments from platforms to rights
                                 holders, and understanding these intricacies and their evolution is essential. We believe the
                                 emergence of new digital distribution models is positive for rights holders given a more
                                 attractive royalty structure in the US and see further upside from potential regulatory
                                 changes which could reshape future flows of payments from platforms (especially
                                 YouTube and on-demand streaming services).

Goldman Sachs Global Investment Research                                                                                           4
MUSIC IN THE AIR STAIRWAY TO HEAVEN - Streaming grows up and puts music back on path to growth after decades of disruption - Goldman Sachs
October 4, 2016                                                                                                        Global: Media

                                 A rising tide lifts (almost) all boats; industry responses will be key
                                 In addition to the structural and regulatory tailwinds highlighted above, we believe industry
                                 responses will be critical in shaping the future growth of the industry which has only
                                 started to recover. We would expect some level of coordination among labels and
                                 platforms to maximize that growth potential. As a result, we believe the split of revenue
                                 pools will remain broadly unchanged in the medium term.

                                     Subscription streaming services are the enablers and the direct beneficiaries of
                                      the above-mentioned shifts. We also believe they will increasingly leverage their
                                      promotion capabilities, user data and customer relationships to drive new revenue
                                      streams (e.g. ticketing) and improve their deals with the labels. However, the
                                      landscape is more competitive (Pandora and Amazon launch in 2H16) with risk of
                                      disruptive behaviour such as exclusivity and price competition. As a result, we believe
                                      their distributor’s cut will remain at c.30%, leading to $13 bn of additional revenue (net
                                      of royalities) by 2030. We expect the scene to be divided among pure play streaming
                                      services such as Spotify and large tech players such as Apple or Amazon.
                                      Main beneficiaries in our coverage: Apple (Buy), Pandora (CL-Buy).
                                     We expect ad-funded services to eat into terrestrial radio given the ongoing
                                      migration to online listening and better targeting capabilities, creating $5 bn of
                                      additional revenue by 2030. Future roll-out of connected cars and 5G will further
                                      accelerate that shift.
                                      Main beneficiary in our coverage: Pandora (CL-Buy); main loser: iHeart (Not
                                      Covered)
                                     We believe the labels have the most to gain given their royalty cut of 55%-60%.
                                      Their position should remain solid as distribution fragments (and they will have a
                                      vested interest in keeping a minimum of competitive tension among platforms) and
                                      digital increases the complexity of the industry. The outcome of their (re)negotiations
                                      with YouTube, Spotify or Amazon in the coming months and regulatory changes will
                                      be key in this regard. However, we see disruptive forces, such as alternative labels,
                                      driving a greater redistribution of profits to artists. Overall, we forecast that streaming
                                      will increase their revenue pool by $21 bn by 2030 and profit pool by $7 bn.
                                      Main beneficiaries in our coverage: Vivendi (CL-Buy), Sony (CL-Buy).
                                     Publishers should see similar trends to labels but to a lesser extent given their
                                      royalty cut of 10% (note that publishers and labels often belong to the same parent
                                      company), creating an additional revenue pool of $3 bn and profit pool of $1 bn.

                                     Live music growth benefits ticketing and streaming players. By using geo-specific
                                      targeting to known fans, players such as Ticketfly/Pandora and other streaming
                                      services should be able to drive down vacancy rates, increasing artist revenues, and
                                      improving relationships with artists.
                                      Main beneficiary in our coverage: Pandora (CL-Buy).

                                 Industry risks: See the second of our double album “Paint It Black”
See the second of our            While a number of positive structural and regulatory shifts pave the way for better
double album: Music              monetisation of music content, industry responses will also be critical in shaping the future
in the Air – Paint it            growth of the industry. In this first of a “double album”, we have assumed some level of
Black
                                 coordination among labels and platforms to maximize that growth potential. In the second
                                 of our double album, “Paint It Black”, we highlight potential disruptive behaviour that
                                 could derail the music recovery.

Goldman Sachs Global Investment Research                                                                                            5
MUSIC IN THE AIR STAIRWAY TO HEAVEN - Streaming grows up and puts music back on path to growth after decades of disruption - Goldman Sachs
The Ecosystem
Evolution of revenues 2015-2030E
   2015                                         USIC $24.7BN
                                            IVEM
                                           L
   $53.9bn                        *

                                               ARTIST,
                                             SONGWRITER
                                              & OTHER**
                                               $26.9BN

             BN
          9.5                                   TICKETING
      2

                                                  $2.5BN
    O$

                                                                                                        2030E
RADI

                                       RECORD
                                        LABEL
                                       $15.0BN
                                                                PUBLISHER
                                                                  $3.7BN
                                                                                    $ 5.
                                                                                        4BN
                                                                                                        $103.9bn                 *

                                                                                                                      SIC $38.3B
                                                                                        G                         E MU          N
                                                                        PUB LIS H I N                          LIV
                                                 STREAMING
                  PHYSICAL                         $1.4BN
                   $2.9BN

                                      DOWNLOAD
                  CO
             RE

                                       $1.5BN
                       RD
                            ED
                                 M U S I C $ 2 3.8 B N
                                                                                                                     ARTIST,
                                                                                                                   SONGWRITER
                                                                                                                    & OTHER**
                                                                                                                     $42.9BN

                                                                          BN
                                                                       3.8                                          TICKETING
                                                                  $2

                                                                                                                      $3.8BN
                                                            RADIO

                                                                                                                                                 PUBLISHER

                                                                                                                                                                   .3 B N
                                                                                                                                                   $6.8BN
                                                                                                  RECORD
                                                                                                   LABEL                    STREAMING
                                                                                                                                                                 $9
                                                                                                  $35.5BN                     $14.1BN
                                                                                                                                                 P UBLIS H I N G

                                                                                                                           DOWNLOAD
                                                                                                                            $0.2BN
                                                                                                       PHYSICAL
                                                                                 RE

                                                                                    OR                  $0.7BN
                                                                                   C

                                                                                            DE
                                        Industry segment                                         DM
                                                                                                      USI
                                                                                                            C $5 6.3 B N                * Excluding revenue from radio
                                                                                                                                        ** Other includes concert
                                        Industry player                                                                                 promoters, venue operators etc.

                                                                                                       Source: IFPI, Goldman Sachs Global Investment Research
MUSIC IN THE AIR STAIRWAY TO HEAVEN - Streaming grows up and puts music back on path to growth after decades of disruption - Goldman Sachs
The Ecosystem
Key players and market shares (2015)
                                                                                                          Physical/Online Retail
                                                                                                          Share of US CD sales
                                                                                                          Amazon (24%)
                                                                                                          Walmart (22%)

                                                                                                          Download
                                                                 PURCHASE                                 Share of US downloads
                                                                                                          Apple - iTunes (52%)
                                                                                                          Amazon (19%)
LABEL                                                                                                     Alphabet - Google Play (11%)
Share of global recorded music
Vivendi - UMG (34%)
Sony - SME (23%)                                                                                          Pure Player
WMG (17%)                                                                                                 Share of global paid subscribers
Independents (26%)                                                                                        Napster/Rhapsody (4%)
                                                                                                          Tidal (2%)
                                                                                                          Spotify (44%)
                                                                                                          Deezer (5%)
                                                                                                          Pandora (N/A)

                                                                                                          Tech Player
                                                                          STREAM                          Share of global paid subscribers
                                                                                                          (unless otherwise indicated)
                                                                          (ACCESS)                        Apple - Apple Music (15%)
                                                                                                          Alphabet - YouTube
                                                                                                          (90% share of ad-funded
                                                                                                          users)
                                                                                                          Amazon (N/A)
                                                                                                          Tencent - QQ Music (N/A)

PUBLISHER
Share of global music publishing
Sony (30%)
                                                                                                          AM/FM
Vivendi - UMPG (23%)                                                                                      Share of US radio
WMG (13%)                                                                                                 iHeartMedia (23%)
Independents (34%) incl                                                                                   CBS Radio (8%)
BMG (5%), Kobalt (4%)                                                                                     Cumulus Media (8%)
                                                                                                          Entercom Communications
                                                                 BROADCAST                                Corporation (3%)
                                                                                                          Emmis Communications
                                                                                                          Corporation (c.2%)

                                                                                                          Satellite Radio
                                                                                                          Share of US satellite radio
                                                                                                          Sirius XM (100%)

                                                                                                          Online Radio
                       UMG - Universal Music Group                                                        Share of US online radio
                       SME - Sony Media Entertainment                                                     Pandora (31%)
                       WMG - Warner Music Group
                       UMPG - Universal Music Publishing Group                                            iHeartRadio (9%)
                       BMG - Bertelsmann Music Group

                                                Source: Company data, Music & Copyright, IFPI, Goldman Sachs Global Investment Research
October 4, 2016                                                                                                    Global: Media

                                 We use the following list of terms interchangeably throughout the report:
                                     Freemium = ad funded tier = free tier (applicable to streaming services such as Spotify
                                      or Deezer but not to Apple Music or Tidal)

                                     Interactive = on-demand (applicable to streaming services such as Spotify, Deezer, or
                                      Apple Music but not to Pandora’s ad-supported internet radio service)

                                     Internet radio = non interactive streaming = webcasting (applicable to Pandora’s
                                      internet radio service or iHeart but not to Sirius XM’s satellite radio)

                                     Rights owners = labels, artists, publishers and songwriters altogether or any one of
                                      them

                                     Recorded music companies = record labels = labels

Goldman Sachs Global Investment Research                                                                                        8
October 4, 2016                                                                                                    Global: Media

Stairway to $50 bn of additional revenue opportunity
                                 We forecast overall music industry (recorded music, music publishing and live music)
                                 revenue to almost double in size over the next 15 years to $104 bn from $54 bn in
                                 2015. Of that $50 bn revenue growth potential, we expect $32 bn to come from the
                                 recorded music segment, which has only started to recover after almost two decades of
                                 decline, while Publishing and Live should continue to show healthy growth and add $4 bn
                                 and $14 bn of revenue respectively.

                                 Exhibit 1: $50 bn of additional revenue opportunity mainly driven by recorded
                                 Music industry revenue split in bn, 2015 vs. 2030E

                                                                                           Live Music
                                                                                               $38
                                     Live Music                Recorded                                       Recorded
                                         $25                     $24
                                                                                                                $56

                                                  Publishing
                                                     $5                                        Publishing
                                                                                                  $9

                                 Source: IFPI, Goldman Sachs Global Investment Research.

                                 We assess the size of the total addressable market by looking at the smartphone
                                 population, consumer spending on entertainment and the advertising market (in particular
                                 radio).

                                      We forecast that paid streaming services will reach 9% of the global smartphone
                                       population in 2030 from 2% in 2015 by extrapolating the 2015 penetration growth rate
                                       of 50 bp. This level would still be below the average penetration for the top five paid
                                       streaming markets of 11% in 2015 and less than half the penetration in Sweden and
                                       Norway (over 20%), the most advanced markets. By comparison, Pay TV penetration is
                                       48% of TV homes globally and SVOD (subscription video on demand) is 6% of
                                       broadband homes (SNL Kagan/ Digital TV Research). In the US, Pay TV and SVOD are
                                       in 85% and 48% of eligible homes compared to only 4% for music subscription.

Goldman Sachs Global Investment Research                                                                                      9
October 4, 2016                                                                                                                                                                                       Global: Media

Exhibit 2: We forecast global paid streaming penetration                       Exhibit 3: Paid streaming penetration stands at 2%
to reach 9% by 2030E, slightly below the top five markets                      globally compared to 6% for SVOD and 48% for Pay TV
today and less than half of the rate attained in Sweden                        Paid streaming penetration as % of smartphone subscribers,
Paid streaming penetration as % of smartphone subscribers                      SVOD penetration as % of broadband homes, Pay TV
                                                                               penetration as % of TV homes, Smartphone penetration as %
                                                                               of total population
   25%                                                                             90%
                                                                                   80%
   20%                                                                             70%
                                                                                   60%
   15%
                                                                                   50%

   10%                                                                             40%
                                                                                   30%
    5%                                                                             20%
                                                                                   10%
    0%                                                                              0%
          2008
          2009
          2010
          2011
          2012
          2013
          2014
          2015
         2016E
         2017E
         2018E
         2019E
         2020E
         2021E
         2022E
         2023E
         2024E
         2025E
         2026E
         2027E
         2028E
         2029E
         2030E
                                                                                                World                 Japan             Germany                     US                Western              Sweden
                                                                                                                                                                                      Europe
            Sweden       Top 5 markets           Western Europe       Global                                          Music          SVOD             Pay TV             Smartphone

Source: IFPI, ZenithOptimedia, Goldman Sachs Global Investment Research.       Source: IFPI, Digital TV Research, SNL Kagan, ZenithOptimedia, Goldman
                                                                               Sachs Global Investment Research.

Exhibit 4: We expect music streaming to follow the path                        Exhibit 5: Netflix’s penetration of eligible homes doubled
of SVOD globally                                                               over three years to 16% in 2015
Global paid streaming penetration vs. SVOD penetration                         Global music paid streaming penetration vs. Netflix
                                                                               international penetration of eligible homes
   16%                                                                            30%
   14%                                                                            25%
   12%
                                                                                  20%
   10%
                                                                                  15%
    8%
                                                                                  10%
    6%
                                                                                   5%
    4%
    2%                                                                             0%
                                                                                         2012
                                                                                                 2013
                                                                                                        2014
                                                                                                               2015
                                                                                                                       2016
                                                                                                                              2017
                                                                                                                                     2018
                                                                                                                                            2019
                                                                                                                                                   2020
                                                                                                                                                          2021
                                                                                                                                                                 2022
                                                                                                                                                                        2023
                                                                                                                                                                               2024
                                                                                                                                                                                      2025
                                                                                                                                                                                             2026
                                                                                                                                                                                                    2027
                                                                                                                                                                                                           2028
                                                                                                                                                                                                                  2029
                                                                                                                                                                                                                         2030
    0%
                  2010                   2014E                    2020E                                         Netflix international penetration of eligible homes
                            SVOD          Music streaming                                                       Paid streaming penetration

Source: IFPI, Digital TV Research, Goldman Sachs Global Investment Research.   Source: IFPI, Digital TV Research, Company data, Goldman Sachs Global
                                                                               Investment Research.

Goldman Sachs Global Investment Research                                                                                                                                                                                        10
October 4, 2016                                                                                                                                                                                                                                                     Global: Media

                                                                  Exhibit 6: Consumption of music streaming services comparable to SVOD
                                                                  Average weekly hours of streaming
                                                                       14
                                                                                                                                                                                                                            Music Streaming Services
                                                                       12
                                                                                                                                                                                                                             SVOD Services

                                                                       10

                                                                        8

                                                                        6

                                                                        4

                                                                        2

                                                                        0
                                                                                               Vevo                             Netflix          Pandora                  Hulu                        Spotify               Amazon Prime                             Deezer
                                                                                                                                                                                                                            Instant Video

                                                                  Source: Press reports, Deezer.

                                                                              Overall consumer spend on entertainment amounted to $1.3 tn in 2015 (Euromonitor),
                                                                               with music accounting for 4.2% on our estimates. We forecast that share will rise to
                                                                               5.6% in 2030, still well below the 7.6% attained in 1998. Based on overall consumer
                                                                               spend, we expect music’s share to increase from 0.13% in 2015 to 0.15% in 2030,
                                                                               compared to the 0.30% recorded in 1998.

Exhibit 7: Music revenue as % of entertainment spend                                                                                               Exhibit 8: We forecast music revenue to remain below
and overall consumer spend                                                                                                                         1 pp of global nominal GDP by 2030, less than half the
Entertainment includes: Recreational and Cultural Services,                                                                                        share it had in 1998
Newspapers, Magazines, Books and Stationery                                                                                                        Global music revenues as % of global nominal GDP
8.00%                                                                                                                                    0.30%     0.200%

7.50%
                                                                                                                                                   0.180%
7.00%
                                                                                                                                         0.25%
                                                                                                                                                   0.160%
6.50%

6.00%                                                                                                                                              0.140%
                                                                                                                                         0.20%
5.50%                                                                                                                                              0.120%
5.00%
                                                                                                                                                   0.100%
                                                                                                                                         0.15%
4.50%
                                                                                                                                                   0.080%
4.00%

3.50%                                                                                                                                    0.10%     0.060%
                                                                                                                                                            1998

                                                                                                                                                                   2000

                                                                                                                                                                          2002

                                                                                                                                                                                 2004

                                                                                                                                                                                        2006
                                                                                                                                                                                               2008

                                                                                                                                                                                                       2010

                                                                                                                                                                                                              2012

                                                                                                                                                                                                                     2014

                                                                                                                                                                                                                            2016E
                                                                                                                                                                                                                                    2018E

                                                                                                                                                                                                                                            2020E

                                                                                                                                                                                                                                                    2022E
                                                                                                                                                                                                                                                            2024E

                                                                                                                                                                                                                                                                    2026E

                                                                                                                                                                                                                                                                            2028E

                                                                                                                                                                                                                                                                                    2030E
        1998
               2000
                      2002
                             2004
                                    2006
                                           2008
                                                  2010
                                                         2012
                                                                2014
                                                                       2016E
                                                                               2018E
                                                                                       2020E
                                                                                                2022E
                                                                                                        2024E
                                                                                                                2026E
                                                                                                                        2028E
                                                                                                                                 2030E

                  % of entertainment spend (LHS)                                       % of consumer spend                                                                                               % of Nominal GDP

Source: Euromonitor, Goldman Sachs Global Investment Research.                                                                                     Source: World Bank, IFPI, Goldman Sachs Global Investment Research.

                                                                              We forecast the ad funded, streaming market (including payments from YouTube,
                                                                               Pandora, Spotify, etc.) to grow to $7.1 bn by 2030 from $1.5 bn currently. This
                                                                               compares to a global advertising market worth $456 bn and global radio advertising
                                                                               market worth $30 bn in 2015 as per MAGNA Global.

Goldman Sachs Global Investment Research                                                                                                                                                                                                                                                    11
October 4, 2016                                                                                                                                                                  Global: Media

Exhibit 9: The global addressable market for advertising                              Exhibit 10: We expect digital radio and streaming
funded streaming is huge                                                              services to eat into the radio ad market in the US
Advertising revenue by category ($ bn)                                                Advertising revenue by category ($ mn)

 500                                                                                   25000
                                                                    456.4
 450
                                                                                       20000
 400
 350                                                                                   15000
 300
 250                                                                                   10000

 200
                                                                                        5000
 150
 100                                                                                       0

                                                                                               2003

                                                                                                      2005

                                                                                                             2007

                                                                                                                    2009

                                                                                                                            2011

                                                                                                                                   2013

                                                                                                                                          2015

                                                                                                                                                 2017E

                                                                                                                                                         2019E

                                                                                                                                                                 2021E

                                                                                                                                                                         2023E

                                                                                                                                                                                 2025E

                                                                                                                                                                                         2027E

                                                                                                                                                                                                 2029E
  50                                               29.5
              1.5               10.0
   0
       Total ad supported   Programmatic       Global radio   Global advertising               US radio advertising        Ad supported streaming            SoundExchange Distributions
           streaming         advertising       advertising

Source: MAGNA Global, IFPI.                                                           Source: MAGNA Global, IFPI, Goldman Sachs Global Investment Research.

                                           Digging into the economics for stakeholders

                                           Exhibit 11: Evolution of revenue pool for the different industry players
                                           Revenues, $ bn

                                            $110

                                            $100

                                             $90
                                                                                                                                                     Other (artists, songwriters, live
                                             $80                                                                                                     ex ticketing)
                                                                                                                                                     Ticketing
                                             $70
                                                                                                                                                     Streaming
                                             $60

                                                                                                                                                     Label
                                             $50

                                             $40                                                                                                     Publishing

                                             $30                                                                                                     Download

                                             $20
                                                                                                                                                     Physical
                                             $10

                                              $0
                                                   2016E
                                                   2017E
                                                   2018E
                                                   2019E
                                                   2020E
                                                   2021E
                                                   2022E
                                                   2023E
                                                   2024E
                                                   2025E
                                                   2026E
                                                   2027E
                                                   2028E
                                                   2029E
                                                   2030E
                                                    2007
                                                    2008
                                                    2009
                                                    2010
                                                    2011
                                                    2012
                                                    2013
                                                    2014
                                                    2015

                                           Source: IFPI, PwC, Goldman Sachs Global Investment Research.

                                           We believe the online innovators (interactive streaming platforms and ad funded services)
                                           will grow to $14 bn of net revenue in 2030 from $1.4 bn today, assuming they retain a
                                           distributor cut of 30%. With around 70% of their revenues being redistributed to rights
                                           owners (71.5%/ 73% in the US/internationally in the case of Apple Music according to
                                           Recode) and other COGS accounting for 10%-15%, this gives a gross margin of 15%-20% or
                                           $6-8 bn of potential gross profit. We assume that pure streaming players (Spotify, Deezer,
                                           Pandora, etc.) will account for 37% share of net subscriber additions over 2020-30E, Apple
                                           Music 26% and other large tech players (Google, Amazon, etc.) 37%.

Goldman Sachs Global Investment Research                                                                                                                                                             12
October 4, 2016                                                                                                                                                         Global: Media

                                 For the incumbent labels, which receive around 55%-60% of the platforms’ revenue as
                                 royalties, we forecast their revenue pool to grow to $35.5 bn in 2030 from $15 bn today
                                 mainly through streaming. This compares to the current pool at risk of $9 bn from physical
                                 and download sales. We believe profit growth could be even more meaningful as we
                                 estimate margins are 15% in streaming and download and 8% in physical at present, with
                                 the potential for streaming to grow to 20%-25% over time. This means $4-6 bn of additional
                                 profit from streaming alone bringing the total pool to $9 bn, compared to the current pool
                                 of $2 bn, of which $1 bn is from physical and downloads.

                                 Exhibit 12: Streaming should help drive recorded music back to its 1999 peak by 2027
                                 Global recorded music market breakdown ($ bn, LHS) vs. global music market growth (%, RHS)

                                  $40                                                                                                                                             8%
                                                                                                                                         7%
                                                                                                                                                   6% 6%
                                                                                                                                                            6%
                                                                                                                                                                   6% 6%
                                                                                                                                  5%                                        5%    6%
                                  $35
                                                                                                                             4%
                                        4%
                                                                                                                        3%                                                        4%
                                  $30

                                                                                                                                                                                  2%
                                  $25        0%                                                            1%
                                                                                                                0%                                                                0%
                                                    ‐1%                                              ‐1%
                                  $20         ‐2%                                                               ‐2%
                                                                                                                                                                                  ‐2%
                                  $15
                                                                                                ‐5%
                                                                                                                                                                                  ‐4%
                                                          ‐5%
                                  $10                                              ‐6%
                                                                                               ‐7%
                                                                 ‐7%                                                                                                              ‐6%
                                                                                         ‐7%
                                                           ‐8%
                                                                       ‐8%
                                   $5                                        ‐8%
                                                                                                                                                                                  ‐8%

                                   $0                                                                                                                                             ‐10%
                                        2016E
                                        2017E
                                        2018E
                                        2019E
                                        2020E
                                        2021E
                                        2022E
                                        2023E
                                        2024E
                                        2025E
                                        2026E
                                        2027E
                                        2028E
                                        2029E
                                        2030E
                                         1998
                                         1999
                                         2000
                                         2001
                                         2002
                                         2003
                                         2004
                                         2005
                                         2006
                                         2007
                                         2008
                                         2009
                                         2010
                                         2011
                                         2012
                                         2013
                                         2014
                                         2015

                                                    Physical                   Download                         Other                  Streaming           Global market growth

                                 Source: IFPI, Goldman Sachs Global Investment Research.

                                 The incumbent publishers, who so far have been more insulated from digital disruption,
                                 are also likely to gain as they receive around 10% of the platforms’ revenue as mechanical
                                 and performance royalties. We forecast their revenue pool to grow to $7 bn in 2030 from
                                 $4 bn in 2015, with streaming alone adding $3 bn of revenue. The main pool at risk (i.e.
                                 physical mechanical royalties) is currently worth $0.6 bn on our estimates. Assuming
                                 margin remains broadly unchanged at 30% as publishers do not benefit from the same
                                 margin uplift in streaming as the labels, we forecast profit to double to $2 bn in 2030.

Goldman Sachs Global Investment Research                                                                                                                                            13
October 4, 2016                                                                                                                                                     Global: Media

Exhibit 13: Publishing – a $7 bn market by 2030 driven by                                 Exhibit 14: Artists have become increasingly reliant on
streaming                                                                                 touring
Global music publishing market breakdown ($ bn)                                           Sources of artists income ($ bn)

 $7.0                                                                                      $5.0
                                                                                           $4.5
 $6.0
                                                                                           $4.0
 $5.0                                                                                      $3.5
                                                                                           $3.0
 $4.0
                                                                                           $2.5
 $3.0                                                                                      $2.0
                                                                                           $1.5
 $2.0
                                                                                           $1.0
 $1.0                                                                                      $0.5
                                                                                           $0.0
 $0.0                                                                                             1999 2000 2001 2002 2003 2004 2005 2006 2007 2008 2009 2010 2011 2012
         2005
         2006
         2007
         2008
         2009
         2010
         2011
         2012
         2013
         2014
         2015
        2016E
        2017E
        2018E
        2019E
        2020E
        2021E
        2022E
        2023E
        2024E
        2025E
        2026E
        2027E
        2028E
        2029E
        2030E
                                                                                                     Contact Royalties: 12% of gross       Concerts Income 40% of gross
        Physical mechanical   Digital mechanical   Performance royalties   Sync   Other              Freelance Sales Income 33% of gross

Source: IFPI, Company data, Goldman Sachs Global Investment Research.                     Source: Digital Music News.

                                               For the live music segment, which has been the fastest growing area of the music industry,
                                               streaming could also bring a significant revenue opportunity by leveraging listening data
                                               for the marketing and promotion of live events and the possibility to connect directly with
                                               fans, therefore increasing artist revenues and improving relationships with artists. We
                                               forecast the market to grow to $38 bn by 2030 from $25 bn of revenue in 2015 according to
                                               IFPI (International Federation of the Phonographic Industry). It is estimated that 40% of
                                               tickets are currently unsold in the US (Billboard, September 4, 2010) and our analysis of
                                               Pollstar data for over 5,000 live events in the United States over the last year shows an
                                               average vacancy of 26% (29% for events at venues with fewer than 2,500 seats). Better
                                               matching the supply and demand could save up to $2 bn of revenues for the US live
                                               industry alone assuming 24 million tickets are unsold every year in the US at an average
                                               price of $67.33 (WSJ, December 16, 2010).

                                               Artists and songwriters should benefit from the recovery of the industry through the
                                               contract royalties paid by labels/publishers and ongoing growth in live music. While much
                                               of the recent focus has been on their income from royalties, we note that recorded music
                                               has become a much less important source of revenue at 16% for the top 40 earning artists
                                               compared to touring at 80% (this is not applicable to songwriters). Artists are also reported
                                               to be earning 12% of gross contract royalties compared to 40% of the gross touring
                                               revenue (Digital Music News). We believe that music creators will gain a stronger
                                               bargaining position vs. the labels/publishers and the platforms as technology and new
                                               disruptors (alternative label/publishers) will allow greater transparency and easier access to
                                               users. This will be manifested through higher royalty payments from labels/publishers and
                                               greater control over their IP over time. We estimate labels currently invest around 30%-35%
                                               of their revenue (net of the publishing cut) in artists & repertoire and this may grow to 40%
                                               or more over time. Meanwhile, we also expect publishers’ pay away to songwriters to rise
                                               to c.55%-60% over time from 50% today.

Goldman Sachs Global Investment Research                                                                                                                                      14
October 4, 2016                                                                                                     Global: Media

Regulation sets the stage – streaming positive for rights holders
                                 The music industry is entrenched in a convoluted regulatory environment governing
                                 copyrights and royalties and understanding its intricacies and the potential for change is
                                 key. Our main focus will be the US, where we see the most upside for rights holders. We
                                 believe the migration of listeners to online streaming is positive for labels/artists who enjoy
                                 new sources of royalty payments in streaming as opposed to terrestrial radio where they
                                 get paid nothing. Based on IFPI data, payments of nearly $3 bn were made to labels by
                                 streaming services in 2015 and we expect that amount to increase to $11 bn in 2020 with
                                 an average annual growth rate of 30% and to reach $28 bn by 2030 which is double the
                                 current recorded music market size. Future regulatory reviews, notably of safe harbour
                                 rules applicable to YouTube and of songwriting royalties applicable to interactive
                                 streaming services, could drive further redistribution of revenue pools in favour of the
                                 rights holders.

                                 What are royalty payments?
                                 Royalty payments are the method through which all the players involved in the production
                                 of a song make money, yet they are extremely convoluted. When thinking about royalties
                                 in the music industry, it is important to separate out the different copyrights, and so the
                                 right to royalties, owned by different players. Songwriters own the rights to the lyrics and
                                 melody of a piece of music, and these song copyrights are usually managed by music
                                 publishers (we will often refer to songwriters/publishers together). Performance artists
                                 own the rights to a particular recording of a song, known as the master recording, and
                                 these master recording rights are usually assigned to record labels for management (we
                                 will often refer to artists/labels together).

                                 There are distinct types of royalties paid to rights owners. These royalty payments and the
                                 way royalty rates are set vary significantly depending on how the song is accessed (AM/FM
                                 vs. online radio, physical or digital purchase, streaming).

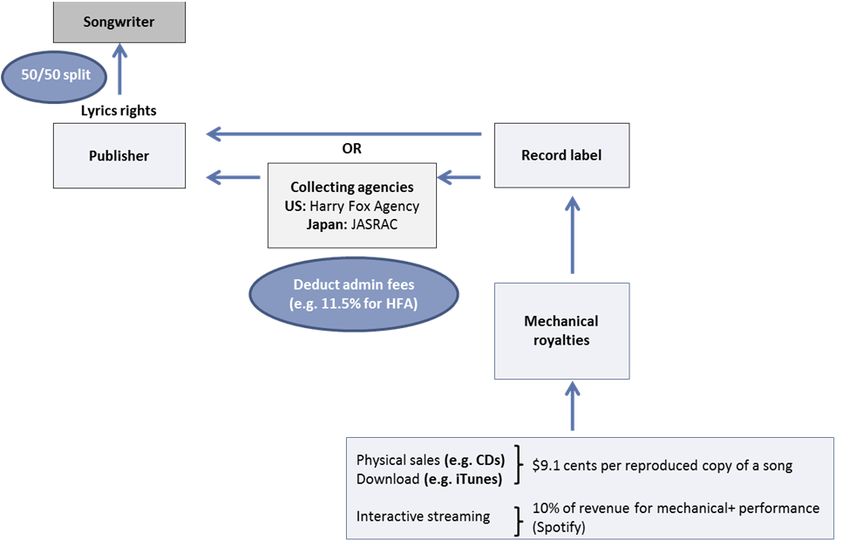
                                 1.   Mechanical royalties are owed whenever a song is manufactured onto a CD,
                                      downloaded on a digital music site, or streamed through a service such as Spotify.
                                      These are paid by the record label to the publisher (either directly or through a third
                                      party organization such as Harry Fox Agency in the US). The publisher then shares
                                      50% of its royalty with the songwriter. In the US, royalty rates are set by the
                                      government through a compulsory license and are 1) either calculated on a penny
                                      basis per song for physical/download, or 2) based on a formula for interactive
                                      streaming services. Satellite and online radio such as Pandora or Sirius do not pay
                                      mechanical royalties to publishers. In most countries outside of the US, royalties are
                                      based on percentages of wholesale/consumer prices for physical/digital products
                                      respectively and negotiated on an industry-wide basis.

Goldman Sachs Global Investment Research                                                                                        15
October 4, 2016                                                                                                                          Global: Media

                                 Exhibit 15: How do publishing mechanical royalties work?

                                 Source: Harry Fox Agency, Royalty Exchange, Sound on Sound, Goldman Sachs Global Investment Research.

                                 Exhibit 16: Mechanical royalties split

                                                                           Trade bodies
                                                                               12%

                                                                                                       Publishers
                                                                                                         44%

                                                                   Songwriters
                                                                      44%

                                 Source: Goldman Sachs Global Investment Research.

                                 2.   Performance royalties for publishing/ neighbouring royalties for recording are
                                      owed whenever a song is performed (radio/TV/online streaming services/live venues).

                                      -    Songwriting performance royalties are paid to songwriters/publishers through
                                           Performance Rights Organizations (PROs) and collection societies (after a 10%-20%
                                           administrative fee).

                                      -    Recording neighbouring royalties are paid to the recording artists and labels
                                           (either directly or through SoundExchange “SX” in the US). In the US however,
                                           artists/labels only get paid for digital performances (i.e. satellite/online radio,
                                           interactive streaming services) and not by terrestrial radio as antiquated US
                                           legislation exempts terrestrial broadcasters from paying royalties for the use of the
                                           master recording.

Goldman Sachs Global Investment Research                                                                                                           16
October 4, 2016                                                                                                        Global: Media

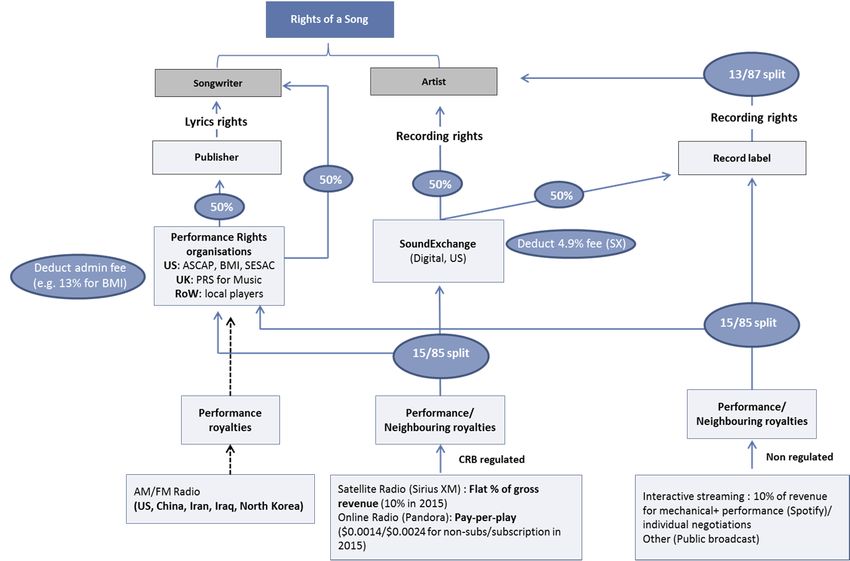
Exhibit 17: How do performance royalties work?

Source: SoundExchange, Royalty Exchange, PRS for Music, Company data, Goldman Sachs Global Investment Research.

                                     Exhibit 18: Terrestrial radio does not pay any performance royalties to labels/artists
                                     Estimated distribution of terrestrial radio performance royalties in the US

                                                        PROs
                                                        12%

                                                                             Publishers
                                                                               44%

                                              Songwriters
                                                 44%

                                     Source: Goldman Sachs Global Investment Research.

Goldman Sachs Global Investment Research                                                                                         17
October 4, 2016                                                                                                    Global: Media

                                 3.   Synchronisation or “sync” royalties are paid to songwriters/publishers and record
                                      labels/artists for use of a song as background music for a movie, TV programme or
                                      commercial, video game, etc. There is no explicit rate that defines the compulsory
                                      percentage of royalty that must be paid. This will mostly depend on the commercial
                                      value of the work to those who want it and on the media to be used. Sync royalties are
                                      usually equally split between labels, artists, publishers and songwriters.

                                 Exhibit 19: Estimated distribution of sync royalties to rights holders

                                                                           Labels,
                                             Songwriters,                   25%
                                                25%

                                             Publishers,
                                                25%                         Artists,
                                                                             25%

                                 Source: Goldman Sachs Global Investment Research.

                                 Artists/Labels are the main beneficiaries of the move to streaming
                                 The evolution of consumption from terrestrial to digital on one hand, and from ownership
                                 to access on the other, has profound implications for the rights holders.

                                 1.   The move from analogue to satellite or internet radio services creates a new
                                      revenue stream for artists/labels who get paid nothing by terrestrial radio.
                                 The US is one of the few countries where terrestrial radio operators are exempted from
                                 paying any performance royalties to labels and artists (although they are required to pay
                                 the publishers and songwriters). This situation is inherited from the long-standing
                                 argument that labels and artists receive important free promotion through radio play. With
                                 analogue radio’s share of listening declining and other meaningful discovery platforms
                                 emerging such as YouTube, social media or streaming services’ playlists, we see a strong
                                 case for this rule to change over time but, as a US music lawyer puts it, it will likely face
                                 strong lobby opposition. In the meantime, we expect to see more bilateral commercial
                                 agreements (see later section “3. Compounding this already positive picture is the move by
                                 many analogue operators to sign deals with labels to receive preferential royalty rates in
                                 order to launch their own digital services”).

                                 With the introduction of streaming services and online radio, US legislation evolved to
                                 create a statutory license for digital audio transmissions and require the payment of
                                 performance royalties by such services under the Digital Performance in Sound Recording
                                 Act of 1995 and the Digital Millennium Copyright Act (“DMCA”) of 1998. The ongoing shift
                                 of listeners from terrestrial radio to online radio and streaming services is therefore
                                 incremental for labels and artists.

Goldman Sachs Global Investment Research                                                                                     18
October 4, 2016                                                                                                                                     Global: Media

Exhibit 20: Nearly half of digital radio listening is                       Exhibit 21: While AM/FM consumption remains dominant
displacing AM/FM in the US                                                  overall, streaming services are increasingly popular for
Survey, Summer 2013                                                         younger age groups
                                                                            Daily listening to streaming service vs. AM/FM by age group,
                                                                            US, 2014

                                                                                       55+     6%                           94%

         26%                                      Mostly replacing local
                                                  "over‐the‐air" AM/FM                34‐55        17%                          83%
                                                  radio stations

                                                                                Age
                                     44%
                                                  Mostly replacing your
                                                  CDs/MP3 collection                  17‐34              35%                            65%

                                                  It's new time; not time
                                                  taken from radio or                 13‐17                     55%                           45%
           30%                                    CDs/MP3s
                                                                                              0%          20%         40%         60%          80%        100%
                                                                                                           Streaming Services     AM/FM

Source: Edison Research Streaming Audio Task Force, Summer 2013/ IAB.       Source: Activate.

                                     The rate paid by non-interactive services such as Sirius or Pandora is set every five years
                                     by the Copyright Royalty Board (CRB), a panel composed of three federal judges. Anyone
                                     regulated by the CRB splits performance royalties on fixed terms with 50% going to the
                                     label, 45% to the artist, and 5% to the Musicians’ Union after SoundExchange fees are
                                     deducted. In contrast, on-demand streaming services such as Spotify or Tidal negotiate
                                     their rates on the free market.

                                     Leading digital radio service Pandora has historically paid on a pay-per-play basis under
                                     CRB rules. The latest CRB ruling for 2016-2020 set these rates at $0.17 and $0.22 for ad-
                                     funded and subscription services respectively in 2016, and these will be adjusted annually
                                     to reflect changes in the Consumer Price Index for 2017-20. However, Pandora has just
                                     negotiated direct deals with record labels, and the terms of those deals will supersede the
                                     CRB ruling. The exception is the deal with Warner Music, under which Warner will continue
                                     to distribute the artists’ share of the statutory ad-funded rates through SoundExchange.
                                     Our US Internet team expects Pandora to pay $1.65 bn in total content acquisition costs in
                                     2020 (50% of its online radio revenue) up from $610 mn in 2015 (45% of its online radio
                                     revenue excluding one-offs). The increase is primarily driven by the launch of Pandora’s
                                     on-demand offering in 4Q16, from which the company expects to pay 65-70% of revenue.

                                     Leading satellite radio operator Sirius XM pays a flat fee out of its gross revenues. This rate
                                     has progressively increased by c.50 bp pa from 7.0% in 2010 to 10.0% in 2015 and is set to
                                     rise to 11.0% by 2017. Sirius XM paid royalty fees of $405 mn in 2015, up from $174 mn in
                                     2010 – an 18.5% CAGR (vs. a 7.9% CAGR in subscriber growth). Our US Telecoms team
                                     forecasts these fees to rise to $712 mn by 2020 at a CAGR of 12%. On January 5, 2016, CRB
                                     started a new proceeding to set music royalties for the 2018-2022 five-year period.

Goldman Sachs Global Investment Research                                                                                                                      19
October 4, 2016                                                                                                                                                                 Global: Media

Exhibit 22: We forecast Pandora’s royalty fees to increase                                Exhibit 23: We forecast Sirius XM’s royalty fees to
to $1.65 bn in 2020 from $610 mn in 2015                                                  increase to $712 mn in 2020 from $405 mn in 2015

 70.0%                                                                       $1,800         800                                                                                             16.0%

                                                                             $1,600         700                                                                                             14.0%
 60.0%
                                                                             $1,400         600                                                                                             12.0%
 50.0%
                                                                             $1,200         500                                                                                             10.0%
 40.0%                                                                       $1,000         400                                                                                             8.0%
 30.0%                                                                       $800
                                                                                            300                                                                                             6.0%
                                                                             $600
 20.0%                                                                                      200                                                                                             4.0%
                                                                             $400
                                                                                            100                                                                                             2.0%
 10.0%
                                                                             $200
                                                                                              0                                                                                             0.0%
  0.0%                                                                       $0

                                                                                                                                                   2016E

                                                                                                                                                            2017E

                                                                                                                                                                    2018E

                                                                                                                                                                            2019E

                                                                                                                                                                                    2020E
                                                                                                   2010

                                                                                                              2011

                                                                                                                       2012

                                                                                                                              2013

                                                                                                                                     2014

                                                                                                                                            2015
           2012

                  2013

                         2014

                                2015

                                       2016

                                                2017

                                                       2018

                                                               2019

                                                                      2020
                                                                                                          Sirius XM royalty payment ($mn, LHS)             Sirius Royalty rate (% of sales)
         Pandora total royalty payments         % of online radio revenue (LHS)

Source: Company data, Goldman Sachs Global Investment Research.                           Source: Company data, Goldman Sachs Global Investment Research.

                                          2.        In our view the rise of on-demand streaming services is even more positive for
                                                    rights owners as compared to satellite/internet radio
                                          Streaming services pay away a higher share of their revenue to rights holders than
                                          satellite and online radio. As on-demand streaming royalties are negotiated on the free
                                          market, streaming services generally pay c.70% of their revenues to labels and publishers
                                          (90/10 split) similar to the levels physical and digital retailers pay. Apple Music pays a
                                          slightly higher rate of 71.5% in the US and 73% elsewhere according to Recode. Pandora
                                          has stated that its on-demand offering will pay 65-70% of associated revenue to rights
                                          holders, and overall the company pays out 54% of music revenue to rights holders. Prior to
                                          signing the direct deals with rights holders, Pandora paid c.45% of its online radio revenues
                                          royalties in 2015 (excluding one-offs). Sirius XM, by contrast, pays away around 10% of
                                          their revenue as royalties as they benefit from lower CRB-regulated rates.

                                          Based on reported streaming revenue of $1.9 bn in 2015, this implies that roughly $1.361
                                          bn was paid as royalties to labels/publishers in 2015 alone.

                                          Exhibit 24: On-demand streaming services pay away around 70% of the revenue compared
                                          to 10% for Sirius XM and 45% for Pandora radio in 2015

                                              80%

                                              70%

                                              60%

                                              50%

                                              40%

                                              30%

                                              20%

                                              10%

                                               0%
                                                              Sirius XM                 Pandora                      On‐demand streaming

                                                                Royalty payments as % of Revenues subject to royalties

                                          Source: Company data, Goldman Sachs Global Investment Research.

Goldman Sachs Global Investment Research                                                                                                                                                      20
October 4, 2016                                                                                                     Global: Media

                                 Exhibit 25: Performance royalties for labels/artists more favourable in a digital world

                                 Source: Company data, Goldman Sachs Global Investment Research.

                                 On-demand streaming rates however vary significantly by individual contract and market.
                                 For instance, Spotify’s royalty calculation is not a fixed pay-per-play and depends on: 1) the
                                 country in which the user is based; 2) Spotify’s number of paid users as a percentage of
                                 total users; and 3) individual contract terms with the label and/or artist. The company
                                 indicates the average per stream payout to rights holders is between $0.60 and $0.84 per
                                 100 streams.

                                 Exhibit 26: Spotify royalty system

                                 Source: Spotify.

                                 Streaming rates are higher on a per-user basis. Much has been made of the dilutive
                                 nature of streaming services, with artists and labels arguing they do not receive equitable
                                 compensation compared to satellite radio. Based on Sirius XM’s royalty payments of
                                 $500mn in 2015, and an average song length of 3.5 minutes, we calculate that the implied
                                 royalty rate per play is $33.3, compared to fractions of a penny for Spotify and Pandora.
                                 What this argument ignores, however, is that Spotify is a one-to-one service, while satellite
                                 radio is a one-to-many (Sirius has 31 mn subscribers). Controlling for the number of users
                                 listening to a song, both Pandora and Spotify pay more on a per-user basis. We estimate
                                 that a song played on Sirius is listened to by 0.07% of Sirius’ 31 mn subscribers, which
                                 would imply a cost per play per million subscribers of $1,522, which is 10%-30% lower than
                                 Pandora’s historical per-play-per-million users rate of $1,700-2,200 and around 75%-80%
                                 lower than Spotify’s per-million streams rate of $6,000-8,400. As such, we see the
                                 migration to online streaming services as incremental to the market.

Goldman Sachs Global Investment Research                                                                                      21
October 4, 2016                                                                                                                                 Global: Media

                                          Exhibit 27: The shift to digital consumption drives higher royalty payments in the US
                                          Royalty per million streams, 2015

                                                                                                                                             $6000‐8400

                                                                                                                               $3,000
                                                                                                             $2,200
                                                                     $1,522             $1,700

                                                        $41

                                               US terrestrial      Sirius XM        Pandora, free           Pandora,       Video streaming    Spotify
                                                                                                          subscription

                                          Source: Spotify, Goldman Sachs Global Investment Research.

                                          Pandora’s move to on-demand streaming presents upside for rights holders. Pandora
                                          recently announced direct licensing agreements with record labels to launch an on-demand
                                          streaming service in the US in 2H16 alongside its existing digital radio service. Under the
                                          terms of the deal with UMG, Sony and independent labels, Pandora will pay away 65%-
                                          70% of its subscription revenue to rights holders (while the CRB arrangements led to a pay
                                          away rate in 1H16 of roughly 45% of its online radio subscription revenue). In conjunction
                                          with these direct deals, Pandora also negotiated new terms for its ad-funded online radio
                                          service and will pay away a LPM (licensing cost per 1,000 listener hours) of around $33
                                          from roughly $31 previously. The terms of the deal with Warner on the subscription service
                                          are unknown, but we would expect them to be similar to the other labels.

                                          With Pandora targeting $1.3 bn of subscription revenue by 2020 without cannibalizing its
                                          existing ad-funded radio business, this presents significant upside for the rights holders
                                          given the expansion of Pandora’s addressable market and the higher royalties in on-
                                          demand streaming as opposed to online radio. This will disproportionately benefit the
                                          labels, who typically receive 74% of the royalties from on-demand services compared to
                                          40% from online radio, while artists’ share will move to 11% from 40% (we argue however
                                          that artists’ absolute royalties will still be higher in the on-demand world).

Exhibit 28: Estimated distribution of Pandora’s                                       Exhibit 29: Estimated distribution of interactive
performance/neighbouring royalties                                                    streaming performance/neighbouring royalties in the US
                                                                                                                            PROs
                                       PROs                                                                  Songwriters     2%
                    Songwriters         2%                                                                        7%
                         7%                                                                            Publishers
              Publishers
                 7%                                                                                       7%
            SoundX
              4%
                                                                                                                Artists
                                               Labels                                                            11%
                                                40%

                             Artists                                                                                               Labels
                              40%                                                                                                   74%

Source: Goldman Sachs Global Investment Research.                                     Source: Goldman Sachs Global Investment Research.

Goldman Sachs Global Investment Research                                                                                                                  22
October 4, 2016                                                                                                                   Global: Media

                                      3.   Compounding this already positive picture is the move by many analogue
                                           operators to sign deals with labels to receive preferential royalty rates in order to
                                           launch their own digital services.
                                      In response to the migration of listeners from analogue to digital platforms, US AM/FM
                                      radio operator iHeartMedia “IHRT” launched an online radio service iHeartRadio in 2008
                                      under the same CRB regime as Pandora. The website garnered 90 mn of registered users
                                      as of August 2016. In 2012 IHRT’s parent company Clear Channel struck an unprecedented
                                      deal with label Big Machine whereby IHRT would pay an undisclosed percentage of its
                                      advertising revenue for digital and terrestrial radio play, despite being legally exempt,
                                      compared to the then digital royalty per play of $0.002. This was very favourable for rights
                                      holders, as terrestrial accounted for 98% of IHRT’s ad revenue and fees were said to be split
                                      50/50 with artists without any SoundExchange deduction of 4.9% (Billboard, June 5, 2012).
                                      In 2013, IHRT sealed another important agreement with Warner Music to pay royalties for
                                      terrestrial airplay in return for lower royalties for online streaming. Warner artists now
                                      receive extra promotion on IHRT’s 850 terrestrial stations and are being paid more, as
                                      Forbes reported that Clear Channel will pay WMG 1% of advertising revenue for terrestrial
                                      broadcasts, and 3% for digital. The return for Clear Channel is a discounted rate on its
                                      digital streams of Warner artists’ music, down from $0.22 per 100 streams to $0.12 per 100
                                      streams (Forbes, September 16, 2013). For comparison, Pandora in 2015 paid $0.14 per 100
                                      streams. More recently, IHRT announced its intention to launch an interactive streaming
                                      service iHeartRadio All Access together with an ad-free radio listening service in 2017. We
                                      view this as a positive for the labels given 1) they receive 55%-60% of revenues as royalties
                                      from interactive streaming services but nothing from US terrestrial radio, and 2) this will
                                      give labels the opportunity to include a fee for terrestrial airplays in their direct deals as
                                      illustrated by the IHRT/Warner Music deal.

Exhibit 30: IHRT agreed to pay WMG 1% of its ad revenue                     Exhibit 31: IHRT’s iHeartRadio service has seen a surge in
for terrestrial airplays, despite being legally exempt, in                  the number of users
exchange for discounted rates in digital                                    Number of registered iHeartRadio users (mn)
% of advertising revenue paid for terrestrial and digital radio
plays

 3.5%                                     Implies $0.12 / 100 streams        100                                                            90
                                       vs. $0.22 / 100 streams previously     90
 3.0%
                                                                              80
 2.5%                                                                         70
                                                                              60
 2.0%
                                                                              50
 1.5%                                                                         40
                  vs. 0% previously                                           30
 1.0%
                                                                              20
 0.5%                                                                         10
                                                                               0
 0.0%
                                                                                   Mar‐16
                                                                                   Mar‐14
                                                                                   Jun‐14
                                                                                   Sep‐14
                                                                                   Dec‐14
                                                                                   Mar‐15
                                                                                   Jun‐15
                                                                                   Sep‐15
                                                                                   Dec‐15

                                                                                   Jun‐16
                                                                                   Sep‐11
                                                                                   Dec‐11
                                                                                   Mar‐12
                                                                                   Jun‐12
                                                                                   Sep‐12
                                                                                   Dec‐12
                                                                                   Mar‐13
                                                                                   Jun‐13
                                                                                   Sep‐13
                                                                                   Dec‐13

                  Terrestrial radio               Digital radio

                                                                                              iHeartRadio # of Registered Users (mn)

Source: Forbes.                                                             Source: iHeart.

                                      Songwriters/publishers also benefit but to a lesser extent
                                      1.   Unlike artists/labels, songwriters/publishers are already getting paid by
                                           terrestrial radio for performance royalties in the US, so do not benefit to the same
                                           extent from the shift to satellite radio and online streaming.

Goldman Sachs Global Investment Research                                                                                                    23
October 4, 2016                                                                                                                                          Global: Media

                                     2.    For mechanical royalties in the US, streaming currently offers lower royalty rates
                                           than physical/downloads. But there is upside from higher streaming
                                           consumption and the upcoming CRB review.
                                     Publishers/songwriters currently receive a $0.091 mandated rate per reproduced copy of a
                                     song (CD, vinyl, MP3, etc.) independently of whether that copy is sold. Outside of the US
                                     the rate typically varies in the range 8%-10% of wholesale prices for physical
                                     products/consumer prices for digital products, according to digital music distribution
                                     company TuneCore. When moving to interactive streaming services, the government-
                                     mandated rate is at least 10.5% of the gross revenue after deduction of the payments to
                                     collection societies such as ASCAP (the American Society of Composers, Authors and
                                     Publishers), BMI (Broadcast Music, Inc.) and SESAC (The Society of European Stage
                                     Authors and Composers).

                                     This would imply average payment per 100 streams of about $0.05 according to music
                                     royalty collection company Audiam. We calculate this implies that 182 streams of one song
                                     would be needed to equate to the mechanical royalty generated from one reproduction.
                                     Using the Recording Industry Association of America (RIAA) and Nielsen data for the
                                     number of physical and digital copies sold and the number of audio streams consumed, we
                                     calculate that there were 113 more audio streams consumed than physical/digital copies
                                     sold in 2015 meaning streaming is currently dilutive. However, we forecast that ratio to
                                     grow to 209:1 in 2016 and 1180:1 by 2020. Even though the growth in streaming value does
                                     not follow the growth in consumption (Spotify’s paid streaming ARPU does not depend on
                                     individual consumption, although ad-funded revenues do), we believe the increase in
                                     streaming consumption will be able to compensate for lower royalty rates. Warner Music’s
                                     2015 10K form reveals that its revenue from digital mechanical royalties exceeded physical
                                     for the first time in 2015.

                                     The upcoming CRB review of songwriting mechanical rates applicable to interactive
                                     streaming services such as Spotify or Deezer could totally change the way
                                     songwriters/publishers are getting paid (see next section).

Exhibit 32: 182 streams of one song currently needed to                    Exhibit 33: Digital mechanical royalties are already
match the revenue from one unit sale – we forecast the                     exceeding physical for Warner
number of streams in comparison to unit sales to exceed                    Warner/Chappell breakdown of publishing revenue, $ mn
182 from 2016

 1400                                                                       300

 1200                                                                       250

 1000                                                                       200

  800                                                                       150

  600                                                                       100

  400                                                                        50

  200                                        1 reproduction =182 streams      0
                                                                                   2005

                                                                                          2006

                                                                                                 2007

                                                                                                           2008

                                                                                                                   2009

                                                                                                                          2010

                                                                                                                                 2011

                                                                                                                                        2012

                                                                                                                                                  2013

                                                                                                                                                           2014

                                                                                                                                                                  2015

    0
         2013     2014   2015   2016E     2017E   2018E   2019E   2020E              Physical Mechanical          Performance                  Synchronisation
                                                                                     Digital Mechanical           Other

Source: Goldman Sachs Global Investment Research.                          Source: Warner Music Group data.

                                     3.    In Japan, the online shift is positive for songwriters/publishers, as physical
                                           mechanical royalty rates are typically 1%-2% lower than digital to compensate for
                                           their higher manufacturing costs known as the “record cover fee”.

Goldman Sachs Global Investment Research                                                                                                                                 24
October 4, 2016                                                                                                    Global: Media

                                 Future regulatory changes could present upside for rights holders
                                 1.   The US review of safe harbour rules and implications of the recent EU Copyright
                                      proposal will be important in addressing the value gap between the usage and
                                      monetization of music on platforms such as YouTube.
                                 What are safe harbour rules? These provisions exempt passive, neutral hosting platforms
                                 from copyright infringement liability for the actions of their users. Put another way, online
                                 service providers, including YouTube and internet service providers, are not responsible
                                 for vetting whether or not the users are putting copyright cleared content on their platform.
                                 When rights holders find evidence of copyright infringement, they have to submit a formal
                                 notice to YouTube for instance to request a copyright takedown. To its credit, YouTube has
                                 a finger printing system called Content ID, which enables labels and artists to identify and
                                 manage their work and entitle them to a share of the advertising revenue (if any).

                                 Why do they matter? Many artists and industry bodies have complained about YouTube’s
                                 use of those safe harbours which give it an unfair advantage in negotiations with rights
                                 holders. For instance, a label which does not sign a licensing deal with YouTube will have
                                 to actively monitor that its content does not appear on YouTube and if so request it to be
                                 removed. YouTube also shares 55% of its music ad revenue with rights holders (according
                                 to Music Business Worldwide “MBW”), with labels receiving 45% and publishers 10%.
                                 This compares to the standard 70% payout rate from other non-regulated platforms (iTunes,
                                 Spotify, etc.), with labels receiving 60% and publishers 10%. This situation has resulted in a
                                 rising “value gap” between the amount of streams consumed on YouTube and their
                                 monetization for rights holders. YouTube accounted for 40% of overall music listening
                                 according to Apple Music’s Jimmy Iovine, with c.90% of the 900 mn ad-supported music
                                 users reported by IFPI, and yet generated only 4% of global recorded music revenues ($634
                                 mn in 2015), which is lower than the revenues from vinyl sales. In contrast, paid streaming
                                 revenues were almost 4x higher at $2.3 bn in 2015 and were generated by only 68 mn
                                 paying users.

                                 What’s next? The EC just came out with its highly anticipated draft Copyright Directive.
                                 The new proposals will require platforms such as YouTube to enter negotiation with rights
                                 holders in good faith and put in place “appropriate and proportionate” measures to
                                 identify and remove unlicensed copyrighted content, therefore putting greater
                                 responsibility on/demanding more proactivity from the platform owners. Previously the
                                 likes of YouTube had to wait for a formal takedown request from rights holders – this will
                                 still be the case, however, if no agreement has been reached. We believe that YouTube
                                 should be less impacted than other services as it already has effective content recognition
                                 and removal processes in place. Nonetheless, as the EC puts it, this should “reinforce the
                                 position of rights holders to negotiate and be remunerated for the online exploitation of
                                 their content on video-sharing platforms such as YouTube or Dailymotion.” These
                                 proposals will still need to go to Parliament and individual member states for approval,
                                 while the effective implementation of such measures remains unclear and is likely to take
                                 time.

                                 Separately, the US Copyright Office is currently reviewing copyright rules including safe
                                 harbour provisions (also called DMCA 512 in the US) with a decision expected in 2017. In
                                 April 2016, 400 artists, songwriters and music bodies sent a letter to the US Copyright
                                 Office pleading for reforms to the DMCA. They were followed by another 180 artists and
                                 songwriters (including Taylor Swift, Lady Gaga, Paul McCartney, etc.) in June.

                                 2.   The CRB is currently engaged in proceedings to set the new mechanical
                                      songwriting royalty rates applicable to interactive music services for 2018-2022,
                                      with a decision expected by end-2017.
                                 This review will be much in focus, given Apple’s recent proposal that all interactive
                                 streaming services should pay a statutory rate of $0.091 per 100 streams. Note that this
                                 rate would not apply to Apple given that it has direct deals with publishers in place. The
                                 current rate is set as a percentage of revenue and varies depending on whether the user is

Goldman Sachs Global Investment Research                                                                                     25
October 4, 2016                                                                                                                                         Global: Media

                                         a subscriber or non-subscriber – on average it implies around $0.05 per 100 steams
                                         according to Audiam. A move towards a higher, unified rate would be more damaging for
                                         freemium streaming services, although positive for songwriters/publishers.

Exhibit 34: Ad-funded services (mainly YouTube)                                         Exhibit 35: The value gap: YouTube accounts for 40% of
generated 4x less revenue than paid streaming despite                                   music listening but 4% of recorded music revenue
13x more users
 2,500                                                                     35            45%

                                                                           30            40%
 2,000
                                                                                         35%
                                                                           25
                                                                                         30%
 1,500                                                                     20
                                                                                         25%

 1,000                                                                     15            20%

                                                                           10            15%
   500                                                                                   10%
                                                                           5
                                                                                          5%
     0                                                                     0
                                                                                          0%
                    Subscription                Ad‐supported
                                                                                                   Youtube proportion of music    Youtube proportion of recorded music
                Users (m, LHS)     Revenue ($m, LHS)       ARPU ($)                                       consumption                          revenue

Source: IFPI.                                                                           Source: Apple, IFPI.

                                         Exhibit 36: Labels receive a lower share of royalties from YouTube than from other digital
                                         services
                                         Estimated split of YouTube vs. industry standard music royalties

                                              Youtube,                    Labels, 45%                          Platform,
                                                45%                                                               30%
                                                                                                                                          Labels, 60%
                                                                                                Publishers,
                                                            Publishers,
                                                                                                   10%
                                                               10%

                                                       Youtube Music revenue split                      Standard revenue split (iTunes, Spotify etc)

                                         Source: Music Business Worldwide, Press reports, Goldman Sachs Global Investment Research.

                                         3.    Potential changes to copyright protection of pre-1972 sound recordings.
                                         Songs recorded before February 15, 1972, are currently not protected by US federal
                                         copyright law, but are protected under state law in some jurisdictions. This resulted in CRB-
                                         regulated entities such as Pandora and Sirius XM not paying royalties for their use. In 2015,
                                         Pandora and Sirius XM both agreed to settle with the major labels for $90 mn and $210 mn,
                                         respectively, for the use of such rights until end-2016 for Pandora and end-2017 for Sirius
                                         XM. Unless regulation evolves to include pre-1972 recordings in US federal law, the two
                                         players will need to extend their deals with labels to keep playing those songs.

                                         4.    The CRB has commenced proceedings to set new royalties for digital
                                               performance of sound recordings to be paid by satellite radio service Sirius XM
                                               for 2018-2022.

Goldman Sachs Global Investment Research                                                                                                                             26
October 4, 2016                                                                                                     Global: Media

   An interview on EU music regulation with…
                                             An interview with…
                                John Enser, Head of Music and Partner, Olswang

                         John is Head of Music and a               then and they don’t have to stop that going back up again.
                         Partner in the Media Team at              So, they have the Content ID tool which enables rights
                         international law firm Olswang            holders to make their own choices based on whether the
                         LLP. Acknowledged as an expert in         rights holder wants the material removed or is willing for
                         all of the leading directories of         it to be left in return for a revenue share. But the problem
                         lawyers, his client-base includes         is that if you choose not to be part of the Content ID
                         record companies, broadcasters,           scheme, all that you can do is to have your material taken
                         other content aggregators and             down and it keeps coming back up again. YouTube argues
                         distributors and mobile operators         that they do license their rights, but, from the label
as well as companies that invest in and lend to the sector.        perspective, it is always with one hand tied behind their
                                                                   back, as it is under the threat that YouTube will just use
                                                                   the safe harbour. Sure, they do have deals with all the
What are the main regulatory intricacies in Europe?
                                                                   majors, but the economics of those deals are different
One of the key challenges is fragmentation: whilst on the          from what they would be if there was no safe harbour
recording side you can do deals that cover the entire              regime.
European landscape by doing deals with the majors and
                                                                   The safe harbour works in a similar way in respect of true
Merlin (which represents the indie labels), on the publishing
                                                                   pirate sites, Pirate Bay and the like, where the music
side, it is exceedingly complex and an ever moving picture
                                                                   industry want to make it harder for people to find those
because of the role of the collecting societies, who control
                                                                   sites. For that reason, the music industry has sent billions
both the performing right and, often, also the copying right,
                                                                   of take down notices to Google – that’s about the search
both of which are needed for digital exploitation. In many
                                                                   engine, rather than YouTube – if you search for the newest
countries, a collecting society is granted exclusive rights
                                                                   Rihanna single, the chances are that 4 out of the top 10
directly from the composers, so music publishers aren’t in a
                                                                   research results will be pirate pages. So, the debate is
position to aggregate rights. That leaves a pretty messy
                                                                   partly about Google and search engines, about them
picture where, to launch a pan-European service you need to
                                                                   taking more responsibility to get rid of links to pirate sites
do around 30 deals on the publishing side – and realistically
                                                                   and to keep those links down. The YouTube issue is
you can't launch a service without getting the vast majority
                                                                   slightly different but it is very similar because the
of the repertoire. That clearly is good for the big players and
                                                                   argument is if you don’t play along with YouTube’s way of
gives a significant barrier to entry. This is part of the reason
                                                                   doing things, the only thing you can do is send DMCA
why Pandora packed up and went home some years ago.
                                                                   complaint notices and have the material disappear only to
How are royalties set in Europe?                                   pop back up again. So your choices are to either get rid of
                                                                   it or monetize it on their terms.
Contrary to the US, in Europe it is more of a free market, but
it does vary from country to country. In some countries there      The EC just released its draft copyright package - what
are tribunals, arbitration bodies, like the CRB in the US          could the implications be?
although not as powerful, that set the rates. The UK is
                                                                   Platforms making available large amounts of copyright
probably the closest structure to the US. In most of
                                                                   material which is uploaded by users will be required to
continental Europe, the collecting societies often have some
                                                                   enter into negotiations with rights owners in good faith
degree of royalty rates review by some form of government
                                                                   and to put in place "appropriate and proportionate"
agency with various degrees of rigour and independence.
                                                                   measures to ensure the functioning of those agreements
How does the safe harbour regime work and how does                 with rights-holders in relation to the use of their works.
that benefit YouTube?                                              Some platforms, like YouTube, have these processes in
                                                                   place already but not all do and even those that do are
The way it works effectively is that, because YouTube
                                                                   subject to on-going criticism for not ensuring that
doesn’t have editorial control, if somebody else posts a
                                                                   infringing content stays down. The Commission believes
video onto YouTube, their only obligation is to take it down
                                                                   that the fact that many platforms benefit from the safe
once they’re on notice. They don’t have to do anything until

Goldman Sachs Global Investment Research                                                                                      27
You can also read