STATE OF THE VETERAN COMMUNITY - 2018 REPORT - California Association of Veteran Service Agencies (CAVSA) - California Association of ...
←
→
Page content transcription
If your browser does not render page correctly, please read the page content below
STATE OF THE VETERAN COMMUNITY
                   2018 REPORT

California Association of Veteran Service Agencies (CAVSA)
            Kathleen M. West, DrPH, Consultant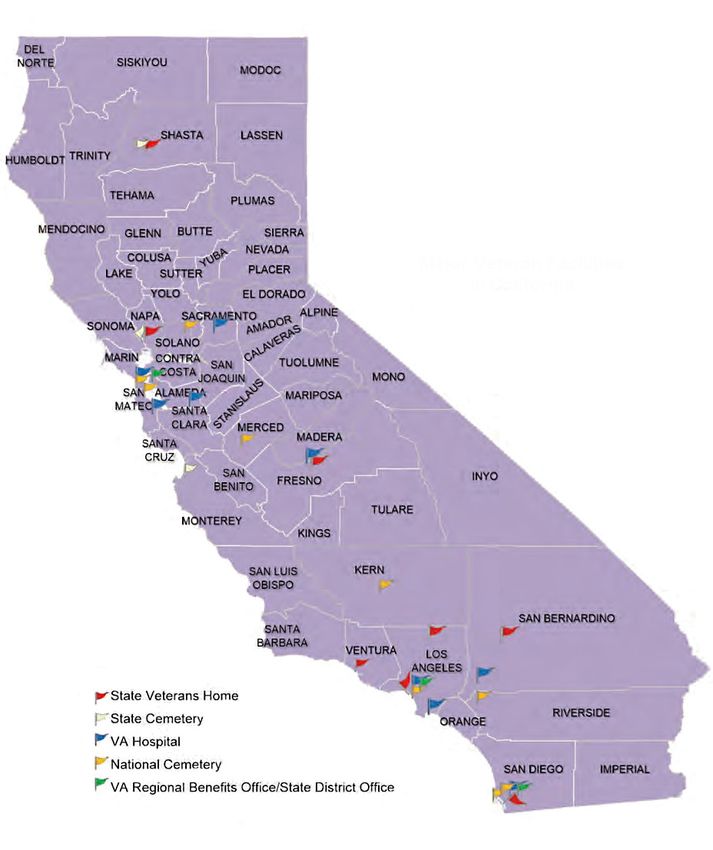
“Recognizing that California’s veterans have many identities as civilians,
CAVSA is eager to work beyond the veteran “silo” to better meet the needs
of our veterans and their families - at all times and in all circumstances.”
-- Stephen Peck, CAVSA Board President
   U.S. VETS, President and CEO

                                                                   “Knowing is not enough; we must apply.
                                                                       Willing is not enough; we must do.”
        `								                                                                 			                                -- Goethe*
                                                Report Development Team
                                                    Kathleen M. West
                                     Christopher G. Capron    CAVSA Agency Members
                                            Charles Helget    Joan Purser

                                       Graphic Design and Report Production
                                                            Sai Merriam

                              California Association of Veteran Service Agencies
                                                   980 9th Street, 16th Floor
                                                 Sacramento, California 95814

 This report was approved by the California Association of Vet-      Additional copies of this Report are available from CAVSA at
 eran Service Agencies Board of Directors, August 2018. This         the above address and in PDF format for download at http://
 report and its development was supported by funding from            californiaveterans.org/
 the MHSOAC – RFP 16MHSOAC034 Veterans.
 The purple in the shaded map of California represents all           *This quote by Johann Wolfgang von Goethe, famous 18th
 branches of service in which California’s diverse veterans have     century German scientist and statesman, is used in the open-
 served. The blue shading represents California’s vigilance,         ing page of the Institute of Medicine’s landmark 2010 report
 perseverance and justice in serving veterans. The red letter-       “Returning Home from Iraq and Afghanistan - Preliminary As-
 ing symbolizes the honor and valor with which our veterans          sessment of Readjustment Needs of Veterans, Service Mem-
 have served. The white background symbolizes the purity             bers, and Their Families” which outlined the needs of U.S. vet-
 and sacrifice of our nation’s veterans and their families.          erans – it still applies.

                              Copyright 2018 by the California Association of Veteran Service Agencies.
                                     Please contact CAVSA for permission to duplicate contents.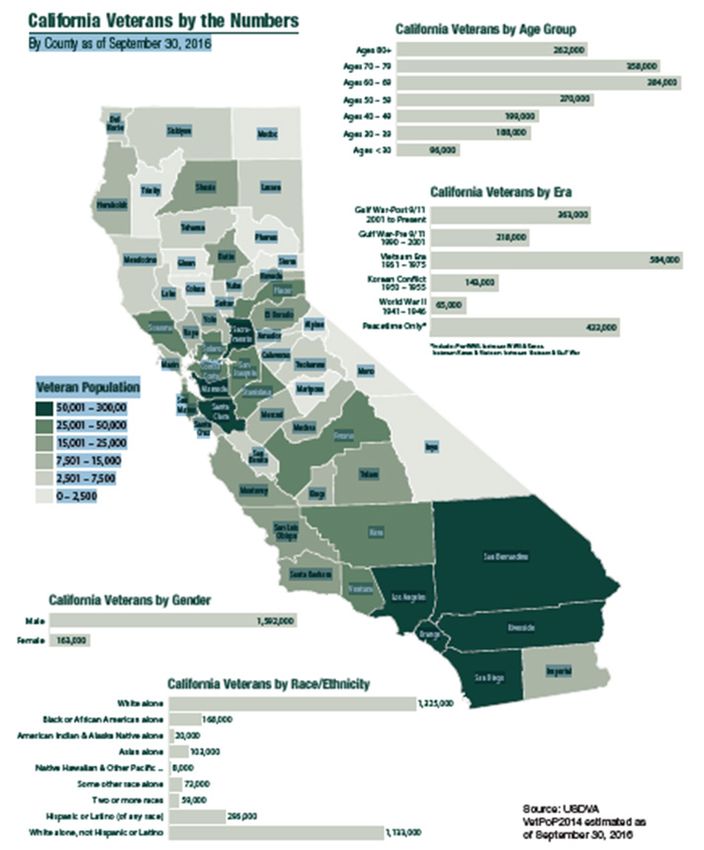
ACKNOWLEDGMENTS

As Executive Director, on behalf of the Board          CAVSA plans to widely share this Report to help
of the California Association of Veteran Service       close the gaps in services for our veteran com-
Agencies (CAVSA), and as the CAVSA consultant          munities and honor your shared insights that
charged with drafting this first State of the Vet-     importantly contribute to our advocacy agenda.
eran Community-Report 2018 for the Mental              By improving cross-agency and multidisciplinary
Health Services Oversight and Accountability           communication, we can reduce our silo-ed think-
Commission (MHSOAC), we are grateful for the           ing and expand our stakeholder communities to
opportunity to engage with such a meaningful           improve California’s public mental health services
task. The support of CAVSA agency leadership in        system for veterans and all Californians. Recog-
conceptualizing the scope of work for the report       nizing that our veteran constituents and their
and ultimately distilling it to focus on five of the   families are members of multiple groups, we are
most critical issues for consideration in Year 1 has   eager to collaborate with other mental health
been very important. (See Table 8 Recommenda-          advocates across sectors and look forward to de-
tions, p. 46)                                          veloping effective strategies to deliver improved
                                                       services for California veterans and their families
Equally important has been the cooperation of          in the coming years.
several key organizations, staff, and 201 individu-
als who participated in the Veteran Mental Health
Services Survey which came together in record
time from May to July 2018. The organizations
that deserve special thanks for encouraging their
community’s participation in the survey include:                                              Chuck Helget
the California Department of Veteran Affairs                                              Executive Director
(CalVet), the California Association of Collabora-
tive Courts, the California Association of County
Veteran Service Officers, STAR Behavioral Health,
the Steinberg Institute, the Center for Judicial
Education and Research at the California Judicial
Council and each of the CAVSA member agencies:                                     Kathleen M. West, DrPH
Swords to Plowshares, U.S. VETS, Veterans Village                                        Report Consultant
of San Diego, the California Veterans Assistance
Foundation, Veterans Resource Centers of Amer-
ica, Veterans Housing Development Corporation,
and New Directions for Veterans. During the
peak season for graduations and vacations, we
are grateful for everyone who took the time to
respond to our survey and share your thoughts
and knowledge about your local community’s ex-
perience with veteran and veteran family mental
health concerns.

                                                                   CAVSA State of the Veteran Community Report   1
TABLE OF CONTENTS

Acknowledgements                                                        1
Table of Contents                                                       2
List of Maps, Figures, and Tables                                       3
Preface                                                                 4
Section I. Introduction and 2018 Report Card                            5
2018 Report Card                                                        6
Challenges due to Lack of Veteran-Specific Data                         8
Statement of Task                                                      10
Section II. Methodology – Approach to Task                             11
Community Based Anonymous Survey                                       11
County MSHA 3-Year Plan and Annual Update Reviews                      12
“Secret Shopper” Phone Calls                                           12
Section III. California Veteran Community Overview                     13
Changing California Veteran Demographics                               13
Increase in Older Veterans                                             13
Women Veterans                                                         16
Homeless Veterans                                                      18
Section IV. Leading Concerns in CA Veterans’ Mental Health & Welfare   20
Veteran Suicide                                                        20
Substance Use Disorders (SUDS) and Opioid Concerns                     24
Mental Health Challenges of Older Veterans                             26
Veteran Justice System Involvement                                     26
Veteran Homelessness                                                   32
VHA Utilization in California                                          35
VA Access & Challenges of Veteran Population                           36
Section V. Veteran Mental Health Services in California                38
Key Interviews Summary                                                 39
Highlights from CAVSA Mental Health Services Survey                    40
Biggest Challenges                                                     40
Veteran Families                                                       40
Veteran Mental Health Providers & Services                             41
Barrier of Stigma                                                      42
Veteran Treatment Courts                                               42
Highlights from MHSA 3-Year Plan Reviews                               43
Section VI. Recommendations                                            46
Section VII. Postface                                                  48
References                                                             49
Appendix A. Online Survey Questionnaire                                55

   2      CAVSA
LIST OF MAPS, FIGURES, AND TABLES

MAPS

Map 1       California Veterans Overview: “By the Numbers”                                                             14
Map 2       Veterans as Percentage of California County Population                                                     15
Map 3       National Estimates of Homeless Veterans 		                                                                 19
Map 4       VA Facilities in California                                                                                37
Map 5       MHSA 3-Year Plan Review Counties                                                                           43

FIGURES

Figure 1    Veteran Age Distribution                                                                                   16
Figure 2    Women Veteran Marriage                                                                                     17
Figure 3    Women Veteran Divorce                                                                                      17
Figure 4    National Homeless Statistics Graph                                                                         19
Figure 5    Veterans at VHA with SUDS & Mental Health                                                                  22
Figure 6    Suicide Precipitating Factors                                                                              23
Figure 7    Methods of Suicide and Mental Health                                                                       24
Figure 8    California Suicides                                                                                        24
Figure 9    California Opioid Overdose Deaths                                                                          25
Figure 10   Incarcerated Veterans Compared to U.S. Veteran Population                                                  27
Figure 11   Veteran Rate of Incarceration                                                                              27
Figure 12   Veteran Treatment Court Growth Chart                                                                       31
Figure 13   Maslow’s Hierarchy of Needs                                                                                33
Figure 14   Inventory of Beds for Homeless Veteran Population                                                          34
Figure 15   Post-9/11 Low VHA Enrollment & Low Utilization                                                             36
Figure 16   Post-9/11 High Disability & High Poverty                                                                   36

TABLES

Table 1     Report Card Markers of California Veterans                                                                  6
Table 2     CA Veteran and CA General Pop Suicide Rates                                                                21
Table 3     CA Veteran, West Region Veteran, & National Veteran Suicide                                                21
Table 4     California Counties Veteran Treatment Courts List                                                          29
Table 5     Post-9/11 Veteran Largest Cohort                                                                           36
Table 6     Mental & Behavioral Services at VHA Facilities                                                             38
Table 7     MHSA Review & Secret Shopper Comparison                                                                    45
Table 8     Recommendations                                                                                            46

                                                                     CAVSA State of the Veteran Community Report   3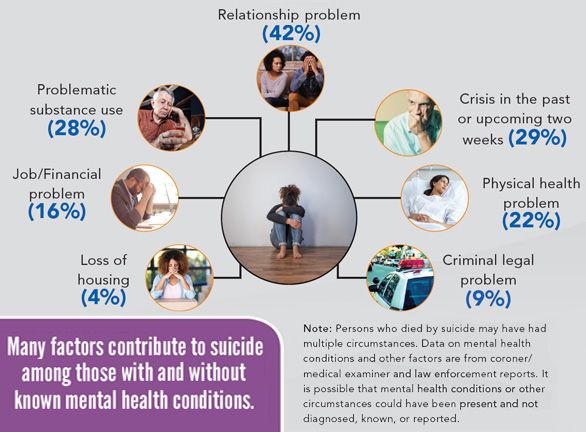
PREFACE

As this report is published, we will be commemo-                     Unlike the Vietnam-era, there is now a broad societal
rating the 17th anniversary of the infamous “9-11”                   recognition that wars often cause ongoing adverse
attacks that ushered in the “Global War on Terror”                   effects for the service members who were engaged
(GWT) and launched the U.S. and its All-Volunteer                    with the war effort – whether in combat or not.
Force (AVF) on an uncharted and arduous path. With                   Paralleling the years of war, we now have years of
its series of Operations* that are ongoing to this day               research that point us in the direction of “what to
and in which about three million service men and                     do,” as well as literally thousands of new non-profits
women have served, the GWT is now the United                         and trillions of new private funds dedicated to veter-
States’ longest war. Children born in 2001 are now                   an and military issues. There has been less societal
preparing for adulthood in a nation that has been at                 acknowledgement of the economic commitment re-
war their entire lives.                                              quired to help former service members reconstruct
                                                                     their lives and the reality that “an ounce of preven-
                                                                     tion is worth a pound of cure.” Many of our aging
                                                                     Vietnam, Korean, and WWII veterans who failed to
                                                                     receive timely care upon their return have suffered
                                                                     for decades. Society and their families have often
                                                                     suffered alongside them as they’ve occupied alcohol
                                                                     and drug treatment programs, unemployment lines,
                                                                     homeless shelters, and jail cells over the years. Many
                                                                     thousands more have demonstrated their resilience
                                                                     and with support, have reclaimed productive civilian
                                                                     and fulfilled lives to the benefit of us all.

                                                                     As our Post-9/11 veterans become the largest war
                                                                     era population, it is critical that California steps up
* Operation Enduring Freedom (OEF), Operation Iraqi Freedom, (OIF)   to ensure that their life trajectory and that of their
Operation New Dawn (OND) and Operation Freedom’s Sentinel (OFS)
– the latter to which 400 California National Guard most recently    families is as healthy as possible. Although the U.S.
deployed in August 2018.                                             Department of Veterans Affairs (USDVA) currently
California has played a leadership role in these nearly              does not have a website or accessible data base ded-
two decades of combat deployments with more mili-                    icated to OEF, OIF, OND, and OFS veterans, reliable
tary installations than any other state and the largest              data about this population is essential for program
National Guard force in the U.S. This report challenges              planning, implementation, and accountability. The
California to continue its key role in the deployment                absence of reliable California-specific data is noted
cycle by competently and compassionately receiving                   throughout this report, but should not deter from
home our service members as they transition to civil-                taking purposeful steps to remedy the identified
ian life as veterans. As home to the largest veteran                 challenges, while simultaneously working toward
population in the U.S., California has the unique op-                better data to inform programs and improve trans-
portunity to lead the nation with our demonstration                  parency. Findings here about the State of the Vet-
of the will and allocation of the means to “do right                 eran Community in California make it clear that long
by” our veterans and their families who served in our                after the “last shot is fired” our veterans require our
stead. If the AVF model is to persist and succeed, our               long-term commitment to help rebuild their lives and
efforts to support our veterans and their families is                thank them for their service with more than words.
not only a moral obligation, but an AVF imperative,
essential to recruiting a socio-economically diverse
and high-quality military of the future.

     4      CAVSA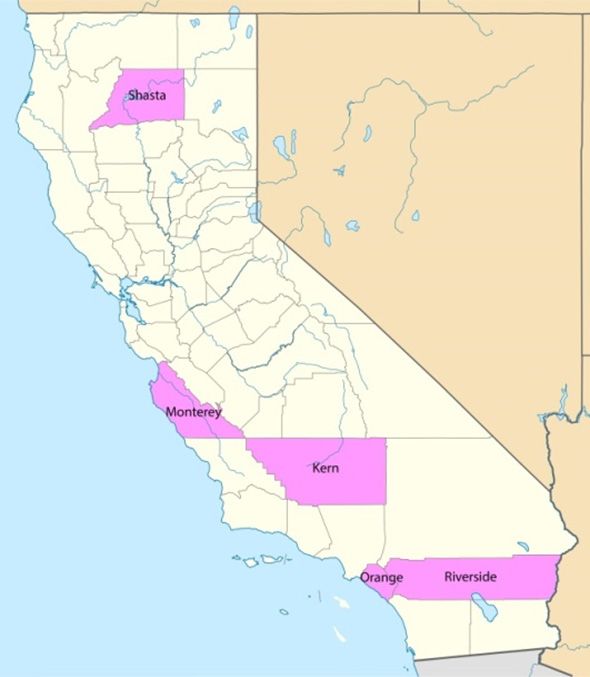
SECTION I. Introduction and 2018 Report Card

The California Association of Veteran Service Agencies (CAVSA) is a consortium of vet-
eran service organizations dedicated to providing an array of veteran-specific services
to veterans and their families in twenty-five California counties and adjacent areas,
as well as providing state and nationwide veteran advocacy. Each agency’s services
are based on their individual mission and goals that are informed by the needs of
veterans in their regions. This first report on the “State of the Veteran Community”
in California is the result of key informant interviews, CAVSA’s Veteran Mental Health
Survey, conducted statewide from May to July 2018, literature and report review, and
data compilation. Findings from this report confirm the relevance and importance of
CAVSA’s mission. It has also improved our understanding and expanded our view of
the critical issues for which we must step up our advocacy, services, and education in
the coming year.

                                                                  CAVSA State of the Veteran Community Report   5
2018 Report Card

Table 1 below is CAVSA’s “2018 Report Card” that provides a snapshot of the status of Cal-
ifornia veterans with regard to several key issues that emerged in the development of this
report. These four measures of mental health and well-being of California veterans compared
to veterans nationally and their non-veteran Californian counterparts show a complex and
mixed picture of California veterans’ current situation which will be elucidated in the following
sections of this report.

Table 1. 2018 Report Card: Comparative Markers of Concern for California Veterans

       MEASURE                 NATIONAL                                     CALIFORNIA
                                                     NATIONAL                                       CALIFORNIA
     Unless specified all     GENERAL U.S.                                   GENERAL
                                                     VETERAN                                         VETERAN
   rates are age-adjusted     POPULATION                                    POPULATION

                              T= 553,742               40,056                  134,278                 11,472
 1. HOMELESSNESS               (.17% of total        (9% of all              (24% U.S. total)    (29% of all homeless
                                  U.S. pop)       homeless adults)        .34% of CA total pop       U.S. veterans)
    (PIT Count 2017)          438,913 Adults                                                       .63% of CA total
          AHAR *                                                                                  veteran Population
                              193,900 (35%)         15,366 (38%)             91,642 (68%)             7,657 (67%)
                               unsheltered          unsheltered              unsheltered             unsheltered

        2. SUICIDE            17.3/100K ‡          29.7/100K ‡              13.6/100K ‡             28.8/100K ‡

 Rates cited indicate est.
   range. Top row data        (13.4/100,000 †                               (10.5/100,000 †
 from 2015. Bottom row       2016 Population)                             CA 2016 Population)
     data from 2016.

                             13.3/100,000 ‡     19.85/100,000 §           4.49/100,000 ◊
        3. OPIOID                                    Person Years                                No California-specific
        OVERDOSE               Population                                   CA Population
                                                                                                  Data or Estimate is
         DEATHS                                       2005 VHA                                        Available
                               (2016 data)                                   (2017 data)
                                                     Patient Data

                             2.3 million **         181,500 ※                138,000 ⁂
     4. JUSTICE                                                                                  No California-specific
   INVOLVEMENT                                   8% of total U.S. Adult     (Adult Inmates        Data or Estimate is
                                                Inmates, 2011-12 Data                                 Available
 (INCARCERATION)                                                             Under CDCR)
                                                    (Most Current)            2017 Data
                                                Also about 8% of Total
                                                 U.S. Population, 2016

    6      CAVSA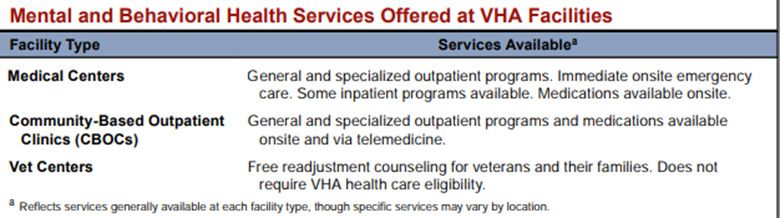
Report Card References and Notes

1. HOMELESSNESS:
* https://www.hudexchange.info/resources/documents/2017-AHAR-Part-1.pdf
    http://worldpopulationreview.com/states/california-population/
    California’s estimated total population is 39.78 million according to the World Bank
    and US Census Bureau

2. SUICIDE:
    https://www.mentalhealth.va.gov/docs/data-sheets/2015/California_2015.pdf
    Data from the top row under “suicide” is not age-adjusted.
† Centers for Disease Control and Prevention, National Center for Injury Prevention and
    Control. Web-based Injury Statistics Query and Reporting System (WISQARS) (2017).
    Accessed June 7, 2018. Available from URL: www.cdc.gov/injury/wisqars. Data in
    parentheses is 2016 age-adjusted data, suggesting suicide rates may be declining.
    Veterans and non-veterans are included.

3. OPIOID OVERDOSE DEATHS:
 ‡ 2016 WONDER data released 2017 by CDC. Accessed at http://wonder.cdc.gov/mcd-
    icd10.html on January 31, 2018
§ “Nearly twice the rate of the general U.S. population”, https://www.ncbi.nlm.nih.gov/
    pubmed/21407033 Bohnert, et al. “Accidental Poisoning Mortality Among Patients in
    the Department of Veterans Affairs Health System.
◊ California Department of Public Health 2017 Preliminary Data. https://discovery.
    cdph.ca.gov/CDIC/ODdash/

4. JUSTICE INVOLVEMENT:
** https://www.prisonpolicy.org/reports/pie2018.html
※   https://www.bjs.gov/content/pub/pdf/vpj1112.pdf
⁂   https://lao.ca.gov/Publications/Report/3595

                                                                        CAVSA State of the Veteran Community Report   7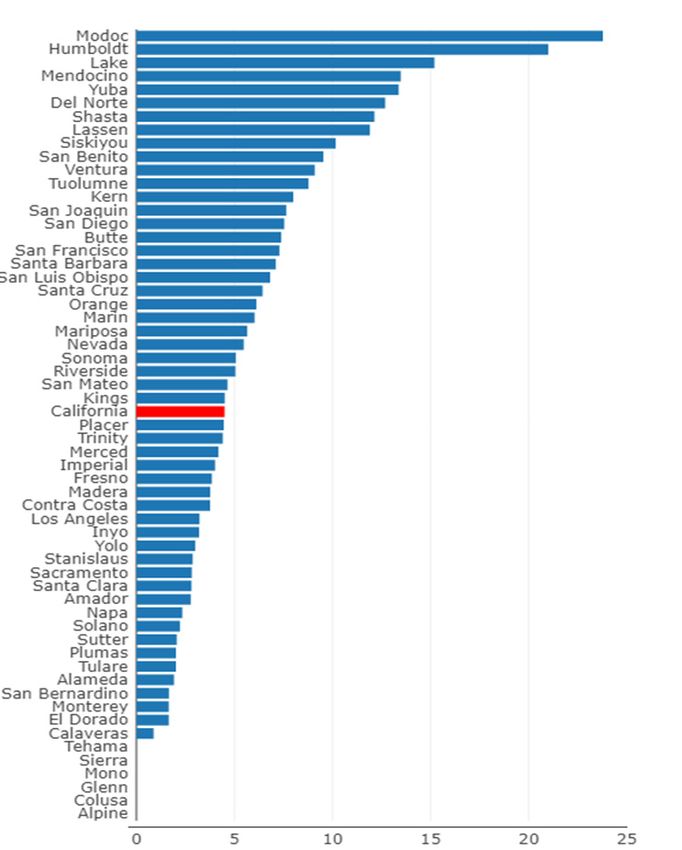
Challenges Due to Lack of Veteran-Specific Data

Two issues of major concern that emerged in developing this report but that are not
reflected in Table 1 due to lack of data are:
1) A notable absence of partnerships,                    While this most recent 2017 situation is alarming,
                                                         CAVSA has been alert to the life-and-death signif-
shared knowledge, and formal com-
                                                         icance of the status of “homelessness” for many
munication between Veteran Service                       years. A long-standing and increasing focus across all
Organizations (VSOs) and non-veteran                     CAVSA agencies is the delivery of services to veterans
service organizations.                                   who are homeless, chronically homeless, or at-risk of
                                                         homelessness and the attendant mental and physical
                                                         health and social stability issues that housing insecu-
2) The absence of up-to-date California                  rity engenders. Although the absolute numbers and
veteran-specific data on a wide range                    percentage of California veterans who are homeless
of issues and categories of veteran                      is less than 1% of California’s total veteran popula-
                                                         tion (according to the 2017 Annual Homeless Assess-
populations.
                                                         ment Report – Part I (AHAR) See Table 1), a host of
                                                         co-occurring problems are linked with homelessness.
The absence of California veteran-specific data is ob-   Research on homelessness has shown associations
vious in Table 1 itself. Due to the pervasiveness of     with increased likelihood of incarceration, stigma,
these issues, Section VI Recommendations #3 and          loss of employment, mental illness, substance use
#5 tackle these topics with nine proposed actions to     disorders, violent victimization, disproportionate
help remedy these problem areas that seem to have        use of emergency departments for health care, and,
an adverse impact on California veterans and their       for those who are unsheltered, premature mortali-
families.                                                ty, as mentioned above. (Clough; U.S. Conference of
                                                         Mayors; Natl. Ctr. On Family Homelessness; Erickson;
Notwithstanding the limited California-specific data     Greenberg; Larimer; Hunter; Morrison)
available for Table 1 measures, California veterans’
2018 status with regard to “Homelessness” is bleak       Of growing concern, though not evidenced in the
– especially on a measure that is of major concern:      gross numbers presented in Table 1, is the fact that
unsheltered homelessness. While this variable has        women veterans across the U.S. constitute a grow-
had dramatic shifts annually based on the “Point in      ing number of the homeless veteran population. The
Time” Count (See Section IV for more information)        number of homeless women veterans reportedly
this sobering 2017 data must inform CAVSA and oth-       doubled from 1,380 in FY 2006 to 3,328 in FY 2010
er agencies’ actions in 2018 and beyond to prevent       and the number of women accessing VA specialized
this disturbing finding from becoming a trend. Unlike    homeless programs or with a homeless identifica-
homeless veterans in other parts of the U.S. where       tion tripled from 11,016 in FY 2010 to 36,443 in FY
38% are unsheltered, a shocking 67% of California        2015. These numbers however include women who
veterans - as well as their non-veteran counterparts     were “at risk of homelessness” as well as experienc-
– were unsheltered in 2017’s PIT count. (AHAR)           ing homelessness; nevertheless, the increased risk is
Unsheltered status confers very serious health and       clear. By some estimates, the rate of female veter-
mental health morbidity on those in this situation       an homelessness is at least three times greater than
with universal increases in premature deaths among       their non-veteran civilian peers. (National Coalition
this population. (Morrison) Recommendation #1 in         for Homeless Veterans; VA National Center on Home-
Section VI of this report therefore makes addressing     lessness; Gamache) As a result, Recommendation
veteran housing challenges front and center among        #1 in Section VI explicitly notes the need to address
the actions that must be taken in the coming year.       women veterans’ risk for homelessness.

    8     CAVSA
While Table 1 provides no comfort about California veterans’ suicide rate, it shows that
the predicament of veterans in California is virtually identical to that of their veteran coun-
terparts in other parts of the U.S.: namely, unacceptably high at roughly two times greater
than the general population’s rate, taking the range of rates into consideration. As Sec-
tion IV describes, the general U.S. population suicide rate has steadily risen over the past
decades, with veteran suicide consistently surpassing non-veteran rates. The more than
two-fold discrepancy between non-veteran and veteran suicide rates in California indi-
cates that veteran-targeted suicide prevention efforts are urgently needed in California
and are among the advocacy and education work with which CAVSA will engage in the
coming year per Recommendation #2.
Though not specified here, USDVA data shows that women veterans are at increased risk
for suicide compared to their non-veteran peers and their rates of suicide have steadily
increased over the past decade, though still remain less than half that of male veterans.
CAVSA agencies will therefore expand programs and outreach specifically designed to
serve women veterans and homeless veteran families with dependent children who tend
to be female-headed households as described in Recommendation #2 in Section VI.
Table 1 is unfortunately unclear about the status of California veterans with regard to
deaths due to Opioid Overdose; no veteran-specific data is available on this measure at
this time. Several academic articles suggest that California veterans have been at increased
risk of opioid overdose deaths in the recent past due to VHA prescribing practices. (Seal;
NIH) National data on veteran Opioid Overdose Deaths is also lacking with the only vet-
eran-specific data coming from a 2011 study using 2005 data on Veteran Health Adminis-
tration patient data in a cohort study on “accidental poisonings” which revealed shocking
numbers and helped change USDVA prescribing practices throughout the massive VHA
system of care. Since a 2012 NIH report validated the problematic prescribing practices,
the VA has made concerted efforts to not only change opioid prescribing practices, but to
retrieve opioid medications already prescribed. During three events in 2015 and 2016,
113 participating military treatment facilities collected about 29,000 pounds of unwanted,
unused, or expired medications and as of September 2016, veterans had returned approx-
imately 48,000 pounds of unwanted prescriptions, including 20,350 pounds by mail and
28,017 pounds of unwanted/unneeded medications deposited in receptacles at VA facili-
ties (Interagency Task Force).
Essentially, the Opioid Overdose Deaths findings in Table 1 show that California has so far
“dodged the bullet”. Only three states have lower rates of opioid overdose deaths than
California, (Nebraska, Montana and Hawaii) with a couple states having roughly ten-times
California’s rate (West Virginia and New Hampshire). As discussed further in Section IV,
15% of California counties have opioid overdose death rates that are roughly two times or
greater than California’s overall average rate of roughly 4.5 per 100,000. These primarily
rural counties have a disproportionate percentage of veterans in their overall population
and are CAVSA’s key audiences for targeted messages about the dangers and ineffective-
ness of opioid use to treat chronic pain, per the USDVA/DoD new opioid prescribing clin-
ical practice guidelines (VA/DoD). CAVSA recognizes that now is the time to ensure that
California veterans are managing their medications in healthy ways and do not fall prey
to illicit opioid markets that have devastated their counterparts in other parts of the U.S.
CAVSA State of the Veteran Community Report 9Like the “opioid overdose deaths” measure, there is Our challenge as advocates is to encourage our veter-
no California-specific data nor valid estimate of how an population, that has been well-trained to think of
many veterans are currently incarcerated in Califor- itself as invulnerable, to recognize that reaching out
nia’s jails and prisons. Neither is there an estimate of for help is a sign of strength and self-respect. Then all
the number of veterans who may be in the “churn” Californians must be certain that we are there for our
of arrestees who are in and out of local jails without veterans and their families - as friends, service provid-
subsequent justice system involvement. Extrapolating ers, peer navigators, family and neighbors to honor and
from the national veteran data suggests that rough- support those who have been willing to put their lives
ly 11,000 veterans are under California’s correctional on the line in military service on behalf of our nation.
facilities’ jurisdiction. Per California’s diversion stat-
utes described further in Section IV, some of these Statement of Task
veterans may be retrospectively eligible for remedies As a component of CAVSA’s response to the MHSOAC’s
to their sentencing, but the numbers are currently Request for Proposal 16MHSOAC034, CAVSA agreed to
unknown. Because of the immediate impact that ac- develop a Year 1 report on the “State of the Veteran
tion on this topic could have for California’s incarcer- Community in California” with regard to mental health
ated veterans, CAVSA will explore this matter further services for Veterans and their families. As mentioned
with the Judicial Council of California and the Califor- above, the purpose of this report is to establish a base-
nia Department of Corrections and Rehabilitation. line upon which CAVSA’s further advocacy, education,
outreach, service and research efforts can be built.
Although the report is not directed toward a veter-
an audience, the 2017 report “Pain in the Nation” Due to constraints of time, resources, and improved
produced by Trust for America’s Health and the Well data, this report does not represent “the final word”
Being Trust (TFAH/WBT), calls for a “National Resil- on veteran mental health issues in California today.
ience Strategy” to address the epidemics of suicide, Rather, it is intended to provide insights into areas for
co-occurring mental health disorders often manifest further research, need for improved collaborative ef-
among homeless populations, and alcohol and sub- forts, availability and quality of mental health services
stance use disorders (SUDs), including the epidemic and outcomes data, and highlights of top concerns
of opioid overdose deaths. The veteran population is identified in the literature, through interviews with key
unfortunately often mentioned because of the clus- leaders in service delivery, and findings from a state-
ter of risk factors that includes mental health issues, wide survey, and county case studies undertaken spe-
chronic pain, depression, substance use disorders, cifically for this report.
and aging that are also concentrated in California’s
vulnerable veteran populations. (TFAH/WBT) Recognizing that veterans are often involved in Cal-
ifornia’s Justice system, both in criminal court and
CAVSA is committed to engaging with private founda- family court settings -- often secondary to post-trau-
tions, non-profits, and other advocacy groups like the matic stress disorder (PTSD), trauma, and traumatic
National Coalition of Homeless Veterans, Trust for brain injury (TBI) – special attention is given to Veteran
America’s Health, the Well Being Trust, the Steinberg Treatment Courts (VTCs) as a remedy with appropriate
Institute, Mental Health America, and mental health veteran-specific interventions in diversion programs
service providers, county mental health offices and that are designed to address targeted veteran mental
state agencies to serve as an active advocacy voice health needs.
to improve care for California veterans and their fam-
ilies. Expanding provision of military culturally-com- Similarly, programs and interventions that address vet-
petent care, including prevention and early interven- eran suicide and related veteran family mental health
tion, sensitive approaches to stigma reduction, and issues are highlighted in this report, as well as a special
appreciation of strength and resiliency-based and focus on aging and elderly veteran populations who
recovery-focused resiliency-based and recovery-fo- experience higher rates of suicide than their non-vet-
cused treatment will help ensure that California’s vet- eran peers in specific age groups. (See Section IV for
erans’ mental health challenges are better addressed. further information).
10 CAVSASECTION II. Methodology – Approach to Task
Review of relevant veteran-related mental health based groups across California helped distribute the
reports, public data, and literature, including Cali- survey statewide. Organizations that specifically
fornia-specific, as well as national studies and data serve Veterans and military-connected families, as
that permit extrapolation to California, form a core well as general mental health and community-based
component of this report. Existing data on veter- social service and advocacy organizations that may
an mental health issues and services has primarily serve Veterans as part of their general practice were
been generated by the U.S. Department of Veteran the target audience. Agencies and providers without
Affairs (VA) with either a Veterans Health Adminis- specific Veteran connections were included because
tration (VHA) or Veterans Benefits Administration many Veterans and most Veteran family members
(VBA) point of view, or by academic and think tank re- seek care at community-based agencies where Vet-
searchers, like those at the Rand Corporation. While eran/military cultural competence and knowledge
this information is very valuable, leading to import- would be helpful, but may or may not be forthcom-
ant findings and the generation of evidence-based ing. A better understanding of non-Veteran specific
practices, CAVSA has sought through this report to providers is therefore important.
also gather input, develop case studies, and hear
concerns from community-based providers across The survey was released on May 11, 2018 via email
both Veteran and Non-Veteran service sectors to get using an online link to the survey in Google Forms
a better sense of how, and if, Veteran and Veteran and was closed on July 22, 2018 when a cleaned sam-
Family Mental Health Services are perceived across ple size of 201 was reached with representation from
California’s highly diverse communities. 75% of California’s 58 counties. A modified snowball
sampling method was used, a purposive exponential
Community Based Anonymous Survey non-discriminative sampling method in which a cov-
Because shared data platforms and agreed-upon vari- er letter was sent via email to recipients who were
ables for common data collection regarding mental encouraged to both take the survey and forward it
health services are not yet established, current data to other colleagues and other agencies whose in-
on this topic is scarce among community-based vet- put they believed would be helpful. This sampling
eran service providers and between counties. To help method was selected primarily because it requires
remedy this challenge CAVSA facilitated the develop- minimal resources and there were time constraints
ment of an online survey to gather anonymous infor- for pre-survey planning and post-response analyses.
mation about characteristics of survey respondents, This method has the disadvantage of not permitting
providers of mental health services to Veterans and us to know the potential sample denominator (how
their families across the state, and information about many people actually received the survey but didn’t
survey respondents’ concerns, knowledge, and im- respond), therefore a response rate cannot be calcu-
pressions of the availability and quality of services for lated. It also has the disadvantage of likely introduc-
California Veterans and their families in the areas in ing bias into the sample, such as either caring about
which they work. the topic, or alternately being forced to take the sur-
vey by one’s supervisor, etc.
More than two dozen individuals and organizations,
including CAVSA member agencies, Cal-Vets, Califor- Despite these disadvantages, it is preferred over a
nia Association of Veteran Service Officers (CAVSO), convenience sample with regard to biased sampling,
the California Judicial Council’s Center for Judicial i.e.: only talking to VA employees or Veteran Service
Education and Research (CJER), the STAR Behavioral agencies, etc. as it generates a broader and more
Health program at UCLA, the California Association varied set of respondents who are unknown to the
of Collaborative Courts, and an array of community- investigator. (See Appendix A. for the online survey.)
CAVSA State of the Veteran Community Report 11County Case Studies: Review of Mental states that “counties shall adopt the following stan-
Health Services Act (MHSA) 3-Year Plans dards in planning, implementing, and evaluating
programs:
and Annual Update
To help assess the degree to which individual Coun- • Cultural Competence, as defined in CCR § 3200.100
ty MHSA Local Plans comply with MHSOAC’s re- • Client-Driven, as defined in CCR § 3200.50
quirements that veterans be included at all stages of • Family-Driven, as defined in CCR § 3200.120
MHSA-funded services development and programs • Wellness, recovery, and resilience-focused, as de-
implementation, CAVSA selected five County MHSA scribed in WIC § 5813.5
Local 3-Year Plans and Annual Updates or Amend- • Integrated service experiences for clients and their
ments for review. The counties of Orange, Riverside, families, as defined in CCR § 3200.190.”
Kern, Monterey and Shasta were selected for their
diverse geographic locations and size of service deliv- The Annual Update Instructions also describe the
ery catchment areas. (See Map 5) About one-quarter need to report on “Other” programs and describe
million veterans reside in the large counties of Or- what they could include, for example “stand-alone
ange and Riverside combined. Kern County is medi- programs focused on Outreach for Increasing Rec-
um sized and more rural, central valley county with ognition of Early Signs of Mental Illness, Access to
about 46,000 veterans. Monterey is a relatively ru- Treatment, Improving Timely Access to Services for
ral coastal county with about 18,400 veterans and Underserved Populations, Stigma and Discrimina-
shares a County Veteran Service Officer (CVSO) and tion Reduction, and Suicide Prevention.” Because
many services with adjacent rural San Benito Coun- all of these kinds of programs have considerable
ty which is home to about 2,500 veterans. Shasta is applicability for Veterans and their families who
a rural northern County with about 16,000 veterans tend to perceive stigma related to mental health
comprising about 9% of the county’s total popula- care-seeking behavior at higher rates than the gen-
tion. eral non-Veteran population, and who are at in-
creased risk for suicide, notice was taken if Veter-
The most current Three-Year MHSA plans for these ans and their families were mentioned with regard
five counties were reviewed using the criteria de- to this programming. Additionally, an objective Plan
scribed in WIC § 5848 which specifies that Veter- Review scoring sheet was developed to operation-
ans and representatives from Veteran Organizations alize the MHSOAC Instructions and standardize the
should be involved in the Stakeholder process, in- Plan Review process to increase the replicability of
cluding “meaningful” stakeholder involvement on an Plan Review findings.
array of topics including: “mental health policy, pro-
gram planning, implementation, monitoring, quality “Secret Shopper” Mental Health Service
improvement, evaluation, and budget allocations.” Accessibility Calls
Furthermore, “CCR § 3300 states that involvement
of clients and their family members be in all aspects In the “secret shopper” component of CAVSA’s
of the community planning process and that training County case studies, the mystery consumer’s (“se-
shall be offered, as needed, to stakeholders, clients, cret shopper”) genuine identity and purpose were
and client’s family who are participating in the pro- not known by the agency that was being contacted
cess.” Plans were reviewed using this guidance to as- and assessed for ease of access to care from a caller
sess Veteran and Veteran Family engagement. posing as an unconnected Veteran in need of men-
tal health services. This project component is ex-
In addition, our reviews of these five counties’ MHSA plained in a stand-alone CAVSA report, but is refer-
Plans Annual Updates were guided by the MHSA An- enced here as it informs and is informed by both the
nual Update Instructions which cite CCR § 3320 and Survey findings and the MHSA 3-Year Plan Reviews.
12 CAVSASECTION III. California Veteran Community Overview
Changing California Veteran Demographics 290,000 in Los Angeles County, 225,000 in San Diego
County, 133,000 in Riverside County, 117,000 in Or-
California is home to more U.S. military veterans ange County and 111,000 in San Bernardino County
than other state. Although the estimated number – comprising nearly half of California’s veteran pop-
of veterans living in California varies by as much as ulation. However, despite the fact that more than
89,000 because of different methods of calculation, a quarter million veterans live in Los Angeles Coun-
the general consensus is that about 1.8 million vet- ty, veterans nonetheless constitute less than 3% of
erans are living in California in 2018 - roughly 8.7% Los Angeles’s total County population, compared,
of all U.S. veterans. Map 1 on the following page for example, to Trinity County’s total population
provides a snapshot of counties’ veteran population of about 13,000, where nearly 12% are veterans.
sizes as well as some general information about the These kinds of veteran population variations across
age, gender, era of service, and ethnicity of California the State have significant implications and must be
veterans. Up-to-date data on the ethnicity of Califor- taken into account as service needs are assessed,
nia’s veterans is not readily available, so although this services deployed, and as constituent influence and
VetPop2014 U.S. Department of Veteran Affairs esti- advocacy is leveraged among veteran stakeholder
mate was done September 30, 2016, it seems to be groups statewide.
the best estimate and profile of California available.
(USDVA) The California Employment Development Increase in Older Veterans
Department’s (EDD), most current data on veteran
As Map 1 and Figure 1 further elaborates, California
ethnicity was published in January 2011 using 2010
currently has an older veteran population. Nation-
American Community Survey data 2010 data that
ally, veterans age 55 and older constitute 67% of the
captured 2009 information. Likewise, CalVet’s pub-
veteran population in the U.S. with 23% of those
lished data on California veteran ethnicity are USDVA
over the age of 75 years. California’s current situ-
VetPop2011 projected estimates.
ation of being home to just over 1 million veterans
Given the dynamic nature of the military and veter- over the age of 60 is actually on the decline as the
an population with an estimated 200,000 separating roughly 208,000 Veterans from WWII and Korean
from service and additional thousands retiring each Conflict eras pass on.
year, the absence of information that is less than a
However, as life expectancy increases and coming
decade old is problematic. Also, problematic- espe-
decade demographics show, California must attend
cially for California - is the absence of reliable infor-
to the majority (69%) of California veterans who are
mation about the race and ethnicity of our veteran
55 and older; 25% of whom are over the age of 75.
communities since the very diverse ethno-cultural
Mental health care, physical care, and appropriate
heritage and backgrounds of our service members
housing situations, along with caregiver and family
have an enormous impact on their transitions back
supports for California’s elderly veterans is a critical
into civilian life. Without improved data on our vet-
need as California half a million Vietnam-era vet-
eran communities, social support networks, and
erans join the ranks of the 65+ population. Identi-
families, planning for culturally appropriate services
fication and management of depression, attention
is difficult. The upcoming 2020 Federal Census and
to transition from workforce participation to re-
attendant American Community Service which cap-
tirement and attendant need for meaningful com-
tures data on veterans and their families is therefore
munity engagement, avoidance of polypharmacy,
a critical opportunity for veteran advocates to help
non-opioid and successful pain management, and
ensure optimal quality data by engaging military and
independent and healthy lifestyle promotion are all
veteran participation. (USDVA)
elements of healthy aging.
As Map 1 indicates, Southern California has the
largest number of veterans living there, with about
CAVSA State of the Veteran Community Report 13MAP 1. California Veterans Overview 14 CAVSA
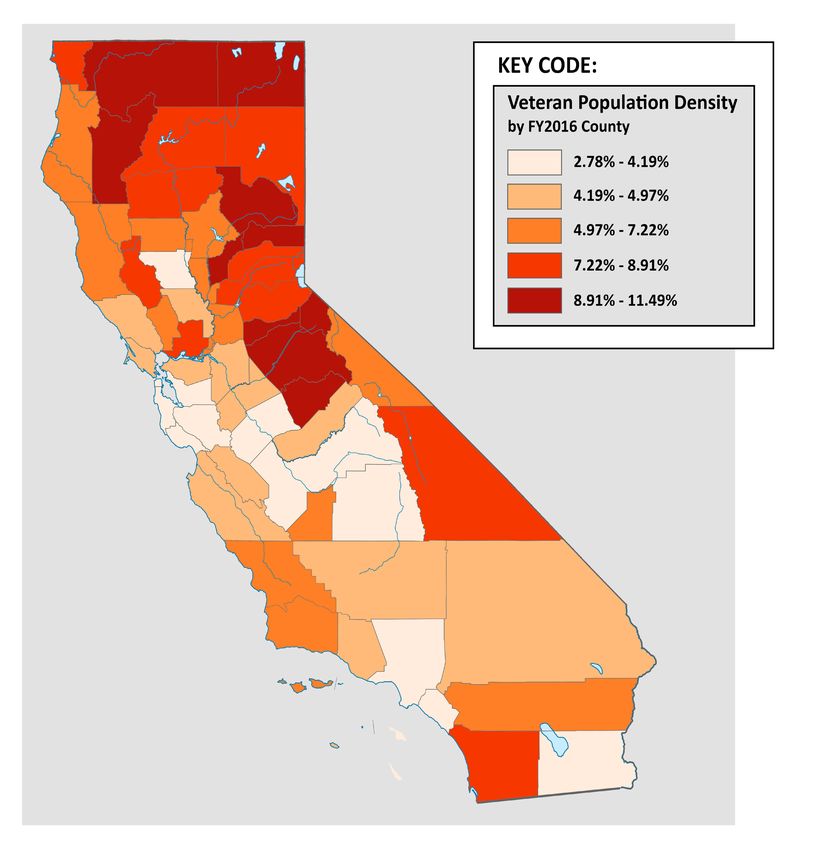
MAP 2. Veterans as Percentage of California County Population – FY 2016

National Center for Veterans Analysis and Statistics. www.va.gov/vetdata

                                                                     CAVSA State of the Veteran Community Report   15
SECTION III. California Veteran Community Overview, cont.
Figure 1. California Veteran Age Distribution 2015-2045
Source: National Center for Veterans Analysis and Statistics, www.va.gov/vetdata.
Women Veterans published 143,211 as the number of women Veter-
ans in California in November 2017. (Office of Enter-
Although it is clear that women Veterans are still
prise Integration, National Center for Veterans Anal-
a minority of California Veterans, data on exactly
ysis and Statistics2)
how many women veterans reside in California is
unclear. The quality of California Veteran data is a While the discrepancy in numbers is likely due to
serious concern and hindrance in considering issues different estimation methods that may each have
related to the State of the California Veteran com- equal merit, the difference of 41,046 women Vet-
munity and the needs of emerging subpopulations. erans is significant for California. Furthermore, it
This is true at both the State and Federal levels and casts doubt on important discussions that must be
may be especially true for issues related to women had about budget allocations, program planning,
Veterans. In fact, Goal 1 of the never-released final and the true magnitude and significance of women
report of the USDVA Report of the Women Veter- veterans’ unique concerns when consensus about
ans Task Force “Strategies for Serving Our Women numbers is difficult to achieve. 2011 data from
Veterans. Draft for Public Comment. May 1, 2012” the California Research Bureau’s “California Wom-
was to “Collect High Quality gender-specific data to en Veterans: The Challenges and Needs of Those
meet stakeholder needs” with Goal 2 being to “Use Who Serve” stated that 7% of California’s National
data to evaluate services to address women Veteran Guard are women, with 54% having a 4-year college
needs. (USDVA) degree. It also described women Veterans as the
fastest growing segment of the Veteran population,
Like the question of veteran ethnicity, agreed-upon
with 46% self-reporting a mental health condition,
current numbers are not available. CalVet’s most
20% reporting “military sexual trauma” (MST), 56%
current online published data states that California
reported experiencing sexual harassment, and 33%
has 184,257 women veterans based on 2011 USDVA
reported experiencing sexual assault. If the num-
“Veteran Population.” Subsequent USDVA numbers,
bers to which these percentages apply vary by tens
like that on Map 1 above by the USDVA VetPop2014,
of thousands, the services needed needs are difficult
as of September 30, 2016 state that California was
to plan for.
home to 163,000 women Veterans. Another VA site
16 CAVSAFigure 2. Percentage of Married Women by Age and Veteran Status
Figure 3. Percentage of Divorced Women by Age and Veteran Status
CAVSA State of the Veteran Community Report 17It is worth noting however that the USDVA has di- branches of service to about twice that of their ci-
rected some attention to the women Veteran pop- vilian counterparts. Women veterans tend to have
ulation with positive results. (Office of Enterprise higher divorce rates than their male counterparts
Integration). One of the variables evaluated in FY15 and, as mentioned above often have primary custo-
was “Veteran Household Child Status,” which data dy of minor children with the attendant challenges,
had never before been collected and has special financial and other burdens that divorce and pos-
importance for women veterans who are dispropor- sibly single parenthood and/or child support issues
tionately single heads of household with dependent entails. (See Figure 3 for percentage of women vet-
children, compared to both male veteran counter- eran divorced status across the lifespan). At all ages,
parts and female civilian counterparts (male vet- veteran women are more likely to be divorced.
erans appear to also be single heads of household
with dependent children disproportionate to their Although data quality issues also exist regarding
civilian counterparts). This analysis found that Cali- women veteran homelessness, women veterans
fornia is second only to Texas with 511,729 veteran are experiencing increased rates compared to their
households with children and, as expected, since male veteran counterparts and their non-veteran
California has more veterans than any other state, civilian female counterparts. According to AHAR
also has more veteran households without children. 2017, out of a population of more than two million
Although the status of the veteran households with women veterans, about 9% of homeless veterans
children is unknown (i.e.: married, single, divorced, were women. From 2016 to 2017, the number of
male-head or female head of household) the finding homeless women veterans increased by 7%, com-
that 30% of California veteran households have de- pared to 1% for their male counterparts. Available
pendent children has important policy and program information also suggests that African American
implications for services, housing, child care, VHA women veterans and those age 18-24 have a great-
clinic hours and waiting room set up, as well as oth- er risk of becoming homeless. Trauma exposure
er services needed for veteran families. Advocacy prior to enlistment coupled with trauma experi-
efforts to respond to this finding are part of CAVSA’s enced while in the military from military sexual
agenda for the coming years. (See Recommenda- trauma (MST) is a common theme among homeless
tion Section VI) women veterans. (Hamilton, et.al, Gamache,et.al,
NCVH, Washington, et. al.)
With about 16% of the U.S. military comprised of
women, there has been an increase in dual mili- Another disturbing demographic trend reported
tary families which numbered about 84,000 in 2014 among women veterans is their heightened rate of
with family formation and childbearing occurring at suicide compared to both their male Veteran and
younger ages than among the civilian population. female civilian counterparts. This will be discussed
(Clever & Segal). However, as Figure 2 shows, from further in Section IV.
45 years on, veteran women are less likely to be Homeless Veterans
married than their civilian counterparts. Because
the state of being married has protective health, as Based on the U.S. Department of Housing and Ur-
well as financial benefits in a public health context, ban Development (HUD) Annual Homeless Assess-
this lower marriage rate for women veterans can be ment Report (AHAR) 2017 California has the largest
considered a risk factor. estimated Point in Time (PIT) number (134,278) of
homeless people in the U.S., constituting 25% of
While divorce rates of service members while they all homeless persons nationwide. California also
are enlisted have historically been roughly the same has the third highest rate of homelessness (34 per
as civilian populations at about 3.6% annually, the 10,000), as well as the highest rate of unsheltered
Department of Defense showed that about 7% of homeless. Overall California’s rate of homeless in-
women service members divorce while in service, creased by 13.7% between 2016 and 2017, an in-
almost twice the comparable figure of the married crease of 16,136 persons.
civilian population who divorce. Upon discharge
from military service, divorce rates increase for all
18 CAVSAMap 3. Point in Time (Jan 2017) Estimates of Homeless Veterans (N=40,056) Source: AHAR Report
As with California’s general population of homeless persons, veterans in California also faced
rising numbers and rates of homelessness. 28.6% (11,472) of all homeless veterans nation-
wide resided in California at this PIT estimate, of which 7,657, two-thirds of all homeless
California Veterans, were unsheltered. See Map 3 above. Homeless veterans constitute 8.5%
of California’s total homeless population, almost identical to the national picture where just
over 9% of all homeless adults are veterans. This data represents a 19.4% (1,860 veterans)
increase from 2016 to 2017 in California’s homeless veteran population, with veterans repre-
senting 11.5% of California’s overall 2017 increase of 16,136 persons mentioned above.
As in past years, the biggest concentration of unsheltered homeless veterans is in California’s
most urban areas with 64.7% (7,418) homeless and mostly unsheltered veterans residing in
just five Continuum of Care (CoC) regions: LA City and County, San Diego City and County, San
Francisco, San Jose/Santa Clara City and County, and Oakland/Alameda County. (AHAR)
In the context of the steady national decline in the number of homeless and unsheltered vet-
erans from 2009 to 2017 depicted in Figure 4, the magnitude of California’s one-year increase
in both homeless and unsheltered Veterans is of concern and reason to focus efforts on our
unsheltered Veterans whose welfare and mental health tend to quickly deteriorate as their
periods of homelessness become chronic. This will be further addressed in Section IV.
Figure 4. Point in Time Estimates of Homeless Veterans Nationally By Sheltered Status, 2009-2017.
Source: AHAR Report, 2017
CAVSA State of the Veteran Community Report 19SECTION IV. Leading Concerns in Veteran Mental Health and Welfare in California
Veteran Suicide Notwithstanding this limitation, when compared to
non-veterans, military veterans are at an increased
According to the Center for Disease Control (CDC) risk of suicidal ideation, and thus, increased risk of
suicide was the 7th leading cause of death for males suicide. Risk is increased if the veteran has experi-
in the general U.S. population in 2015, the most re- enced trauma or a traumatic event at any point in
cent year for which verified data is available. (NCHS, their life, if they, a loved one, or friend has attempt-
National Vital Statistics System, Mortality). For both ed suicide, if they use drugs or alcohol, if they have
men and women overall, suicide ranked as the 10th access to firearms, and if they have negative psy-
leading cause of death nationally. The suicide rate chiatric symptoms, such as PTSD or a mood or be-
has increased among the general U.S. population by havioral disorder (Bryan et al). Being underweight,
an average of 25% from 1999 to 2016 and has com- having disrupted sleep, or 65+ years, also is associ-
mensurately increased among the Veteran popula- ated with increased risk of suicidal ideation (Kaplan
tion. The 2014 suicide rate was 21% higher among et al).
Veterans when compared with U.S. civilian adults,
including 18% higher among male Veterans and 2.4 Moral injury is now also thought to elevate risk of
times higher among female Veterans. (USDVA. Of- suicide among U.S. veterans. “Morally injurious
fice of Mental Health and Suicide Prevention). events can include situations in which an individual
is required to perpetuate or cause harm to others
In 2018 CDC found a 10% higher risk of suicide (e.g., aggression, disproportionate violence, killing),
among people who had served in the military, in- are unable to prevent a negative outcome (e.g.,
cluding both those still serving as well as veterans. saving a friend’s life), or witness events that violate
(CDC) Although veterans comprise only about 8.5% their moral beliefs (i.e., severely injured children)”
of the U.S. adult population, veteran suicides are (Bryan et al). Veterans may engage in suicidal ide-
overrepresented in suicide statistics at about 18% ation that is persistent, intermittent, then fleeting
of all U.S. adult suicides. Across the U.S. approx- and resurging over time, while others may engage
imately 20 veterans die by suicide per day; some in active suicidal ideation. Because a number of
sources suggest that this rate may be too low, and these increased risk factors are more likely to be
that the actual suicide rate is much higher. (Bryan prevalent among veterans than non-veteran pop-
et al). As 2015 California veteran suicide data be- ulations, it is critical that mental health and other
low shows, 516 veteran deaths were determined to social service providers have cultural competence
be suicides or 1.4 veteran suicide deaths per day in in military culture in order to successfully support
California alone. at-risk veterans.
Researchers have identified over 75 biopsychoso- An additional risk factor that is more widespread
cial risk factors for suicide and suicidal ideation in among veterans is having a traumatic brain injury
military Veterans (Barnes et al). Leading risk factors (TBI) of varying severity. As the “signature injury”
for veteran suicide include: being male, elderly (65+ of the recent Gulf Wars due to improvised explosive
years), having a diminished social support network, devices (IEDs) (Brenner et al), TBI is defined as a se-
medical and psychiatric conditions associated with rious concussive or percussive impact on the head
suicide (behavior and mood disorders), and the which results in measurable physical and mental
availability and knowledge of firearms. An acknowl- health effects (Barnes et al). Depending on the type
edged limitation of this list is the fact that much of TBI (mild, moderate, severe) suicide rates among
of the veteran suicide research has been based on individuals with a history of TBI are estimated to be
Vietnam-era veterans, so may be less relevant for between 2.7 and 4.0 times higher as compared to
our current Gulf War-era veterans (Kaplan et al). the general population. (Brenner et al).
20 CAVSAThis results in an 8.1% lifetime rate of suicide attempts post-TBI compared with 1.9% for the
general population. Clinically significant suicidal ideation has been identified in 21% to 23%
of individuals with a history of TBI compared to 1% of the total sample of those who served
in [the Iraq Gulf War] that endorsed some suicidal ideation. (Brenner et al) These findings
strongly suggest that better assessment for TBI, which is often misdiagnosed as PTSD and
other behavioral problems, is warranted and preventive resiliency building strategies em-
ployed with this population universally.
Recent media reports have highlighted the rising rates of suicide among women overall
(both veteran and non-veteran) because the percent increase in rates was higher in women
for the first time ever, but it’s worth noting that men continue to have a three to five times
higher rate of death by suicide than women.
Findings for California veterans are cited in the following Table 2, Table 3, Figure 5 and
Figure 8 from the VA National Suicide Data Report 2005–2015, Office of Mental Health
and Suicide Prevention, U.S. Department of Veteran Affairs, June 2018.
Table 2. California Veteran, Total California, Western Region & National Suicide Deaths by Age Group, 2015
Taking population age differences into account, California’s overall Veteran suicide rate
(28.8) is significantly higher than the national general population (non-Veteran) suicide rate
of 17.3 and more than twice that of California’s general (non-Veteran) suicide rate of 13.6.
Table 3. California, Western Region and National Veteran Suicide Deaths by Age Group, 2015
Although still too high, California’s Veteran suicide rate among all age groups is lower than
both neighboring states in the VA Western Region, as well as lower than the National vet-
eran suicide rate through all age groups. Veterans age 75+ constitute the only age group in
which California Veterans’ suicide rate is higher than the National rate and is comparable to
neighboring Western Region.
CAVSA State of the Veteran Community Report 21You can also read