KNOWLEDGE IS POWER KNOW YOUR STATUS, KNOW YOUR VIRAL LOAD - UNAIDS

Page created by Monica Sanders
 
CONTINUE READING
KNOWLEDGE IS POWER KNOW YOUR STATUS, KNOW YOUR VIRAL LOAD - UNAIDS
UNAIDS | 2018

KNOWLEDGE
IS POWER
KN O W Y OUR S TATUS,
KN O W Y O UR VIR AL LOAD
KNOWLEDGE IS POWER KNOW YOUR STATUS, KNOW YOUR VIRAL LOAD - UNAIDS
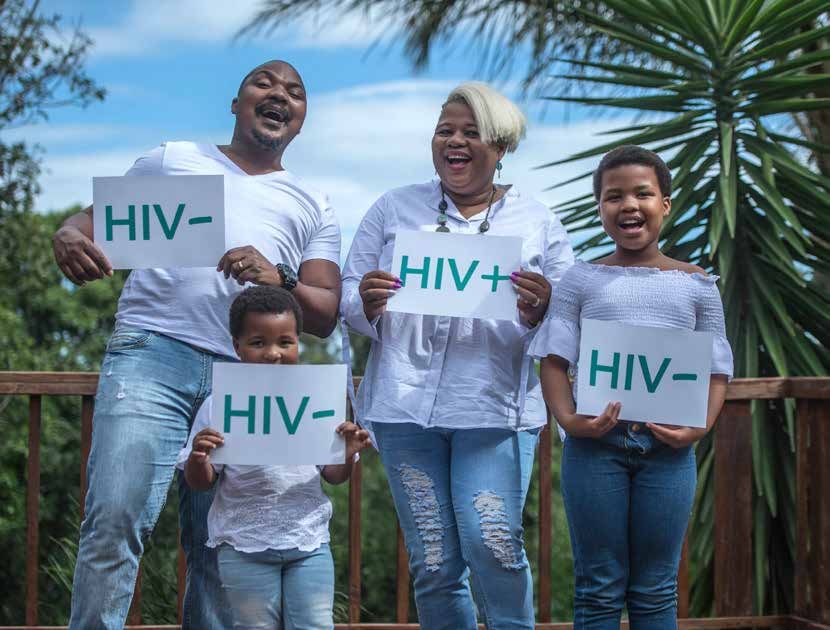
Mandisa Dukashe and her family live in Eastern Cape, South Africa. Mandisa is a trained
nurse and works in the response to HIV to ensure quality control in health-care settings.
She is living with HIV and encourages people to get tested for HIV. Her husband and two
daughters are all HIV-negative.
KNOWLEDGE IS POWER KNOW YOUR STATUS, KNOW YOUR VIRAL LOAD - UNAIDS
KNOWLEDGE
IS POWER
KNOW YOUR S TAT U S,
K NOW YOUR VIRA L LOA D
KNOWLEDGE IS POWER KNOW YOUR STATUS, KNOW YOUR VIRAL LOAD - UNAIDS
CONTENTS

           Foreword                                                      3

           Introduction and summary                                     5

           Part I. Gaps and barriers                                    18
             Gaps across the HIV testing and treatment cascade          20
             Barriers faced by infants living with HIV                  26
             When services are available but unacceptable               30
             When services are available but inaccessible               41

           Part II. Overcoming barriers                                 46
             Rapid diagnosis at the point of care                       48
             More efficient testing through a diversity of approaches   51
             Active case finding                                        59
             Self-testing                                               61
             Improving viral suppression                                68
             A rights-based approach                                    72

           References                                                   75
KNOWLEDGE IS POWER KNOW YOUR STATUS, KNOW YOUR VIRAL LOAD - UNAIDS
FOREWORD

    Increasingly when I meet people living with HIV, I am hearing about the importance of
    HIV testing being freely available by anyone who wants to know their HIV status. And I
    am hearing how important it is to keep HIV suppressed.

    Having an undetectable viral load—a level of HIV in a person’s blood so low that it
    can’t be detected—is vital. It improves the health of people living with HIV and reduces
    deaths. People with sustained viral load suppression have effectively no risk of sexually
    transmitting the virus to a partner who is HIV-negative.

    I have seen the successes. A full 75% of people living with HIV knew their HIV status in
    2017, up from 66% in 2015—in three short years the number of people living with HIV
    who don’t know their status fell from a third to a quarter. Worldwide, the percentage of
    people living with HIV who are virally suppressed has increased significantly, from 38% in
    2015 to 47% in 2017. But access is mixed. In some parts of the world, getting a viral load
    test is easy—it is fully integrated into a person’s treatment regime—but in other places it
    is close to impossible, with only one viral load machine for the entire country.

    To reach the 90–90–90 targets, including the target of ensuring that 90% of people on
    treatment have a suppressed viral load, we have to redouble our efforts to reach the
    millions who are not aware of their HIV status and to reach the millions who are not
    virally suppressed.

    To reach the millions who do not know their status, we need universal access to HIV
    testing services—HIV testing should be as widely available as pregnancy testing. To
    reach the millions who are not virally suppressed, we need viral load monitoring to be as
    available in Lilongwe as in London. HIV testing and viral load testing should be universal.

    In the past few years, we have seen incredible innovations become available that are
    helping to revolutionize the AIDS response. HIV self-testing kits allow people to test for
    HIV in privacy, expanding testing rates among hard-to-reach populations. HIV self-testing
    is reaching more and more men, young people and key populations—gay men and other
    men who have sex with men, sex workers, transgender people, people who inject drugs,
    prisoners and other incarcerated people and migrants. And point-of-care viral load
    testing machines are bringing virological testing nearer to the people who need it.

                                                                                                  3
KNOWLEDGE IS POWER KNOW YOUR STATUS, KNOW YOUR VIRAL LOAD - UNAIDS
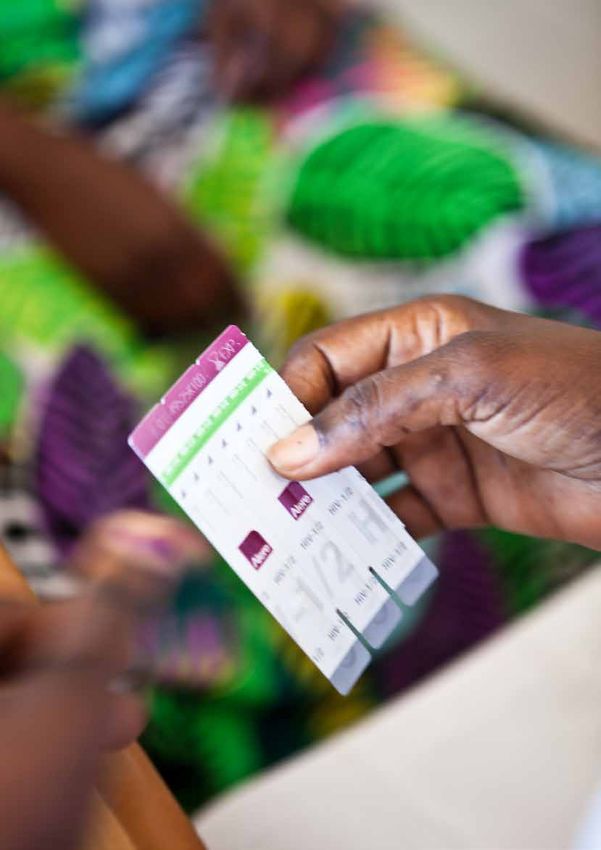
But technology alone will not be enough to ensure that people can access the HIV
    testing services they need. Stigma, discrimination and abuses of human rights are still
    among the biggest barriers to the uptake of all HIV services, including testing. Stigma
    and discrimination must be confronted wherever it is experienced. Human rights,
    including one of the most fundamental, the right to health, need to be upheld if we are
    ever to reach our goal of ending AIDS.

    HIV testing gives people the knowledge they need to make choices—choices on the right
    options for treatment and prevention. Knowledge really is power. The power of people
    to determine the right options to keep healthy. And the power to stay well and live long
    and productive lives. Let’s ensure that everyone has that power.

    Michel Sidibé
    UNAIDS Executive Director

4
KNOWLEDGE IS POWER KNOW YOUR STATUS, KNOW YOUR VIRAL LOAD - UNAIDS
INTRODUCTION AND SUMMARY

The end of knowledge is power . . . lastly, the scope of all speculation is the performing of some
action, or thing to be done.
                                                                                         Thomas Hobbes
                                                                                       De Corpore (1655)

Skill to do comes of doing; knowledge comes by eyes always open, and working hands; and there is
no knowledge that is not power.
                                                                               Ralph Waldo Emerson
                                “Old Age,” an essay within the collection Society and Solitude (1870)

                   Knowledge is power. These words of wisdom have been passed down through the
                   centuries. Initially this “power” likely referred to political power—the power to rule
                   over others—but by the Age of Enlightenment, the power provided by knowledge was
                   considered more personal. Knowledge gave individuals power over their environment
                   and circumstances: the power to control their own destiny.

                   For people who may have been exposed to HIV, knowledge is critical to making
                   informed decisions about their future. An HIV test is a serious event with potentially
                   serious outcomes. But no matter the result, the test provides vital information. A
                   negative result is an opportunity to take deliberate steps to prevent future acquisition
                   through prevention methods tailored to that individual’s risks. A positive test result—and
                   a confirmatory diagnosis—is never welcome news, but for people living with HIV, it is a
                   necessary first step towards a long and healthy life.

                   Initiation of antiretroviral therapy must follow as soon as possible. But treatment by itself is
                   not sufficient. Durable viral suppression is needed to ensure both a normally functioning
                   immune system and that HIV will not be transmitted to others. Viral load testing is required
                   to confirm that antiretroviral therapy is successfully suppressing viral load.

                   The power of knowledge is displayed on the cover of this report. Mandisa Dukashe and
                   her family live in Eastern Cape, South Africa. Mandisa, a nurse who specializes in quality
                   control in health-care settings, is living with HIV. Knowing her HIV status and durably
                   suppressing her viral load through treatment has helped ensure that her husband and
                   two daughters are HIV-negative.

                                                                                                                      5
KNOWLEDGE IS POWER KNOW YOUR STATUS, KNOW YOUR VIRAL LOAD - UNAIDS
Figure 1. More than half of people living with HIV not virally suppressed
    People living with HIV, by viral suppression status, global, 2017

                  NOT VIRALLY SUPPRESSED                                                                          VIRALLY SUPPRESSED
                            52.6%                                                                                        47.4%
                                                                                                                        [35–59%]

     Vulnerable to or suffering from AIDS-related illness and                                   The immune system can function normally and HIV cannot
                  able to transmit HIV to others                                                               be transmitted to others

      = 1% of people living with HIV globally

                             More than half of people living with HIV have unsuppressed viral loads
                             Despite the critical roles that HIV testing and viral load testing play in the lives of people
                             living with HIV, about one in four globally did not know their HIV status in 2017, and
                             viral load testing coverage remained low in many parts of the world. Gaps across the
                             HIV testing and treatment cascade leave more than half of all people living with HIV
                             globally with unsuppressed viral loads (Figure 1), increasing the danger of HIV drug
                             resistance and threatening efforts to meet the impact targets within the 2030 Agenda on
                             Sustainable Development.

                             The latest available data from countries show that progress towards the 90–90–90 testing
                             and treatment targets has been strongest in eastern and southern Africa, Latin America
                             and high-income countries. Among countries where data were available, 24 countries
                             had achieved or were on track to achieve the first 90, and 26 countries had fully achieved
                             or were on track to fully achieve the second 90 (Table 1).1 However, progress towards the
                             end goal—viral suppression—is lower. At the end of 2017, just 12 reporting countries
                             had fully achieved or were on track to fully achieve the third 90, which translated to 73%
                             of people living with HIV having durably suppressed viral loads.

                             Progress varies by region. The Asia and the Pacific and the Caribbean regions will
                             need to accelerate their testing and treatment programmes to get on track to reach
                             the 90–90–90 targets by 2020. Knowledge of HIV status is relatively high in eastern
                             Europe and central Asia, but treatment coverage and viral suppression are alarmingly
                             low. Testing, treatment and viral suppression levels in Middle East and North Africa and
                             western and central Africa are considerably off track.

       1
        Achievement of the first 90 is defined as 90% of people living with HIV know their HIV status, and on track is defined as 85–89% at the end
       of 2017. Full achievement of the second 90 is defined as 81% of people living with HIV accessing treatment, and on track is defined as 75–80%
       at the end of 2017. Full achievement of the third 90 is defined as 73% of all people living with HIV have suppressed viral loads, and on track is
       defined as 65–72% at the end of 2017.

6
KNOWLEDGE IS POWER KNOW YOUR STATUS, KNOW YOUR VIRAL LOAD - UNAIDS
Progress within regions, income levels and epidemic settings also vary. In Asia and the
Pacific, for example, Cambodia has nearly achieved the 90–90–90 targets, while progress
has been slower Indonesia, Pakistan and Philippines. In eastern and southern Africa,
low-income Rwanda has fully achieved the second 90, while treatment coverage and viral
suppression are lower in upper-middle-income South Africa, despite achievement of the
first 90. In western and central Africa, performance along the cascade in Burkina Faso,
Burundi and Cabo Verde is much higher than the regional average.

                                                                                          7
KNOWLEDGE IS POWER KNOW YOUR STATUS, KNOW YOUR VIRAL LOAD - UNAIDS
Table 1. High testing and treatment coverage in eastern and southern Africa and high-income countries
    Testing and treatment cascade, all ages, by country, 2017

                                                                                                                                                                               living with HIV who are on
                                                               living with HIV who are on

                                                                                                                                                                               Percentage of all people

                                                                                                                                                                                                            Percentage of all people
                                                               Percentage of all people

                                                                                            Percentage of all people

                                                                                                                                                     among all people living

                                                                                                                                                                                                            living with HIV who are
                                     among all people living

                                                                                            living with HIV who are

                                                                                                                                                     Knowledge of status
                                     Knowledge of status

                                                                                                                                                                                                            virally suppressed
                                                                                            virally suppressed

                                                                                                                                                     with HIV (%)
                                     with HIV (%)

                                                                                                                                                                               treatment
                                                               treatment
                                                                                                                          Madagascar                         8                          7
    ASIA AND THE PACIFIC                    74                         53                          45                     Malawi                            90                         71                          61
       Afghanistan                                                                                                        Mauritius
       Australia                                                       82                                                 Mozambique                        59                         54
       Bangladesh                           35                         19                                                 Namibia                           90                         84                          74
       Bhutan                                                                                                             Rwanda                                                       83
       Brunei Darussalam                                                                                                  South Africa                      90                         61                          47
       Cambodia                             88                         87                          83                     South Sudan                                                  13
       China                                                                                                              Uganda                            81                         72                          56
       Democratic People                                                                                                 United Republic of
                                                                                                                                                                                       66                          48
        Republic of Korea                                                                                                  Tanzania
       Fiji                                                                                                               Zambia                                                       75
       India                                79                         56                                                 Zimbabwe                          85                         84
       Indonesia                            42                         14                                              EASTERN EUROPE
                                                                                                                                                            73                         36                          26
       Japan                                                           82                                              AND CENTRAL ASIA
       Lao People’s Democratic                                                                                           Albania                           66                         42                          14
                                            75                         47                          45                     Armenia                           66                         45                          38
        Republic
       Malaysia                             83                         45                          42                     Azerbaijan                                                   46                          22
       Maldives                                                                                                           Belarus                           79                         46                          30
       Mongolia                             32                         28                                                 Bosnia and Herzegovina
       Myanmar                                                         66                                                 Georgia                           48                         39                          35
       Nepal                                64                         49                          44                     Kazakhstan                        79                         43                          24
       New Zealand                                                     78                                                 Kyrgyzstan                        75                         39                          27
       Pakistan                             15                          8                            8                    Montenegro                        84                         59                          54
       Papua New Guinea                                                55                                                 Republic of Moldova               56                         34                          27
       Philippines                          71                         36                                                 Russian Federation                81                         36                          27
       Republic of Korea                                                                                                  Tajikistan                        51                         33                          22
       Singapore                          91                           77                          72                     The former Yugoslav
                                                                                                                                                            72                         52                          45
       Sri Lanka                          68                           37                          34                     Republic of Macedonia
       Thailand                           >95                          72                          62                     Turkmenistan
       Timor-Leste                                                                                                        Ukraine                           56                         40                          23
       Viet Nam                                                        50                          43                     Uzbekistan                        41                         29
    CARIBBEAN                               73                         57                          40                  LATIN AMERICA                        77                         61                          52
       Bahamas                                                         57                          39                     Argentina                         75                         66
       Barbados                                                        49                                                 Bolivia (Plurinational
                                                                                                                                                            75                         36                          23
                                                                                                                          State of)
       Belize                                                          31
                                                                                                                          Brazil                            84                         64                          59
       Cuba                                 80                         66                          43
                                                                                                                          Chile                             70                         59                          53
       Dominican Republic                   77                         52                          43
                                                                                                                          Colombia                                                     54
       Guyana                                                          64
                                                                                                                          Costa Rica                        66                         54
       Haiti                                                           64
                                                                                                                          Ecuador                           64                         54                          34
       Jamaica                              75                         34                          17
                                                                                                                          El Salvador                       74                         48                          31
       Suriname                             65                         51                          43
                                                                                                                          Guatemala                         67                         39                          28
       Trinidad and Tobago                                             62
                                                                                                                          Honduras                                                     52                          45
    EASTERN AND
                                            81                         66                          52                     Mexico                            64                         62                          46
    SOUTHERN AFRICA
       Angola                                                          26                                                 Nicaragua                                                    48                          21
       Botswana                             86                         84                          81                     Panama                            70                         53                          21
       Comoros                              28                         27                                                 Paraguay                          68                         39                          22
       Eritrea                                                         62                                                 Peru                                                         67
       Eswatini                             90                         85                          74                     Uruguay                           82                         57                          44
       Ethiopia                             73                         71                          32                     Venezuela (Bolivarian
                                                                                                                          Republic of)
       Kenya                                                           75                          63
       Lesotho                              80                         74                          68

    Knowledge of status among                       Percentage of all people living                                    Percentage of all people living
    all people living with HIV (%)                  with HIV who are on treatment                                      with HIV who are virally suppressed

    85% and above                                   75% and above                                                      65% and above
    70–84%                                          55–74%                                                             40–64%
    50–69%                                          30–54%                                                             25–39%
    Less than 50%                                   Less than 30%                                                      Less than 25%
    No data                                         No data                                                            No data

8
living with HIV who are on

                                                                                                                                                                            living with HIV who are on
                                                          Percentage of all people

                                                                                       Percentage of all people

                                                                                                                                                                            Percentage of all people

                                                                                                                                                                                                         Percentage of all people
                                among all people living

                                                                                                                                                  among all people living
                                                                                       living with HIV who are

                                                                                                                                                                                                         living with HIV who are
                                Knowledge of status

                                                                                                                                                  Knowledge of status
                                                                                       virally suppressed

                                                                                                                                                                                                         virally suppressed
                                with HIV (%)

                                                                                                                                                  with HIV (%)
                                                          treatment

                                                                                                                                                                            treatment
MIDDLE EAST AND                                                                                                   WESTERN AND
                                       50                         29                          22
NORTH AFRICA                                                                                                      CENTRAL EUROPE AND                     85                         76                          65
   Algeria                             84                         80                          58                  NORTH AMERICA
   Bahrain                             76                         45                                                 Austria                             88                         84                          62
   Djibouti                                                       27                                                 Belgium
   Egypt                               51                         24                                                 Bulgaria                            87                         43                          25
   Iran (Islamic Republic of)          41                         19                          13                     Canada
   Jordan                                                                                                            Croatia
   Kuwait                              72                         64                          59                     Cyprus                                                         65
   Lebanon                                                        61                                                 Czechia                           >95                          68                          64
   Morocco                             69                         57                          46                     Denmark                            88                          83                          83
   Oman                                                                                                              Estonia                                                        72
   Qatar                               68                         54                          32                     Finland
   Saudi Arabia                                                                                                      France                                                         81
   Somalia                                                        28                                                 Germany                                                        74
   Sudan                                                          15                                                 Greece                            >95                          67
   Syrian Arab Republic                                                                                              Hungary                                                        59                          55
   Tunisia                                                        31                                                 Iceland
   United Arab Emirates                                                                                              Ireland                             87                         73                          69
   Yemen                                                                                                             Israel
WESTERN AND                                                                                                          Italy                               87                         86                          66
                                       48                         40                          29
CENTRAL AFRICA                                                                                                       Latvia
   Benin                                                          55                          42                     Lithuania                           94                         29                          22
   Burkina Faso                        88                         65                          49                     Luxembourg                          86                         78                          70
   Burundi                             80                         77                                                 Malta                                                                                      38
   Cameroon                            71                         49                                                 Netherlands                         87                         80                          76
   Cabo Verde                                                     75                                                 Norway                                                         90
   Central African Republic            53                         32                                                 Poland
   Chad                                                           45                                                 Portugal                            91                         80                          71
   Congo                               32                         29                                                 Romania                             92                         76                          52
   Côte d’Ivoire                       54                         46                          35                     Serbia                              91                         64
   Democratic Republic of                                                                                           Slovakia                            87                         75
                                       59                         55
    the Congo                                                                                                        Slovenia                            73                         58                          58
   Equatorial Guinea                                              38                                                 Spain                                                          82
   Gabon                               77                         59                                                 Sweden
   Gambia                                                         32                                                 Switzerland
   Ghana                                                          40                                                 Turkey
   Guinea                                                         35                                                 United Kingdom
   Guinea-Bissau                                                  30                                                 United States of America
   Liberia                                                        29                                              GLOBAL                                 75                         59                          47
   Mali                                                           32                          13
   Mauritania                          33                         33                          22                  Note: Data are for 2017, except as follows: 2016 - Austria, Czechia,
   Niger                               55                         52                                              Denmark, Germany, Italy, Luxembourg, Netherlands, Portugal, Serbia,
   Nigeria                             38                         33                                              Slovenia; 2015 - Croatia and Hungary. Estimates are for citizens of the
   Senegal                             71                         54                          41                  country only for Kuwait and Saudi Arabia.
   Sierra Leone                        47                         39                          24
                                                                                                                  Source: UNAIDS special analysis, 2018; for more details, please see
   Togo                                66                         57
                                                                                                                  Annex on methods in Miles to go: closing gaps, breaking barriers,
                                                                                                                  righting injustices. Geneva: UNAIDS; 2017 (http://www.unaids.org/
                                                                                                                  sites/default/files/media_asset/miles-to-go_en.pdf).

                                                                                                                                                                                                                                    9
Addressing the large viral suppression gap in western and
     central Africa

     There are huge gaps along the testing and treatment cascade in western and central Africa. At the end of
     2017, less than half (48%) of people living with HIV knew their HIV status in the region, just two in five (40%)
     were accessing antiretroviral therapy, and less than one third (29%) were virally suppressed. Although the
     region is home to just 6% of the global population, it accounted for one third (34%) of the estimated 9.4
     million undiagnosed people living with HIV and nearly one quarter (22%) of the 19.4 million people living
     with HIV who were not virally suppressed in 2017.

     Insufficient domestic funding, weak health systems, user fees for health care, humanitarian situations and
     high levels of stigma and discrimination have undermined efforts to scale up HIV testing and treatment
     in the region. A growing number of countries in the region have signed on to a catch-up plan, a compact
     between countries and the international community to address bottlenecks to scale-up, accelerate national
     responses and reach a trajectory to achieve the 90–90–90 targets by 2020 (1).

     Shared responsibility between national governments and the international community can quickly close
     important gaps, as seen in Côte d’Ivoire, where the United States President’s Emergency Plan for AIDS
     Relief (PEFPAR) is supporting a national scale-up plan for viral load testing. In just three years, as the number
     of people on treatment doubled, 10 additional laboratories began viral load testing, and viral load testing
     coverage increased from 14% in 2015 to 66% in 2017, with coverage projected to reach 75% by the end of
     2018 (Figure 2) (2).

     Figure 2. Scaling up viral load testing in Côte d’Ivoire
     Number of people on treatment and viral load testing coverage, Côte d’Ivoire, 2015–2017

                                      250 000                                                                                                    70
                                                                                                                                      66%
      Number of people on treatment

                                                                                                                                                 60

                                                                                                                                                       Viral load testing voverage (%)
                                      200 000
                                                                                                                                                 50

                                      150 000                                                                                                    40

                                      100 000                                                         28%                                        30

                                                                                                                                                 20
                                       50 000                    23%
                                                                                                                                                 10

                                           0                                                                                                     0
                                                          2015                                 2016                            2017

                                 Currently on treatment     Viral load test result   Per cent coverage of viral load testing

     Source: Adje-Toure C, CDC-Côte d’Ivoire. Challenges and access to viral load testing in Africa: example of Cote d’Ivoire. Presentation. (https://www.
     iasociety.org/Web/WebContent/File/EduFundCoteIvoire_Christiane_Adje-Toure.pdf; accessed 14 November 2018).

10
Common patterns of inequity
   There are common patterns of inequity within countries. Knowledge of HIV status,
   treatment coverage and viral suppression rates are consistently lower among
   children, young people and men. Knowledge of HIV status among key populations
   at higher risk of HIV infection varies widely country by country, and the majority
   of evidence points to weaker treatment adherence and lower viral suppression
   among female sex workers, people who inject drugs, transgender women and men,
   prisoners and gay men and other men who have sex with men. Young women and
   girls face gender-related barriers to services, including gender-based violence and
   denial of sexual and reproductive health rights. Particular barriers also exist for
   migrants, refugees, people living with disabilities and other vulnerable groups.

   For example, children living with HIV face numerous challenges that widen the gaps
   along the HIV testing and treatment cascade. Multiple visits to a health facility are
   required to determine an infant’s HIV status through virological testing. Furthermore,
   many infants are unable to start treatment before the period of peak mortality at
   two or three months of age; without treatment, up to 50% of children born with HIV
   will die before their second birthday (3–5). The development of optimal paediatric
   drug formulations also lags behind adult drug development. These challenges often
   translate to lower rates of viral suppression, as can be seen in data from national
   surveys conducted in 11 countries in sub-Saharan Africa (Figure 3).

 Figure 3. Lower viral suppression among children
 Percentage of people living with HIV with suppressed viral loads, children and adults,
 11 countries, 2015–2017

                              100

                               80
Viral load suppression (%)

                               60

                               40

                               20

                                0
                                       Cameroon*

                                                   Côte d’Ivoire*

                                                                    Eswatini

                                                                                Lesotho

                                                                                          Malawi

                                                                                                      Namibia

                                                                                                                South Africa

                                                                                                                               Uganda

                                                                                                                                        United Republic
                                                                                                                                            of Tanzania*

                                                                                                                                                           Zambia

                                                                                                                                                                    Zimbabwe

                             Children (aged 0–14 years)                   Adults (aged 15–49 years)

Source: Cameroon Population-based HIV Impact Assessment (CAMPHIA), 2017; Côte d’Ivoire Population-based HIV Impact
Assessment (CIPHIA), 2017–2018; The Swaziland HIV Incidence Measurement Survey 2 (SHIMS2), 2016–2017; Lesotho
Population-based HIV Impact Assessment (LePHIA), 2016–2017; Malawi Population-based HIV Impact Assessment (MPHIA),
2015–2016; Namibia Population-based HIV Impact Assessment (NAMPHIA), 2017; South African National HIV Prevalence,
Incidence, Behaviour and Communication Survey, 2017; Uganda Population-based HIV Impact Assessment (UPHIA),
2016–2017; Tanzania HIV Impact Survey (THIS), 2016–2017; Zambia Population-based HIV Impact Assessment (ZAMPHIA),
2015–2016; The Zimbabwe Population-based HIV Impact Assessment (ZIMPHIA), 2015–2016.

* Estimates for children (aged 0–14 years) are based on a small number of unweighted cases (
Disempowerment driven by stigma and discrimination and violence
     HIV-related stigma and discrimination disempowers people living with HIV and people
     at risk of HIV infection. Studies across continents and cultures show that taboos and
     misunderstandings about HIV persist, discouraging people from seeking the knowledge
     and services they need. In Zambia, fear of negative reactions from family members can
     lead to caregivers avoiding testing a child who may have been exposed to HIV (6). In the
     United States of America, anticipated rejection following seroconversion is a significant
     barrier to testing for gay men and other men who have sex with men and transgender
     women (7). For many men at risk of HIV infection in South Africa, HIV testing and linkage
     to care are fraught with fear and trauma stemming from the previous loss of parents and
     loved ones to AIDS-related illnesses before treatment was widely available (8). Women
     living with HIV in Eswatini may drop out of treatment to avoid the dishonour that could
     result from their HIV status being disclosed (9).

     Dozens of countries have passed legislation that explicitly prohibits discrimination on
     the basis of HIV status. However, legal barriers remain on the books in many places,
     including laws that criminalize nondisclosure, exposure or transmission of HIV. Breaches
     of confidentiality in health-care settings still occur with alarming frequency. When news of
     one’s HIV-positive status result may lead to rejection, violence or criminal prosecution, the
     consequences of taking an HIV test or regularly visiting a health facility for medicine refills
     or viral load testing can appear worse than the consequences of avoiding these services.

     Violence is a very real threat for women living with HIV and members of key populations.
     Women living with HIV who experience intimate partner violence are significantly less
     likely to adhere to treatment, and they therefore have worse clinical outcomes and lower
     viral suppression (10, 11). Violence—and the threat of violence—is also linked to legal
     contexts in which members of key populations may be arrested or otherwise targeted
     for drug use, sex work, same-sex sexual acts or changing their gender. Criminalization of
     these behaviours can be a powerful deterrent to seeking HIV testing and treatment.

12
Too far, too expensive, too long, too complicated
                Where services are difficult to access—such as where people must travel long distances
                to a clinic or where clinic hours are not suited to individuals or groups—the uptake of
                these services tends to decrease. Food insecurity, costs associated with HIV and viral
                load testing (including for the tests themselves), other health-care costs, transport
                costs, lost income and opportunity costs contribute to later treatment initiation, lower
                treatment adherence and higher rates of AIDS-related mortality (12–16). Long wait times
                at clinics or having to return for test results increase the percentage of people who seek
                testing but don’t receive a result.

                Delays between an HIV diagnosis and treatment initiation further slow efforts to
                increase treatment coverage. Adherence to treatment can also be a challenge when
                support mechanisms are not in place, especially for young people and men. Insufficient
                integration of tuberculosis and HIV services leaves nearly half of people living with HIV
                and tuberculosis unaware of their coinfection and lacking the treatment they need (17).
                As a result, tuberculosis remains the leading preventable cause of death among people
                living with HIV. Suboptimal retention in HIV treatment and care, drug stock-outs and
                inadequate support for treatment adherence favour the emergence and transmission of
                HIV drug resistance (18).

                Expanding knowledge through active, diversified and rights-based approaches
                Safeguarding the right to health of people at risk of HIV and those living with HIV
                requires the delivery of HIV services that are available, accessible, acceptable, of good
                quality and delivered according to established human rights principles. Within this
                human rights-based approach, innovations in HIV testing and viral load testing are
                contributing to progress towards the 90–90–90 targets.

A human rights-based approach to HIV calls for the following:

   Availability, accessibility, acceptability and good quality of services.

   Nondiscrimination and equality.

   Privacy and confidentiality.

   Respect for personal dignity and autonomy.

   Meaningful participation and accountability (21).

                Point-of-care virological testing technologies are providing faster results for both infant
                diagnosis and viral load monitoring for people on treatment. Point-of-care assays for
                early infant diagnosis are being rolled out in 15 African countries, shortening the time it
                takes to return infant test results to caregivers from weeks to hours. This allows treatment
                to be more consistently initiated before the immune systems of infected infants weaken.
                In Mozambique, 89.7% of infants living with HIV who were diagnosed with point-of-care
                assays initiated antiretroviral therapy within 60 days of sample collection, compared to
                12.8% of children who received standard early infant diagnosis (20).

                                                                                                               13
Community-based testing using rapid test kits can overcome many of the logistical,
     structural and social barriers to HIV testing. It can reach people who live far away from a
     health facility, provide services at times that suit people at high risk of HIV infection, and
     mitigate the stigma and discrimination that can accompany HIV testing and a positive
     diagnosis. The PopART (HPTN 071) cluster-randomized trial achieved the first and
     second 90s within urban communities in South Africa and Zambia in just three years by
     offering a combination of services that included home-based voluntary HIV testing and
     counselling (21).

     HIV testing delivered through peers is increasing the reach, uptake and acceptability
     of testing. Engaging adolescents and key populations living with HIV as outreach
     workers is proving particularly successful for diagnosing and initiating treatment among
     HIV-positive peers. Similarly, testing the sexual partners, children and other household
     and family members of people living with HIV—an approach known as index testing—has
     been shown to be a particularly effective way to reach people who are less likely to
     seek voluntary counselling and testing (such as men and children). Partner notification
     and network tracing are two forms of index testing that have increased the yield of
     HIV testing efforts. The potential for intimate partner violence or social harm following
     partner notification or network tracing remains a concern, but thus far, reports of adverse
     events have been low.

     The increasing availability of HIV self-test kits is boosting several HIV testing modalities
     and improving HIV testing among young people, men and key populations. Concerns
     about linkages to confirmatory diagnosis and treatment initiation after a reactive self-test
     are being addressed through peer-assisted self-testing in a wide range of settings,
     including megacities in Asia and rural communities of southern Africa.

     The economic case for optimized HIV testing
     A special analysis by Avenir Health and UNAIDS provides a compelling economic case
     for countries to optimize their HIV testing programmes to reach the first 90 by 2020 by
     using a mixture of modalities that make an HIV test more accessible and acceptable to the
     people most at risk of HIV acquisition. The analysis focused on a hypothetical country with
     a generalized epidemic, where 80% of people living with HIV were aware of their status at
     the end of 2017. In the optimized strategy, community-based testing and self-testing are
     introduced and rapidly scaled up, while voluntary counselling and testing is scaled down.
     Compared to a scenario where the testing strategies and budget are kept constant from
     2017, front-loading resources for the expansion of HIV self-testing and community-based
     testing (Figure 4) could avert almost 200 000 additional deaths between 2018 and 2030.
     The optimized strategy also greatly reduces the number of tests needed to maintain the
     first 90 after 2020, which translates to significant cost savings and higher economic return
     for the national HIV testing programme. Using the full-income approach, which values
     changes in both income and better health, each US dollar invested in optimized testing
     and linkage to antiretroviral therapy would bring an economic return of US$ 3.40 during
     the period 2018–2030.

     Expanding access to viral load testing
     Viral load testing among people on treatment is increasing. Among the 63 countries that
     reported data to UNAIDS in both 2016 and 2017, about one quarter reported increases
     in viral load testing coverage. In some high-prevalence countries, the pace of scale-up
     has been extraordinary. In Uganda, for example, the number of districts with 90% or
     greater coverage of viral load testing increased from 29 to 70 in a single year, and the
     number of districts with less than 80% coverage decreased from 53 to 22 (Figure 5).

14
Figure 4. An optimized testing scenario
    Projected number of HIV tests in an optimized HIV testing strategy, by testing modality, hypothetical country with a
    generalized epidemic, 2017–2030

                                  18

                                  16

                                  14
Number of HIV tests (million)

                                  12

                                  10

                                   8

                                   6

                                   4

                                   2

                                   0
                                       2017      2018       2019      2020        2021        2022      2023      2024        2025       2026         2027   2028   2029   2030

                                Self-testing       Community-based testing               Testing focused on key populations          Mobile testing

                                 Voluntary counselling and testing           Provider-initiated counselling and testing

      Source: Avenir Health and UNAIDS, special analysis, 2018.

     Figure 5. Remarkable viral load testing scale-up
     Coverage of viral load testing, by district, Uganda, July 2016–June 2018

        July 2016 to June 2017                                                                                 July 2017 to June 2018

                                Less than 80%        80–89%          90% or higher

     Source: Uganda Viral Load Dashboard, Central Public Health Laboratories, Ministry of Health.

                                                                                                                                                                                  15
Multidisease approaches
     AIDS does not exist in isolation. The nature of HIV—both the way it is transmitted and
     how it attacks the immune system—makes the response to HIV a holistic effort to reduce
     risk from multiple health and social issues, and to address multiple medical conditions
     faced by people living with HIV. Multidisease approaches also are a key component of
     universal health coverage, which aims to ensure that all people have access to the health
     services they need without the risk of financial hardship when paying for them (22).

     Developments in molecular technologies mean that it is increasingly possible to
     diagnose different diseases rapidly using single platforms. These offer technical and
     financial efficiencies for national health systems, while expanding access to care and
     saving lives (23, 24). These “one-stop shop” multidisease services can encourage routine
     HIV testing as just another part of a health check-up, and they can also increase the
     efficiency of health care provision by reducing the need for the multiplication of staff,
     infrastructure and other resources. Multidisease services can also overcome barriers to
     HIV service uptake, such as stigma and discrimination, because visiting an integrated-service
     facility may make it harder for others to guess an individual’s HIV status (25, 26).

     Improving knowledge of HIV status and viral suppression for individuals
     and society
     Global efforts to set and meet bold targets like 90–90–90 reflect the societal importance
     of a robust HIV response. Achieving knowledge of status and viral suppression among
     the maximum percentage of people living with HIV will minimize AIDS-related morbidity
     and mortality, and it will contribute to the prevention of new HIV infections. In concert
     with efforts to achieve all of the commitments made by the United Nations General
     Assembly at the 2016 High-Level Meeting on Ending AIDS, this can put the end of the
     AIDS epidemic within reach.

     This report takes a deep dive into the HIV testing and treatment data that countries
     report to UNAIDS, as well as data and experiences from large-scale programmes,
     small-scale projects and cutting-edge research across dozens of countries and a variety
     of epidemic settings. These data reveal gaps and barriers, as well as innovative ways
     to overcome barriers and fill coverage gaps. This body of information also shows that
     the HIV response is first and foremost about people. Behind every gap in knowledge of
     HIV status or viral suppression gap among people living with HIV are millions of people
     being left behind—individuals who are not being reached by services delivered using
     status-quo methods.

     A diversity of approaches is needed to reach the diversity of people in need.

16
Leading by example                                              “We have not won the
In 2017, the President of France, Emmanuel Macron, led             battle against AIDS.
by example by taking an HIV test. Mr Macron and the First
Lady of France, Brigitte Macron, visited a hospital in Saint
                                                                   We need to protect
Denis in northern Paris that caters to people in vulnerable      ourselves, get tested,
situations, including migrants. In France, one in five people
living with HIV do not know their HIV status. The majority      get treated and accept
of new HIV infections in the country occur among gay men
and other men who have sex with men.
                                                                  those in society who
                                                                             have HIV.”
                                                                   Emmanuel Macron, President of France

                                                                  Crédit : Présidence de la République

                                                                                                          17
PART I.
     Gaps and
     barriers
        Gaps across the HIV testing and treatment cascade
        Barriers faced by infants living with HIV
        When services are available but unacceptable
        When services are available but inaccessible

18
AT A GLANCE

GAPS IN KNOWLEDGE OF HIV STATUS
AND VIRAL SUPPRESSION
The largest gap in the HIV testing and treatment cascade is HIV testing, with
25% of people living with HIV globally unaware of their HIV status. Another
16% were aware of their HIV status but not on treatment, and an estimated 11%
were on treatment but not virally supressed.

                                         Low viral suppression                  Deadly delays
The viral load testing gap               among key populations                  in infant diagnosis

Viral load testing coverage remains      Available data from small-scale        The time between blood sample
low in many parts of the world.          studies suggest that viral suppres-    collection from infants exposed
One quarter of reporting coun-           sion is far below the target needed    to HIV and the return of results
tries indicated that less than half of   to slow transmission among these       to caregivers often stretch for
people on treatment received an          populations.                           months, past the time period of
annual viral load test.                                                         peak mortality for children living
                                                                                with HIV.

                                         Barriers faced by                      Confidentiality and
Stigma and discrimination                women living with HIV                  disclosure

Stigma and discrimination create         Structural factors that affect         Breaches of confidentiality in
barriers to HIV testing and treat-       women’s overall access to health       health-care settings still occur with
ment, particularly for adolescents       and resources combine with the         alarming frequency, undermining
and young people, men, key pop-          common taboos and misconcep-           trust in health-care providers and
ulations and vulnerable groups,          tions that surround HIV, creating      decreasing the willingness of peo-
such as migrants, refugees and           multiple barriers to viral suppres-    ple to access HIV-related health
people living with disabilities.         sion among women living with HIV.      care.

                                         Insufficient
Too difficult and                        HIV–tuberculosis                       A growing danger of
too expensive                            service integration                    drug resistance

When people must travel long             Tuberculosis is the leading prevent-   Suboptimal retention in treatment
distances to a clinic, transport is      able cause of death among people       and care services, drug stock-outs
expensive or unavailable, or clinic      living with HIV. Despite the clear     and inadequate treatment support
hours are not suited to individuals      advantages, integration of tuber-      can increase HIV drug resistance.
or groups, the uptake of these           culosis and HIV services is far from   Adherence support and monitor-
services decreases. Limited house-       universal. Just 44 of 116 reporting    ing of viral load suppression is key
hold resources and the inability to      countries have fully integrated HIV    to maintaining the robustness of
pay user fees rank among the top         and tuberculosis treatment.            newer generations of antiretroviral
factors blocking access to health-                                              medications, such as integrase
care services among people living                                               inhibitors.
with HIV.
                                                                                                                        19
GAPS ACROSS THE HIV TESTING
     AND TREATMENT CASCADE
                      Knowledge of HIV status is the largest gap
                      Nearly two decades of activism and ambition has driven the expansion of antiretroviral
                      therapy for people living with HIV. In recent years, the 90–90–90 targets have focused
                      efforts across a cascade of testing and treatment services, putting additional emphasis
                      on the importance of knowing one’s HIV status and, if living with HIV, initiating treatment
                      as soon as possible and adhering to treatment. The goal is sustained viral suppression,
                      which not only protects people living with HIV from AIDS-related illness, it also prevents
                      transmission of the virus to others.

                                                                             90 90 90
     The 90–90–90 testing and treatment targets

     By 2020:

         90% of people living with HIV know their HIV status.

         90% of people who know their HIV-positive status are accessing treatment.

         90% of people on treatment have suppressed viral loads.

                      At the end of 2017, an estimated 75% [55–92%] of people living with HIV globally knew
                      their HIV status; among them, 79% [59– >95%] were accessing antiretroviral therapy,
                      and 81% [60– >95%] of people accessing treatment had suppressed viral loads. Despite
                      this laudable progress, less than half of all people living with HIV (47% [35–59%]) had
                      suppressed viral loads at the end of 2017.

                      Among the 53% of people living with HIV who were not virally supressed, the largest
                      gap in the HIV testing and treatment cascade is HIV testing. One quarter of people
                      living with HIV globally were unaware of their HIV status, another 16% were aware of
                      their HIV status but not on treatment, and an estimated 11% were on treatment but
                      not virally supressed (Figure 6).

20
Three gaps on the path to viral suppression
Figure 6. Knowledge of status, treatment and viral suppression gaps, global, 2017

                  TESTING                         TREATMENT                VIRAL                                          VIRALLY
                    GAP                              GAP              SUPPRESSION GAP                                   SUPPRESSED
                  25.4%                             15.8%                     11.4%                                       47.4%
                                                                                                                          [35–59%]

People living with HIV who do              People living with             People living with         People living with HIV on treatment who are
not know their status and are              HIV who know their             HIV on treatment           virally suppressed
not on treatment                           status but are not on          who are not virally
                                           treatment                      suppressed

                      NOT ON TREATMENT                                                                 ON TREATMENT

        = 1% of people living with HIV globally

Figure 7. Knowledge of status, treatment and viral suppression gaps, global, 2015–2017

            100

             90                                                                          Testing gap: Percentage of people with HIV who do not know
                                                                   25%
                                                                                         their status and are not on treatment
                            33%                   30%
             80

             70
                                                                   16%                   Treatment gap: Percentage of people living with HIV who
                                                                                         know their status but are not on treatment
            60                                    17%
                            18%
 Per cent

                                                                   11%
            50
                                                  11%
                                                                                         Viral suppression gap: Percentage of people living with HIV
                            11%
            40                                                                           who are on treatment but not virally suppressed

            30
                                                                   47%                   Virally suppressed: Percentage of people living with HIV who
            20                                    43%
                            38%                                                          are on treatment and virally suppressed

             10

              0

                            2015                  2016             2017

Source: UNAIDS special analysis, 2018.

                                                                                                                                                        21
The growing prominence of the viral suppression gap
                                       Although the gap in knowledge of HIV status is the largest, the viral suppression gap
                                       is growing more prominent. Knowledge of HIV status and treatment coverage have
                                       increased more rapidly than viral suppression. As a result the percentage of people
                                       of people living with HIV who are not virally suppressed has remained static at 11% in
                                       recent years, and the viral suppression gap’s share of the total gap has grown from 18%
                                       in 2015 to 21% in 2017 (Figure 7).

                                       In some countries, the viral suppression gap is growing in size. South Africa’s Thembisa
                                       model, developed by the University of Cape Town and used by South Africa’s
                                       Department of Health to produce national estimates, shows that the percentage of
                                       people living with HIV who are on treatment but not virally suppressed in South Africa
                                       has risen from an estimated 0.1% in 2004 to an estimated 12.4% in 2017. Over the same
                                       time period, the percentage of people living with HIV who do not know their HIV status
                                       has shrunk from an estimated 76.6% to an estimated 10.0% (Figure 8) (1).

                                       The UNAIDS 90–90–90 estimates for 2015–2017 in eastern and southern Africa show the
                                       same pattern: the viral suppression gap increased from 10% in 2015 to 14% in 2017. In
                                       most other regions, the gap has remained stable, and in Latin America—where testing
                                       and treatment programmes have achieved high coverage for many years—the percent-
                                       age of people living with HIV who are on treatment but not virally supressed is slowly
                                       decreasing (Figure 9).

     Figure 8. The growing viral suppression gap in South Africa
     Knowledge of status, treatment and viral suppression gaps, South Africa, 2001–2017

                 100

                  90

                  80

                  70

                  60
     Per cent

                  50

                  40

                  30

                  20

                  10

                   0
                         2001   2002     2003   2004     2005   2006    2007   2008   2009    2010     2011   2012   2013   2014   2015   2016   2017

                Testing gap     Treatment gap          Viral suppression gap      Virally suppressed

     Source: Estimates from the Department of Health, South Africa, Thembisa model, 2018.

22
Figure 9. Trends vary among regions
Knowledge of status, treatment and viral suppression gaps, two regions, 2015–2017

EASTERN AND SOUTHERN AFRICA

             100

                                                19%           Testing gap: Percentage of people with HIV who do not know
              90
                    26%                  23%                  their status and are not on treatment
              80
                                                15%
              70
                                         17%                  Treatment gap: Percentage of people living with HIV who
                    20%                                       know their status but are not on treatment
              60                                14%
  Per cent

                                         12%
              50    10%
                                                              Viral suppression gap: Percentage of people living with HIV
              40                                              who are on treatment but not virally suppressed

              30                                52%
                                         48%                  Virally suppressed: Percentage of people living with HIV who
              20    45%
                                                              are on treatment and virally suppressed

              10

               0

                   2015                  2016   2017

Source: UNAIDS special analysis, 2018.

LATIN AMERICA

             100

              90                                              Testing gap: Percentage of people with HIV who do not know
                    27%                  23%    23%           their status and are not on treatment
              80

              70
                                                16%           Treatment gap: Percentage of people living with HIV who
                                         19%
                    19%                                       know their status but are not on treatment
              60
                                                 9%
  Per cent

              50                         12%
                    12%
                                                              Viral suppression gap: Percentage of people living with HIV
              40                                              who are on treatment but not virally suppressed

              30
                                                52%
                                         45%                  Virally suppressed: Percentage of people living with HIV who
                    42%
              20                                              are on treatment and virally suppressed

              10

               0

                   2015                  2016   2017

Source: UNAIDS special analysis, 2018.

                                                                                                                             23
The viral load testing gap
                             Monitoring viral load is the recommended approach for checking that treatment is
                             working and determining whether viral suppression is achieved and sustained (2). Viral
                             load monitoring is also used for diagnosing and confirming treatment failure.

                             Viral load testing is already the standard of care for people living with HIV in most
                             high-income countries. However, viral load testing coverage remains low in many parts
                             of the world. Among the 79 countries that reported 2017 data to UNAIDS, one quarter
                             (21) indicated that less than half of people on treatment received an annual viral load
                             test. Another 15% of these countries (12) reported that between half and three quarters
                             received an annual viral load test (Table 2). Greater political will and funding are needed
                             to scale up capacity in low-income and middle-income countries (3).

     Table 2. Low viral load testing coverage in many countries
     Viral load testing coverage among people on treatment, countries with available data, 2017

                                   75% and above                                    50–74%                Less than 50%

           Algeria           El Salvador          Lithuania          Russian        Azerbaijan     Afghanistan      Malaysia
                                                                    Federation

          Armenia             Eswatini            Maldives          Saudi Arabia    Cambodia         Albania       Mauritania

          Bahamas             Georgia              Mexico            Singapore     Côte d’Ivoire      Benin         Myanmar

         Barbados            Honduras            Mongolia            Sri Lanka        Cuba         Burkina Faso      Nigeria

            Brazil            Jamaica           Montenegro           Tajikistan      Ethiopia        Burundi        Pakistan

          Bulgaria          Kazakhstan            Morocco            Thailand        Greece         Cameroon       Philippines

            Chile              Kenya               Oman             The former       Namibia         Gabon           Senegal
                                                                     Yugoslav
                                                                    Republic of
                                                                    Macedonia

          Comoros              Kuwait             Panama              Tunisia         Nepal          Ghana         South Sudan

           Croatia           Kyrgyzstan           Paraguay            Uganda        Nicaragua      Iran (Islamic      Togo
                                                                                                   Republic of)

          Czechia             Lao People’s          Peru             Uruguay        Suriname         Jordan         Viet Nam
                             Democratic
                               Republic

         Dominican            Lebanon              Qatar                             Ukraine       Madagascar
          Republic
          Ecuador             Lesotho           Republic of                        Uzbekistan
                                                 Moldova

     Source: UNAIDS 2018 estimates; Global AIDS Monitoring, 2018.

24
HIV testing and viral suppression
    among key populations living with HIV

    The HIV epidemic disproportionately continues to impact key populations at substantially increased risk for HIV
    infection. A UNAIDS analysis of available data shows that transgender women and men, sex workers, people in
    prisons and other closed settings, people who inject drugs and gay men and other men who have sex with men
    have relative risks of HIV acquisition ranging from five to 28 times greater than the rest of the population.

    Available data suggest that 47% of new HIV infections globally in 2017 were among key populations and their sexual
    partners. The 90–90–90 targets cannot be achieved unless the testing and treatment needs of key populations are
    met. Epidemiological and programme data must be collected to guide efforts to reach these targets.

    HIV testing coverage among key populations is often measured through special surveys that use respondent-driven
    sampling. UNAIDS analysis of data from these surveys shows that awareness of HIV status among key populations
    across various districts, cities and countries around the world ranges from the low teens to above 90%.* These
    surveys also suggest that the percentage of key populations who report taking an HIV test and receiving the results
    within the last 12 months is between 50% and 75%. This testing rate has been stable for several years.

    Viral suppression data for specific key populations are not yet widely available, and the available data are
    contradictory. High levels of adherence to treatment among female sex workers have been reported in Burkina
    Faso, Mozambique, South Africa and Zimbabwe, while other data from South Africa also show high viral
    suppression rates (84%) among gay men and other men who have sex with men living with HIV who received
    treatment (4–7). The majority of evidence points to weaker treatment adherence among key populations
    (8). Discrimination and harassment against gay men and other men who have sex with men undermine their
    retention in HIV care (9). Drug use has been linked to low treatment adherence in Canada and Estonia (10, 11).
    On aggregate, available data from small-scale studies suggest that viral suppression is far below the target
    needed to slow transmission among these populations (Figure 10).

      Figure 10. Low viral suppression among key populations
      Median percentage of key populations† living with HIV who are virally suppressed, by region, 2013–2017

                             100

                              90

                              80
Viral load suppression (%)

                              70

                              60
                              50

                              40

                              30

                              20

                              10
                               0
                                    Asia and the     Eastern      Eastern and   Latin America   Middle East      North        Western       Western
                                       Pacific     Europe and      southern        and the      and North       America      and central   and central
                                        n=16       central Asia      Africa      Caribbean        Africa          n=3          Africa        Europe
                                                      n=10            n=8            n=3           n=7                          n=3           n=2

        †
                     Gay men and other men who have sex with men, sex workers, people who inject drugs and transgender women and men.
        Note: The figure reflects a range of sources over a range of years, including early data on viral load suppression among key populations. These data
        are not representative of viral load suppression among key populations at national level.
        Source: See the chapter reference list for detailed sourcing.

      * Respondent-driven sampling relies on members of a hard-to-find population referring additional people within the population to the data
      collectors of the study. This snowball sample is then adjusted using a mathematical model that weights the sample to compensate for the fact that
      the sample was collected in a nonrandom way.

                                                                                                                                                               25
BARRIERS FACED BY
     INFANTS LIVING WITH HIV
                   Antiretroviral therapy for the prevention of mother-to-child transmission has greatly reduced
                   new HIV infections among children. Globally, 1.4 million [880 000–2 100 000] new child
                   infections have been averted since 2010, and in 2017, there were just 180 000 [110 000–260 000]
                   transmissions of HIV from mother to child.

     Early infant diagnosis: Global AIDS monitoring guidelines define early infant diagnosis as testing infants
     of women living with HIV within two months of birth. Because of the danger of HIV transmission through
     breastfeeding, HIV-exposed children should be retested three months after breastfeeding ends or at 18
     months of age, whichever is later.

                         However, efforts to diagnose children living with HIV and initiate treatment face
                         numerous challenges. Due to the presence of maternal antibodies in infants and young
                         children, rapid diagnostic testing is ineffective up until 18 months of age. Virological
                         testing using nucleic acid testing technologies can be used effectively, but diagnosis
                         can still be difficult. Infants infected at or around delivery may not have a detectable
                         level of virus for several days or even weeks. In addition, the ability of nucleic acid
                         testing to detect virus in the blood may be affected by antiretroviral medication
                         taken by the mother or infant for postnatal prophylaxis, or by the mother during
                         breastfeeding, resulting in false-negative results.

                         At the same time, HIV disease progression among perinatally infected infants is much
                         faster than among adults. Without treatment, up to 50% of children born with HIV will
                         die before their second birthday, with peak mortality at two or three months of age
                         (12–14). The earliest possible initiation on treatment is therefore essential for saving the
                         lives of HIV-infected infants.

                         To manage these difficulties, infants with known or uncertain HIV exposure should be
                         tested for HIV using a virological test at the first postnatal visit (usually four to six weeks)
                         or other child health visit; those who test positive should be started on treatment
                         without delay, while a confirmatory test is undertaken (15). Because of the danger of
                         HIV transmission through breastfeeding, infants who test negative at this time should
                         be retested throughout the entire exposure period, which ends three months after
                         breastfeeding ends or at 18 months of age, whichever is later.

                         Insufficient availability of virological testing and the numerous visits to a health facility and
                         time required to receive a result negatively affect coverage. In 23 focus countries—which
                         accounted for 87% of the world’s births to women living with HIV in 2017—just 52% of
                         newborns exposed to HIV received an HIV test within eight weeks of birth (Figure 11).

26
Figure 11. Nearly half of HIV-exposed infants are not tested
Percentage of children born to women living with HIV who were tested for HIV within eight weeks of birth, 23 focus
countries, 2017

           100

                                                                                                                                                                                               95       95
            90

            80                                                                                                                                                                       81

            70
                                                                                                                                                                           65
            60
Per cent

            50                                                                                                                                                   52                                            52
                                                                                                                          51    51     51        51    51
                                                                                                                50
                                                                                                       48
            40
                                                                                                 46
                                                                                  36     40
            30                                                            34
                                                                   30
            20                                            23
                                                    20
            10
                                 5        12
                      1     1
             0
                 sia

                           la

                                ad

                                       ia

                                                 i

                                                         a

                                                               na

                                                                         o

                                                                                a

                                                                                       ia

                                                                                              re

                                                                                                      a

                                                                                                            da

                                                                                                                     a

                                                                                                                               e

                                                                                                                                     n

                                                                                                                                            o

                                                                                                                                                      a

                                                                                                                                                             i

                                                                                                                                                                       e

                                                                                                                                                                                 i

                                                                                                                                                                                          ia

                                                                                                                                                                                                     a

                                                                                                                                                                                                             s
                                               nd

                                                                                                                                                            aw

                                                                                                                                                                                in

                                                                                                                                                                                                             ie
                                                         di

                                                                               ni

                                                                                                      bi

                                                                                                                     an

                                                                                                                                                  ny

                                                                                                                                                                                                    ric
                                                                                                                           qu

                                                                                                                                  oo

                                                                                                                                                                      bw
                                                                    ng

                                                                                                                                            th
                       go

                                     er

                                                                                    op

                                                                                                                                                                                          ib
                                                                                            oi

                                                                                                                                                                                at
                                                              ha
                            Ch

                                                                                                           an
                 ne

                                                                                                                                                                                                          tr
                                                                             za
                                                     In

                                                                                                   m
                                            ru

                                                                                                                                       so

                                                                                                                                                          al
                                                                                                                                                 Ke
                                                                                                                 w

                                                                                                                                                                                     am

                                                                                                                                                                                               Af
                                 ig

                                                                                                                          bi

                                                                                                                                er
                                                                                            Iv
                                                                   Co

                                                                                                                                                                 ba

                                                                                                                                                                           w
                      An

                                                                                    hi

                                                                                                                                                                                                        un
                                                          G

                                                                                                       Ug
                                                                                                 Za

                                                                                                                                                      M
                                                                            n
            do

                                        Bu

                                                                                                                ts
                                                                                         d’
                                 N

                                                                                                                                     Le
                                                                                                                      am

                                                                                                                                m

                                                                                                                                                                       Es
                                                                                  Et
                                                                         Ta

                                                                                                                                                                                           h
                                                                                                                                                                                 N
                                                                                                                                                               m

                                                                                                                                                                                                     co
                                                                                                            Bo
                                                               e

                                                                                                                                                                                          ut
                                                                                                                               Ca
           In

                                                                                       te
                                                               th

                                                                                                                                                            Zi
                                                                                                                     oz
                                                                        of

                                                                                                                                                                                      So

                                                                                                                                                                                                    s
                                                                                    Cô

                                                                                                                                                                                                cu
                                                                                                                 M
                                                              of

                                                                    ic

                                                                                                                                                                                           Fo
                                                          ic

                                                                   bl
                                                         bl

                                                               pu
                                                     pu

                                                              Re
                                                    Re

                                                          d
                                                         ite
                                               tic
                                                     Un
                                               ra
                                          oc
                                       em
                                      D

Source: 2018 Global AIDS Monitoring.

                                     The long and winding road to infant diagnosis
                                     Virological testing technologies often are only available in centralized reference
                                     laboratories. Considerable infrastructure and training are required, as are transport
                                     networks for the delivery of specimens to the laboratory. The process of transporting
                                     samples to central laboratories from decentralized health facilities, batching blood samples
                                     for testing and returning the results to testing sites often creates long delays between the
                                     time when the blood sample is collected and when the result is received (16, 17).

                                     Unfortunately, these constraints are not limited to rural and remote areas. Even where
                                     health facilities are in urban areas and close to laboratories, turnaround times can stretch
                                     to three to four months—past the time period of peak mortality—and the proportion of
                                     results returned can be as low as one in five (Figure 12) (18). The result is a delay in initiating
                                     treatment—or a complete failure to initiate it—and high levels of infant mortality (19).

                                                                                                                                                                                                                    27
Figure 12. Slow return of test results threatens the lives of infants living with HIV
     Early infant diagnosis, turnaround time from sample collection to return of results and percentage of results returned
     to caregivers, clinics in urban settings, seven countries, 2016–2017

                        140                                                                                                                100%                                                100%   100
                                                                                          97%                                                                                      97%
                                                                                                                                                                                                      90
                                                                87%
                        120                                                                                                                                            83%
                                               120                                                                                                                                                    80

                                                                                                                                                                                                            Results returned to caregiver (%)
                        100                                                                            73%         70%         70%                                                                    70
                                                                                                 97           97
      Number of days

                                                                                                                                                                                                      60
                        80                                              85           87
                                                                                                                                                      80
                                                                                                                                                                                                      50
                                                                                                                                                           47%
                        60              43%                64
                                                                                                                                                                                          61          40
                                                                                                                                                                              58
                                                                             33%                                                                                  52
                                                                                                                                                                                                      30
                        40

                                                     20%                                                                                                                                              20
                                   30                                                                                     29          29
                        20
                                                                                                                                                                                                      10

                          0                                                                                                                                                                           0
                               E

                                              SS

                                                           A

                                                                      BH

                                                                                TE

                                                                                                SC

                                                                                                          UT

                                                                                                                         C

                                                                                                                                     BH

                                                                                                                                                  A

                                                                                                                                                               JH

                                                                                                                                                                             X

                                                                                                                                                                                         PH
                              CM

                                                                                                                                                                        CX
                                                      CM

                                                                                                                     iM

                                                                                                                                                 SD
                                         CA

                                                                             CM

                                                                                                                                                             St
                                                                                           CM

                                                                                                                                                                                     G
                                                                  M

                                                                                                                                 H
                                                                                                        re

                                                                                                                                            M
                                                                                                                  in

                                                                                                                                                                       e
                                                                                                                               a

                                                                                                                                                                                    e
                                                                                                                                                              o
                                                                                                         oi
                         n

                                                                n
                                                     n
                                        n

                                                                                                                                                                    qu
                                                                                                                             ny
                                                                                                                at

                                                                                                                                                                                  bw
                                                                                                                                                           th
                         oo

                                                                           re
                                                             oo
                                                     oo

                                                                                      re

                                                                                                                                             o
                                                                                                       Iv
                                     oo

                                                                                                                                          th
                                                                                                               w

                                                                                                                                                      so
                                                                                                                          Ke
                                                                          oi

                                                                                                                                                                   bi
                                                                                       oi

                                                                                                     d’
                       er

                                                           er
                                                   er

                                                                                                                                                                              ba
                                   er

                                                                                                              Es

                                                                                                                                      so
                                                                        Iv

                                                                                                                                                                  am
                                                                                     Iv

                                                                                                                                                  Le
        m

                                                           m
                                                m

                                                                                                te

                                                                                                                                                                             m
                               m

                                                                      d’

                                                                                   d’

                                                                                                                                     Le
      Ca

                                                          Ca
                                              Ca

                                                                                            Cô

                                                                                                                                                              oz

                                                                                                                                                                             Zi
                              Ca

                                                                  te

                                                                                te

                                                                                                                                                             M
                                                                 Cô

                                                                             Cô

     Source: Baseline data from EGPAF-supported sites in nine countries (n = 30 infants/site; sampled in 2016–2017).

                                                    Paediatric treatment
                                                    Linking children to treatment following an HIV diagnosis and achieving sustained viral
                                                    suppression is also challenging. HIV treatment services are usually designed for adults
                                                    and tend to lack consideration of the specific needs of younger people (children and
                                                    adolescents) (20). In terms of actual antiretroviral medicines, there is a pressing need for
                                                    age-appropriate paediatric formulations: development of optimal paediatric formulations
                                                    still lags eight to 10 years behind that of adults, mainly due to the lack of market incentives
                                                    and technical complexities in manufacturing (21). High rates of HIV drug resistance have
                                                    been observed in infants, children and adolescents.1 Children and adolescents also are
                                                    reliant on the ability of their parents or caregivers to shoulder the burden of seeking out
                                                    treatment and providing daily care and support—an ability that may be compromised by
                                                    material and psychological difficulties (22).

                  1
                   See, for example: Muri L, Gamell A, Ntamatungiro AJ, Glass TR, Luwanda LB, Battegay M et al. Development of HIV drug resistance and
                  therapeutic failure in children and adolescents in rural Tanzania: an emerging public health concern. AIDS.2017;31(1):61–70.

28
You can also read