VITAL SIGNS 2021 THE HEALTH AND READINESS OF THE DEFENSE INDUSTRIAL BASE - National Defense Industrial Association
←
→
Page content transcription
If your browser does not render page correctly, please read the page content below

VITAL SIGNS 2021 THE HEALTH AND READINESS OF THE DEFENSE INDUSTRIAL BASE

NDIA VITAL SIGNS 2021

TABLE OF CONTENTS
Forewords. . . . . . . . . . . . . . . . . . . . . . . . . . . . . . . . . . . . . . . . . . . . . . . . . . . . . . . . . . . . . . . . . . . . . . . . . . . . . . . . . . . . . . . . . . . . . . . . . . . . . . . . . . . 3

Contributors. . . . . . . . . . . . . . . . . . . . . . . . . . . . . . . . . . . . . . . . . . . . . . . . . . . . . . . . . . . . . . . . . . . . . . . . . . . . . . . . . . . . . . . . . . . . . . . . . . . . . . . . 4

Executive Summary.. . . . . . . . . . . . . . . . . . . . . . . . . . . . . . . . . . . . . . . . . . . . . . . . . . . . . . . . . . . . . . . . . . . . . . . . . . . . . . . . . . . . . . . . . . . . . 5

Introduction.. . . . . . . . . . . . . . . . . . . . . . . . . . . . . . . . . . . . . . . . . . . . . . . . . . . . . . . . . . . . . . . . . . . . . . . . . . . . . . . . . . . . . . . . . . . . . . . . . . . . . . . . 7

Demand. . . . . . . . . . . . . . . . . . . . . . . . . . . . . . . . . . . . . . . . . . . . . . . . . . . . . . . . . . . . . . . . . . . . . . . . . . . . . . . . . . . . . . . . . . . . . . . . . . . . . . . . . . . . 12

Production Inputs.. . . . . . . . . . . . . . . . . . . . . . . . . . . . . . . . . . . . . . . . . . . . . . . . . . . . . . . . . . . . . . . . . . . . . . . . . . . . . . . . . . . . . . . . . . . . . . . 17

Innovation. . . . . . . . . . . . . . . . . . . . . . . . . . . . . . . . . . . . . . . . . . . . . . . . . . . . . . . . . . . . . . . . . . . . . . . . . . . . . . . . . . . . . . . . . . . . . . . . . . . . . . . . . 24

Supply Chain. . . . . . . . . . . . . . . . . . . . . . . . . . . . . . . . . . . . . . . . . . . . . . . . . . . . . . . . . . . . . . . . . . . . . . . . . . . . . . . . . . . . . . . . . . . . . . . . . . . . . 29

Competition. . . . . . . . . . . . . . . . . . . . . . . . . . . . . . . . . . . . . . . . . . . . . . . . . . . . . . . . . . . . . . . . . . . . . . . . . . . . . . . . . . . . . . . . . . . . . . . . . . . . . . 34

Industrial Security. . . . . . . . . . . . . . . . . . . . . . . . . . . . . . . . . . . . . . . . . . . . . . . . . . . . . . . . . . . . . . . . . . . . . . . . . . . . . . . . . . . . . . . . . . . . . . 42

Political & Regulatory.. . . . . . . . . . . . . . . . . . . . . . . . . . . . . . . . . . . . . . . . . . . . . . . . . . . . . . . . . . . . . . . . . . . . . . . . . . . . . . . . . . . . . . . . . 45

Productive Capacity & Surge Readiness.. . . . . . . . . . . . . . . . . . . . . . . . . . . . . . . . . . . . . . . . . . . . . . . . . . . . . . . . . . . . . . . 50

Vital Signs Survey Results. . . . . . . . . . . . . . . . . . . . . . . . . . . . . . . . . . . . . . . . . . . . . . . . . . . . . . . . . . . . . . . . . . . . . . . . . . . . . . . . . . . 54

Conclusion                    .......................................................................................................                                                                                    60

Appendices. . . . . . . . . . . . . . . . . . . . . . . . . . . . . . . . . . . . . . . . . . . . . . . . . . . . . . . . . . . . . . . . . . . . . . . . . . . . . . . . . . . . . . . . . . . . . . . . . . . . . . . 61

                                                                                                               2
NDIA VITAL SIGNS 2021
FOREWORDS
NDIA
America is at a crossroads with an increasingly dangerous and businesses within it—struggling today to survive in order to pro-
complex international security environment coupled with internal duce in the future for our nation’s military and our nation’s security.
divisions exacerbated by the reckless rhetoric that led to a violent Vital Signs 2021, our second annual edition of our study on the
attack on our nation’s temple of democracy, the United States health and readiness of the defense industrial base, is uniquely
Capitol. timely. Those who read last year’s report will understand that the
Thankfully, as shown by the recent passing of the Fiscal Year report is based on data gathered through the previous year. As
2021 National Defense Authorization Act via an override of a presi- a result, what readers will see here is the state of the base at the
dential veto, providing for the common defense remains a unifying, precipice of the pandemic with several scores declining, a h alving
bipartisan value. The provision of that defense is predicated on a of new entrants each year between 2018 and 2019, and a defense
vibrant and productive defense industrial base. budget set to rise at a meek 0.05% pre-inflationary rate.
That base is facing multiple headwinds in its efforts to keep Accordingly, policymakers on Capitol Hill, in the executive
American and allied warfighters advantaged in all domains of branch, and in academia as well as our think tanks should take
conflict. These challenges include but are not limited to intense notice. As I stated last year, our warfighters’ capability superiority
industrial security threats highlighted by the recent SolarWinds is not a birthright; rather, it is earned through hard work, invest-
hack attributed to Russia, along with myriad breaches attributed ments, and good policies driven by good strategy.
to China; expected flat budgets going forward; decreased invest- We hope and expect this report to drive a much-needed discus-
ments in the basic science that fuels U.S. innovation; skilled, cleared sion on industrial base issues as the greater international strategic
workforce shortages; and increased regulatory burdens and bar- competition heats up despite, and a bit because of, the pandemic.
riers to entry for those seeking defense contracts.
Put those challenges together with the COVID-19 crisis and
you get a defense industrial base—especially the critical small Gen Hawk Carlisle, USAF (Ret)
President and Chief Executive Officer, NDIA
GOVINI
The intensity of great-power rivalry between the United States and As originally conceived, the goal of Vital Signs is to persistently
its principal strategic competitors, China and Russia, is increasing monitor a set of key metrics to measure the health of the defense
and, with it, the imperative for a healthy defense industrial base industrial base over time. With this second edition, Vital Signs has
to ensure U.S. military-technical advantage. Yet, the health of the realized this vision. By providing a relative comparison to last year’s
defense industrial base—like its potential to improve—is subject assessment, it applies data-driven insights to unearth the key trends
to a host of economic, political, societal, technological, fiscal, and at play and points to the primary areas that need focused govern-
regulatory forces that often move at cross-purposes. ment and industry action.
Cognizant of these facts, the U.S. Defense Department, the Great-power competitors, global market forces, and exogenous
Congress, and industry are each conducting a range of initiatives to shocks such as the COVID-19 pandemic will continually test the
improve the health of the defense industrial base. From acquisition resilience and innovativeness of the defense industrial base. The
reform to supply chain assurance and cybersecurity to improved Vital Signs report’s ability to regularly diagnose the defense indus-
design and manufacturing processes, there is a flurry of activity trial base and determine where it is healthy and where it is ill is
underway to enhance the defense industrial base’s resilience and essential to finetune the nation’s efforts to maintain an effective
innovativeness. The focus is high, but progress is slow. Moreover, military-technical advantage.
the scale and complexity of the defense industrial base can make it
hard to determine where progress is occurring, where it is not, and
where, therefore, to focus greater attention. The answer lies in data. Tara Murphy Dougherty
Chief Executive Officer, Govini
3
NDIA VITAL SIGNS 2021

CONTRIBUTORS
NDIA                                                            Logan Stalter
                                                                Copywriter/Editor and Online Community Specialist,
                                                                Marketing & Communications
Col Wesley Hallman, USAF (Ret)
                                                                Copyediting
Senior Vice President, Strategy & Policy
Executive Editing
                                                                Hannah Meushaw
                                                                Senior Graphic Designer, Marketing & Communications
Nicholas Jones
                                                                Layout and Design
Director, Regulatory Policy
Editing
                                                                Eve Dorris
                                                                Director, Information Production Office,
Robert Van Steenburg                                            Marketing & Communications
Associate, Regulatory Policy
                                                                Design Support
Data, Writing, and Editing

                                                                Evamarie Socha
Sam Underwood                                                   Director, Public Relations & Communications,
Associate, Strategy                                             Marketing & Communications
Data, Special Events, and Editing                               Media Outreach

Shaliza Tolliver
Junior Policy Fellow
Southern University Law Center
                                                                GOVINI
                                                                Matt Wiest
Elliot Seckler                                                  Engagement Manager
Junior Policy Fellow
Johns Hopkins SAIS
                                                                Milena Michael
                                                                Analyst
Samantha Beu
Junior Policy Fellow
                                                                Andrew Maclary
UC San Diego School of Global Policy & Strategy
                                                                Senior Analyst

Dillon Springer
                                                                Owen Munford
Junior Policy Fellow
                                                                Vice President, Marketing
Syracuse University College of Law

                                                                Bob Rhea
William Fotter
                                                                Senior Vice President, Mission Solutions
Junior Policy Fellow
Georgetown McCourt School of Public Policy
                                                                Jen Gebhardt
                                                                Analyst
Joseph Sobecki
Junior Policy Fellow
                                                                Andy Shaw
Florida State University College of Law
                                                                Marketing

Daniel Tiznado
Junior Policy Fellow
George Mason Schar School of Policy

Tarun Krishnakumar
Junior Policy Fellow
Georgetown University Law Center

                                                            4
NDIA VITAL SIGNS 2021
EXECUTIVE SUMMARY
In 2018, the Department of Defense (DoD) released “Assessing and competition, industrial security, political and regulatory, and pro-
Strengthening the Manufacturing and Defense Industrial Base and ductive capacity and surge readiness. Categorized by factor, we
Supply Chain Resiliency of the United States” (13806 Report), a analyzed over 40 publicly available longitudinal statistical indica-
report focused on the production risks to critical defense indus- tors, converted each of them into an index score on a scale of 0 to
trial supply chains. The report starkly framed the health of the U.S. 100, and evaluated three years of scores for each indicator. With
defense industrial base (DIB) as key to the readiness of the United the exception of our Vital Signs 2021 Survey of NDIA members
States in an age of great-power competition. Despite the 13806 that was fielded in August 2020, our datasets are lagging indica-
Report’s high-resolution snapshot of the defense industrial base’s tors that were published before the nationwide lockdowns that
“unprecedented set of challenges,” the report did not provide the began in March 2020 at the beginning of the COVID-19 pandemic
American public or the defense policy community a publicly avail- in the United States. These lagging indicators provide insight into
able summary measurement of the health and readiness of the how the defense industrial base entered the pandemic and will give
defense industrial base or an accessible way of monitoring the future policymakers a baseline for evaluating the defense industrial
DIB’s “pulse” and key “vital signs” to track the health of the defense base’s ability to cope with a crisis.
industrial base over time.1
To fill this gap, last year, the National Defense Industrial OVERALL SCORES
Association (NDIA) published Vital Signs 2020, which provided an Change,
Condition 2018 2019 2020
unclassified summary of the health and readiness of the defense 2018 – 2020
industrial base that was accessible by both the American public Demand 77 85 93 +16
and the defense policy community. Vital Signs 2021 is the second Production Inputs 68 68 68 0
annual installment of our Vital Signs publication. In order to pro-
Innovation 73 70 71 -2
vide a comprehensive assessment of the defense industrial base,
Supply Chain 83 68 77 -6
our procedure involves standardizing and integrating different ele-
Competition 89 92 91 +2
ments that impact the performance of the defense industrial base
and the overall business environment. Industrial Security 57 56 56 -1
Like Vital Signs 2020, Vital Signs 2021’s final grade for the health Political & Regulatory 82 76 72 -10
and readiness of the defense industrial base is a “C.” While passing, Productive Capacity &
54 81 66 +12
the “C” grade reflects a business environment that is characterized Surge Readiness
by contrasting areas of concern and confidence. It also reflects Overall Health and Readiness 73 75 74 +1
the state in which the defense industrial base entered the novel
Figure 0.1, Source: NDIA
coronavirus (COVID-19) pandemic, which dramatically disrupted
Factor Score Key
the daily lives of every American as well as the flow of American
and global commerce. Continued deterioration in industrial secu- -6 and worse -1 – -5 0 +1 – +5 +6 and better
rity and the availability of skilled labor and materials emerged from
the analysis as areas of clear concern. Favorable conditions for AREAS OF CONCERN
competition in the defense contracting market and a rising pre-
Vital Signs 2021 reveals a defense industrial base that entered
pandemic demand for defense goods and services reflect growth
the COVID-19 pandemic in a weakened state. The final grades are
in the defense budget. NDIA intends Vital Signs 2021 to be a ref-
based solely on data from before the COVID-19 pandemic. Six
erence document that sets the conditions for an annual discussion
conditions earned composite scores lower than 80, three of which
on DIB issues and contributes to the debate about national defense
earned scores lower than 70, which we consider failing grades—the
acquisition strategy by offering a common set of indicators—“ Vital
same as in last year’s report. These scores suggest that the defense
Signs”—of the defense industrial base partners that give our men
industrial base is increasingly struggling to meet the unprecedented
and women in uniform an advantage in all warfare domains.
challenges it faces. Industrial security scored the lowest among the
eight conditions with a 56 for 2020. Industrial security has gained
SCORE DETERMINATION prominence as massive data breaches and brazen acts of eco-
nomic espionage by state and non-state actors plagued defense
In order to complete Vital Signs 2021, we conducted a study of data
contractors and the entire U.S. economy in recent years. To assess
related to eight conditions that shape the performance of defense
industrial security conditions, we analyzed indicators of threats to
contractors: demand, production inputs, innovation, supply chain,
information security and to intellectual property (IP) rights. The score
1 Department of Defense, “Assessing and Strengthening the Manufacturing and Defense Industrial Base and Supply Chain Resiliency of the United States,” Report to
President Donald J. Trump by the Interagency Task Force in Fulfillment of Executive Order 13806, September 2018. https://media.defense.gov/2018/Oct/05/2002048904/-
1/-1/1/ASSESSING-AND-STRENGTHENING-THE-MANUFACTURING-AND%20 DEFENSE-INDUSTRIAL-BASE-AND-SUPPLY-CHAIN-RESILIENCY.PDF
5
NDIA VITAL SIGNS 2021

incorporates MITRE’s annual average of the threat severity of new                 Acquisition reform and budget stability, two of NDIA’s strate-
cyber vulnerabilities, which improved slightly from our 2018 score            gic priorities, continue to be top of mind for the defense industrial
of 17 to a similarly dismal score of 18 in 2020. In contrast, threats         base. In our Vital Signs Survey, when asked about the most import-
to IP rights scored an all-time high of 89 for 2020 as the number of          ant thing that the government can do to help the defense industrial
new Federal Bureau of Investigation (FBI) investigations into IP rights       base, respondents said that streamlining the acquisition process
violations declined to 47 as part of a steady decline since reaching          (35.3%) and budget stability (31.7%) were the most important. When
an all-time high of 235 in 2011. Defense industry production inputs           asked what conditions would limit their firms’ willingness or ability to
also scored poorly in 2020 with a score of 68, a steady score since           devote larger amounts of productive capacity to military production,
2018. Major production inputs include the skilled labor, interme-             47.8% of our respondents said that uncertain prospects of continu-
diate goods and services, and raw materials used to manufacture               ing volumes of business were a moderate deterrent while 41.5% of
or develop end-products and services for DoD consumption. Our                 respondents said that the burden of government paperwork was a
estimate of the size of the defense industry workforce, currently             moderate deterrent. Both findings underscore the continued impor-
about 1.1 million people, falls substantially below its mid-1980s peak        tance of reforming and streamlining the acquisition process and of
size of 3.2 million. The indicators for security clearance process-           the need for budget stability.
ing also contributed to the low overall score for production inputs

                                                                              CAN THE DEFENSE INDUSTRIAL
as on-boarding backlogs continue to persist.

                                                                              BASE MEET SURGE DEMAND
AREAS OF CONFIDENCE                                                           DURING A CRISIS?
The competitive environment and the state of demand for defense
                                                                              The capacity of the defense industrial base to grow its output and
goods and services are areas of confidence. Over the past few
                                                                              fulfill a surge in military demand stands as a key test of its health
years, DoD has averaged about 701,000 prime contracts each year
                                                                              and readiness. Productive capacity and surge readiness earned a
and had over $394 billion in prime contract obligations in 2019,
                                                                              score of 66 for 2020, a 15-point decrease since 2019. Declines in
according to an analysis conducted by our research partner, Govini,
                                                                              output efficiency contributed to this downward trend. Importantly,
a decision science company. An analysis of the top 100 publicly
                                                                              this score is not based upon an economy undergoing a full mobili-
traded DoD contractors produced a competition score of 91 for
                                                                              zation to war like in World War II. Instead, the productive capacity
2020. Several high-scoring indicators drove the strength of market
                                                                              and surge readiness condition is baselined against the defense
competition conditions, including the low level of market concen-
                                                                              buildup that began under the Carter Administration and that accel-
tration of total contract award dollars, the relatively low share of
                                                                              erated throughout the Reagan Administration. The Carter-Reagan
total contract award dollars received by foreign contractors, and
                                                                              buildup involved a 31% surge in DoD expenditures.
the high level of capital expenditures in the defense industrial base.
                                                                                   The health and readiness of the defense industrial base pose a
Additionally, the defense industrial base earned a score of 77 for
                                                                              challenge to the defense acquisitions community. With the growing
profitability for 2020 based on a new methodology for this edition
                                                                              expectation for the defense industrial base to meet the challenges
of our annual report. Demand for defense goods and services
                                                                              faced during an era of great-power competition, Vital Signs 2021
received a score of 93 for 2020, which is a 16-point increase over
                                                                              highlights several hurdles that the DIB must overcome when emerg-
the 2018 score. This high score for demand is a result of the recent
                                                                              ing from the COVID-19 pandemic. The overall defense industrial
increase in contract obligations issued by DoD. Total contract obli-
                                                                              base’s health and readiness grade of “C” suggests a satisfac-
gations issued by DoD grew from $329 billion in Fiscal Year (FY)
                                                                              tory ability to meet current industrial requirements. We hope that
2017 to $394 billion in FY19, marking a 20% increase. Foreign mili-
                                                                              Vital Signs 2021 will help to inform the discussion that leads to an
tary sales (FMS) also grew by nearly 20% over the same time period.
                                                                              improved overall grade for Vital Signs 2022 and beyond.

OTHER TAKEAWAYS
Innovation conditions within the defense industrial base received a
score of 71 for 2020, two points down from its 2018 score. Notably,
the U.S. share of global investment in research and development
(R&D) was only 28%, which is down from a peak of 38% in 2001.
    Scores also dropped for political and regulatory conditions.
In early 2020 before the pandemic took hold, the percentage of
Americans that thought the United States was spending “too little”
on national defense was nearly half as many as in 2018, the largest
two-year drop since 1983, which may indicate a decrease in the
American public’s appetite for major increases in defense spending.

                                                                          6
NDIA VITAL SIGNS 2021

INTRODUCTION
President George Washington’s farewell address famously warned                            conditions, providing an integrated measure of the health and read-
against “the necessity of those overgrown military establishments.”2                      iness of the U.S. defense industrial base to meet the demands of
Yet, he also praised the importance of being prepared in his first                        the National Defense Strategy (NDS) and the needs of our service-
annual address to Congress, saying that “providing for the common                         men and women in uniform. Given that this synoptic indicator brings
defense will merit particular regard. To be prepared for war is one of                    together data on multiple sets of factors affecting the defense indus-
the most effectual means of preserving peace.”3 Since our begin-                          try, it facilitates a common, holistic understanding of the state of the
ning, the defense industrial base has provided the United States                          defense industrial base and its “Vital Signs.” This annual report is
with a strategic advantage. America’s success on the battlefield                          the defense industrial base’s yearly health check-up; accordingly,
and ability to deter conflict have always relied upon deliberate plan-                    it aims to encourage conversations at all levels about how to adjust
ning between government policymakers and industry.                                        policies and make investments that maintain the superior readi-
    Despite the vital and historical role of the defense industrial                       ness of the American defense industrial base while providing the
base in supporting America’s armed forces during wartime, U.S.                            advantages our nation and its warfighters have come to expect.
defense policy has not always recognized that vital role. For exam-

                                                                                          WHAT IS THE DEFENSE
ple, congressional panels on the defense industrial base convened
by the House Armed Services Committee in 1980, 1992, and 2011
called attention to U.S. defense policy’s persistent neglect of the                       INDUSTRIAL BASE?
defense industrial base and the potential tactical and strategic                          The U.S. defense industrial base partners with the Department of
ramifications for the nation in a conflict against a near-peer adver-                     Defense to ensure that the United States enjoys decisive advan-
sary.4 In 2017, Executive Order 13806 identified important structural                     tages in any conflict. The defense industrial base encompasses
changes to the U.S. manufacturing sector that “raise[d] concerns                          manufacturers, systems integrators, service providers, technology
about the health of the manufacturing and defense industrial base”                        innovators, labs and research organizations, and other suppliers
and called for a “comprehensive evaluation” to help guide future                          linked to one another by contracts into regional, national, and global
remedial policy actions.5 As the executive order suggests, a key                          supply chains to provide America’s warfighters with superior tools,
obstacle to a sound defense industrial base strategy is a common                          capabilities, and resources.6 The defense industrial base includes
baseline understanding of the overall health and readiness of the                         more than just the producers of major capabilities vital for national
defense industrial base.                                                                  defense. In recent years, the U.S. domestic defense industrial base
    Despite the 13806 Report’s high-resolution snapshot of the                            has declined in size despite growing demand for its output. DoD
challenges that face the defense industrial base, it failed to provide                    is the largest contracting agency in the federal government. Total
the public and the defense policy community either an unclassified                        contract obligations issued by DoD grew from $329 billion in 2017
summary measurement of the health and readiness of the defense                            to $394 billion in 2019—a 20% increase.
industrial base or a simple way of tracking such a measurement                                Defense supply chains touch every state in the Union. According
over time. The National Defense Industrial Association, in partner-                       to data from DoD’s Office of Economic Adjustment, defense contract
ship with Govini, has completed a second annual, months-long                              spending in FY18 averaged over $7 billion per state and in the District
assessment of the health and readiness of the defense industrial                          of Columbia, although spending levels varied widely.7 For example,
base to address this gap. By analyzing select statistical indicators,                     California received the most of all states with $42 billion in defense
NDIA developed a composite indicator consisting of a set of eight                         contract spending while Wyoming received the least of all states

2   Washington, George, “Farewell Address,” Transcript of remarks as delivered, 1796, The National Archives, OurDocuments.gov, https://www.ourdocuments.gov/doc.
    php?flash=false&doc=15&page=transcript
3   Washington, George, “Farewell Address,” January 08, 1790 , University of California at Santa Barbara, https://www.presidency.ucsb.edu/documents/first-annual-
    address-congress-0
4   United States House Committee on Armed Services. (1980). The ailing defense industrial base: unready for crisis. Report of the Defense Industrial Base Panel of the
    Committee on Armed Services, House of Representatives. Ninety-sixth Congress, Second Session. Washington: U.S. G.P.O.; United States House Committee on
    Armed Services. (1992). “Defense industrial base: hearings before the Structure of U.S. Defense Industrial Base Panel of the Committee on Armed Services,” House
    of Representatives, One Hundred Second Congress. Washington: U.S. G.P.O.; United States House Committee on Armed Services. (2012). “The defense industrial
    base: a national security imperative: hearing before the Panel on Business Challenges within the Defense Industry of the Committee on Armed Services,” House of
    Representatives
5   Trump, President Donald J., “Presidential Executive Order on Assessing and Strengthening the Manufacturing and Defense Industrial Base and Supply
    Chain Resiliency of the United States,” July 21, 2017; Available at: https://www.whitehouse.gov/presidential-actions/ presidential-executive-order-assessing-
    strengthening-manufacturing-defense-industrial-base-supply-chain-resiliency-united-states/
6   Definitions of the “defense industrial base” vary in their inclusiveness. We adopt a broad definition of the defense industrial base in recognition of the growing size,
    diversity, and complexity of the supply networks that support America’s warfighters.
7   U.S. Department of Defense, Office of Economic Adjustment Defense Spending by State - Fiscal Year 2018 https://www.oea.gov/dsbs-fy2018

                                                                                      7
NDIA VITAL SIGNS 2021

    New Vendors By Place of Performance, FY19
            DAFAs   Army   Air Force   Navy

Figure 0.2, Source: Govini

with $154 million.8 The concentration of defense contract spending
                                                                            THE EVOLVING DEFENSE
                                                                            INDUSTRIAL BASE: FROM THE
in major metropolitan areas supports clusters of defense industry
production, investment, and employment. The metropolitan areas
of Washington-Baltimore, Dallas-Fort Worth, San Diego, Seattle, St.         COLD WAR TO TODAY
Louis, Los Angeles, Huntsville, and Boston host the country’s larg-         The 2018 National Defense Strategy’s declaration of the re-emer-
est defense contracting clusters.9 Historically, defense procurement        gence of an era of great-power competition has held significant
has followed a decadal cyclical pattern, driven by events and policy        implications for the defense industrial base. The NDS called for
changes.10 The breakout of major military conflicts has prompted            reforms to defense acquisition systems to ensure the prompt
defense spending peaks with a typical concentration in the high-vol-        delivery of important capabilities, services, and materials to U.S.
ume procurement of major defense acquisition programs (MDAPs).              warfighters in step with the changing strategic environment.
Spending troughs have followed such peaks when military conflicts           This era of great-power competition presents the challenge of a
and tensions have deescalated, driving industry consolidation. For          multi-domain competition with near-peer competitors, specifically
the U.S. defense industrial base, these cyclical changes reflect the        China and Russia. Achieving decisive national advantages across
challenges defense contractors have when maintaining thriving com-          emerging technologies—artificial intelligence, hypersonic aviation,
panies while also making critical investments in future capabilities.       quantum computing, autonomy, and human-machine teaming sys-
The globalization and internationalization of supply chains have only       tems, among others—will have significant implications for the future
served to exacerbate those challenges.                                      of economic and strategic balances of power. This new era also
                                                                            challenges industry to achieve high levels of readiness to rapidly

8     Id.
9     Id.
10 Watts, Barry D. The US defense industrial base: Past, present, and future. CENTER FOR STRATEGIC AND BUDGETARY ASSESSMENTS WASHINGTON DC, 2008.

                                                                        8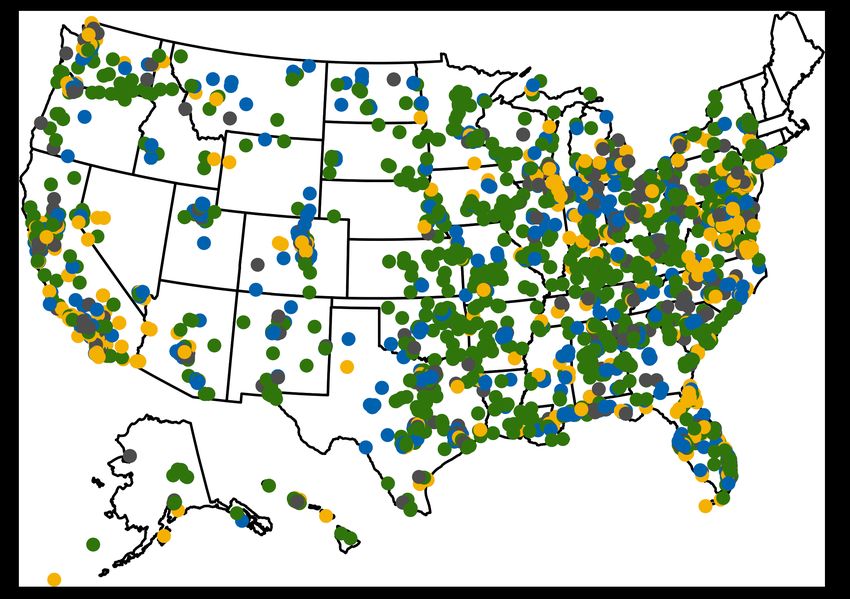
NDIA VITAL SIGNS 2021

grow the production and deployment of military hardware during                     relative positions. Statistical indicators also provide a structured
a conflict against a near-peer competitor. Nevertheless, trends                    and longitudinal way of understanding the relative performance
from previous eras will continue to affect the defense industrial                  of the defense industrial base. The complexity and scale of the
base. Consolidation among prime contractors can be expected to                     defense industrial base mean that an array of statistical indicators
continue as risks of budget instability and the pressure to deliver                may be useful for performance analysis and interpretation. The
favorable quarterly returns lead companies to seek synergies with                  conditions simplify the challenge of interpreting multiple statistical
other firms. The pressure to reduce costs and exploit international                indicators by combining and integrating various statistical indica-
talent will encourage a more comprehensive globalization of supply                 tors into “a single index on the basis of an underlying model.”14 As
chains. Growing dangers to industrial security from cybersecurity                  a result, they offer a better value for capturing multi-dimensional
threats and traditional economic espionage will require defense                    concepts, like the health of the defense industrial base, for which
contractors to implement new and often costly security procedures                  single indicators prove inadequate as means of measurement. By
and systems. Such dynamic and uncertain business conditions of                     tracking changes over time, our conditions make modeling and
this emerging era will undoubtedly bring changes to both the orga-                 other forms of advanced statistical values easier to analyze. Beyond
nization and behavior of the defense industrial base.                              their analytical benefits, they facilitate more inclusive and broader
                                                                                   communication with the public.

UNDERSTANDING THE HEALTH OF                                                            Descriptions of each of the eight conditions follow. The remain-
                                                                                   der of Vital Signs 2021 presents the overall composite index score
THE DEFENSE INDUSTRIAL BASE                                                        and the underlying analysis for each condition.
Despite the defense industrial base’s importance to America’s
national security and ability to achieve policy goals, many assess-                Demand
ments of national defense capacities, capabilities, and needs lack                 The scale of defense contracting opportunities available to firms
a broad consideration of the strengths and weaknesses of the                       shapes the defense industrial base’s health. The stability of this
defense industrial base. The FY17 Annual Industrial Capabilities                   demand affects the ability of companies to commit to and plan for
Report, authored by the Office of the Under Secretary of Defense                   defense-related production and their investment in research and
for Acquisition & Sustainment, focused on cataloging defense-related               development. This section of the report shows trends in aggregate
private manufacturing capabilities.11 Separately, the 2018 report enti-            defense procurement and the distribution of contracting awards
tled “Assessing and Strengthening the Manufacturing and Defense                    among different product categories.
Industrial Base and Supply Chain Resiliency of the United States,”
initiated by Executive Order 13806, highlighted emergent risks to
                                                                                   Production Inputs
industrial capabilities in various defense sub-sectors and weapons
                                                                                   The cost and availability of the inputs used in the production of
systems categories.12 Influential non-governmental analyses like the
                                                                                   goods and services also shape the performance of the defense
Center for Strategic and International Studies’ annual “Acquisition
                                                                                   industrial base. Defense industry production relies heavily on inter-
Trends” reports tend to address the defense industrial base health
                                                                                   mediate goods and services, highly skilled labor, and raw materials.
question from the perspective of trends in demand-side defense
                                                                                   Trends in the cost and availability of these resources shed light on
contracting flows.13 Although these studies provide valuable insights
                                                                                   the ability of defense contractors to acquire the inputs necessary
into specific aspects of the health of the defense industrial base, they
                                                                                   for production.
lack the breadth necessary to develop a holistic understanding of the
position of the defense industrial base with respect to peak perfor-
mance standards. To understand the current business environment                    Innovation
of the defense industrial base in empirical terms, NDIA has developed              For decades, the U.S. National Defense Strategy has looked to the
a set of eight conditions based on a diverse array of select statistical           defense industrial base as an important source of technological
indicators. If the report is a health exam, then our eight conditions              innovation. The manufacturing and services industries associated
are the four traditional vital signs that physicians use to assess the             with the most technology-intensive goods and services acquired
status of their patients’ life-sustaining functions (temperature, pulse,           by DoD are the source of significant amounts of capital for research
respiratory rate, and blood pressure).                                             and development. Trends in industrial R&D investment and patent
     In general, statistical indicators provide summary representa-                activity help form a picture of the state of private sector defense
tions of statistical data and typically reveal directional trends or               innovation.

11 Assessing and Strengthening the Manufacturing and Defense Industrial Base and Supply Chain Resiliency of the United States Report to President Donald J. Trump
   by the Interagency Task Force in Fulfillment of Executive Order 13806. September 2018.https://media.defense.gov/2018/Oct/05/2002048904/-1/-1/1/ASSESSING-
   AND-STRENGTHENING-THE-MANUFACTURING-AND%20DEFENSE-INDUSTRIAL-BASE-AND-SUPPLY-CHAIN-RESILIENCY.PDF
12 Id.
13 Defense Acquisition Trends 2020: Topline DoD Trends, October 2020. https://www.csis.org/analysis/defense-acquisition-trends-2020-topline-dod-trends
14 OECD, “The OECD-JRC Handbook on Practices for Developing Composite Indicators”, paper presented at the OECD Committee on Statistics, 7-8 June 2004,
   OECD, Paris. Available at: https://www. oecd.org/els/soc/handbookonconstructingcompositeindicatorsmethodologyanduserguide.htm

                                                                               9
NDIA VITAL SIGNS 2021
DEMAND COMPETITION
• DoD procurement volume • Industry financial performance
• International demand and foreign • Structure of inter-firm competition
military sales • Entrepreneurship environment
PRODUCTION INPUTS
• Workforce supply, costs, skills,
THE HEALTH INDUSTRIAL SECURITY
• Cyber threats
•
and diversity
Raw and intermediate materials
AND • Intellectual property rights threats
costs READINESS
OF THE POLITICAL & REGULATORY
• Public opinion polling on national
INNOVATION
• DoD innovation acquisition volume
DEFENSE defense
• Defense-related budgetary activity
• Innovation productivity INDUSTRIAL • Regulatory case activity
• Innovation investment
BASE
PRODUCTIVE CAPACITY &
SUPPLY CHAIN SURGE READINESS
• Contract fulfillment • Output efficiency
• Inventory capacity • Capacity utilization
• Performance speed • Industrial surge capacity of key
• Schedule delays supplier industries
Figure 0.3, Source: NDIA
Supply Chain on publicly available Securities and Exchange Commission (SEC)
filings from the top 100 publicly traded recipients of defense con-
The performance of the corporate supply chains that support indus-
tracts to complete our analysis.
try’s supplier networks factors into assessments of the health of
the defense industrial base. Defense supplier networks rely on
well-functioning relationships among companies to deliver prod- Industrial Security
ucts and services to fulfill their government contracts. The overall The security of industrial operations against threats to information
competency of these networks comes from the combination of systems and intellectual property rights contributes to a com-
their track record of contract delivery, product flow, and speed of prehensive portrait of the health of the defense industrial base.
operation. This section of the report studies trends in industry’s American industry faces persistent, increasing threats of intellec-
contract performance failures, inventory assets, program sched- tual property theft, economic espionage, cyber crime, and other
ule integrity, and speed of operation. forms of attacks. This section of the report examines new FBI intel-
lectual property rights violation investigations, the average annual
Competition newly reported common IT cyber vulnerabilities, and the severity
of newly reported common IT vulnerabilities.
The state of competition between firms exerts a powerful influence
on the productive performance of firms within industry. Many firms
of varying sizes, product and service specializations, and even Political & Regulatory
national origin compete for the same contracts within the defense More than most industries, legislative and regulatory processes
industrial base. While such competition occurs, trends in finan- have a direct impact on defense industry productivity. The pub-
cial performance indicate the financial health of the involved firms. lic’s attitudes toward defense spending shape congressional
The competition between firms for contracts results in patterns of interest in defense acquisition, ultimately affecting congressional
market concentration that illustrate the extent to which relatively budgets. The time that Congress takes to authorize a budget for
few firms dominate defense contracting dollars. The entry of firms national defense programs affects capital availability and the prod-
into defense contracting provides insight into the openness of the uct delivery schedule of defense supply chains. Similarly, changes
defense contracting market to new sources of competition. This to defense acquisition regulations affect defense contractors’ eligi-
section of the report informs our understanding of the health of bility and administrative costs. In this way, policymakers can have a
competitive dynamics within the defense industrial base. We relied s ignificant impact on the defense industry in terms of the demand
10NDIA VITAL SIGNS 2021
for goods and services, availability of inputs, conditions in related performance given available data) or, when conceptually appropri-
and supporting industries, and structure of industry competition. ate, ideal standards. As a result, baseline values are chosen on a
This section of the report assesses political and regulatory trends case-by-case basis, further depending on data availability. For each
that shape defense industrial productivity. indicator, we provide an analysis that incorporates the influence
of contemporary contextual events and forces that drive the indi-
Productive Capacity & Surge Readiness cator’s performance. In each section of Vital Signs 2021, graphics
depicting the recent trend in the scores accentuate the discus-
The need for an increase in defense production often appears
sion of variables and indicators. Each section also includes a table
s uddenly, leaving little time for defense suppliers to ramp up
detailing the current scores for each variable and indicator in addi-
p roduction to fulfill a surge in demand for their goods, services,
tion to their net change over the two previous years. The indicators
or materials. Meeting surge demand requires leveraging the latent
that form the basis of our analysis were constructed from multiple
excess productive industrial capacity in the national economy. In
data sources. Furthermore, we developed many indicators from
manufacturing industries, firms must activate unused industrial cap-
public data sources. Our financial indicators are based on publicly
ital assets to reach necessary levels of productivity. However, the
available SEC filings that were obtained through FTSE Russell’s
complex structure of industrial supply chains means that the flows of
Mergent Online database. Several indicators, including those pre-
goods and services between industries will limit the extent to which
sented within the section on demand conditions, are derived from
an increase in demand for industrial end-products translates into
custom data provided by our research partner, Govini. Some indi-
an increase in industrial output. This section analyzes the output
cators are based on estimates generated by NDIA. We reference
efficiency and the capacity utilization of the economy.
indicator data sources throughout the report.
Survey Results
For Vital Signs 2021, NDIA fielded a 42-question survey to our FOR THE FUTURE
members. This year’s survey focused on questions that will be rel- Vital Signs 2021: The Health and Readiness of the Defense Industrial
evant every year (i.e. related to the DIB’s capacity to surge) and Base is the second installment of Vital Signs. This report makes con-
questions that are relevant to this year (i.e. related to the impacts clusions on the overall health and readiness of the defense industrial
of COVID-19). The survey results are used throughout Vital Signs base. We purposely do not make any policy recommendations, sup-
2021 while key results are presented in a single, dedicated s ection port any specific legislative or regulatory changes, or advocate for any
of the report. Though this year’s survey was the first of its kind, targeted investments. Our goal is to provide a baseline reference for
we intend to field this survey every year to track results over time. the defense policy community and the citizens interested in defense
policy. We believe an unclassified report, like this one, will serve as
HOW TO READ THIS REPORT an important annual touchpoint at the beginning of the policy cycle
by providing trend analyses that demonstrate the results of changes
In the succeeding sections of this report, we present composite in the strategic environment, economy, policies, and investments
scores for each of the defense industrial base conditions described while ensuring a discussion of industrial base issues at the national
herein. Our scores follow a nested approach, combining quantitative level. In this way, we will be able to identify what actions or deci-
scores for each condition’s factors and indicators into an overall sions were successful and which ones were not. It will then be up
health score on a 0-to-100 scale. The score for each set of condi- to various stakeholders, organizations, and policymakers to inter-
tions is itself a composite of scores for variables that contribute to pret and advocate for policies they believe are in the best interest of
health and readiness in that area. To score each variable, we ana- the defense industrial base and our national security posture. The
lyzed statistical indicators that serve as empirical proxies. Indicator National Defense Industrial Association looks forward to feedback
scores are calculated by comparing a three-year average of the indi- from across the spectrum of thought leaders on our study model,
cator to a baseline value. Baseline values are either historical peak its methods and measures, and ways of ensuring its usefulness to
values (a prior value of the indicator that represents the best recent the defense policy community.
11NDIA VITAL SIGNS 2021
DEMAND
Change, 2018 – 2020
+16
Overall, the demand for defense goods and services has
DEMAND SCORES improved despite recent DoD budget adjustments driven by the
Change, 2019 Bipartisan Budget Act. Acknowledgment of the possible lim-
Overall Factor 2020
2018 – 2020
itations to defense spending has resulted in the reprioritization of
Demand 93 +16 resources and the shifting of investments to prepare for, deter, and
Overall Demand Score 93 +16 win a high-end fight against a near-peer competitor in order to main-
tain alignment with the National Defense Strategy.
Figure 1.1, Source: Govini
Before the COVID-19 pandemic, the combined demand signal
Factor Score Key
on the defense industrial base—in terms of foreign military sales
-6 and worse -1 – -5 0 +1 – +5 +6 and better and direct commercial sales—was strong. Even now, the U.S.
defense industrial base remains the global supplier of choice for
OVERVIEW
defense goods and services. Besides the geopolitical benefits like
interoperability and influence, sales to foreign customers provide
The scale of defense contracting opportunities available to firms the defense industrial base with greater economies of scale and
shapes the defense industrial base’s health. The stability of this additional resources to invest in new capabilities.
demand affects the ability of companies to commit to and plan for
defense-related production and their investment in research and
development. This section of the report shows trends in aggregate
Demand for industrial output has improved
defense procurement and the distribution of contracting awards
despite recent DoD budget adjustments driven by
among different product categories. the 2019 Bipartisan Budget Act.
Likewise, it presents an analysis of the major trends in DoD’s
contract demand and its impact on industry while offering scores
for the demand for defense goods and services. The Department
of Defense’s demand for defense goods and services drives indus- KEY TAKEAWAYS
try’s production and investment in the defense industrial base. As • Overall DoD contract obligation volume has surged
recent history has shown, changes in the volume and composi-
• Among all categories, major defense platforms (aircraft, ships/
tion of DoD purchases impact which firms choose to participate
submarines, and land vehicles) were awarded the largest share
in the defense industrial base, what goods and services they pro-
of total contract obligation value
duce, and their role in supply chains.
As the nation’s sole buyer of defense goods and services, and • Growth in total contract obligation value for electronics & com-
as the largest buyer in the world, DoD’s annual level of contract obli- munication services (89%) led all service categories while
gations provides the best view into the demand for defense goods growth in total contract obligation value for sustainment (79%)
and services. The defense industry relies on stable defense bud- led all product categories
gets, which drive stable demand signals, to justify investments in • Combined foreign military sales for knowledge-based services
the productive capacity required to fulfill contracts and to make the (35.33%) and equipment-based services (30.95%) consti-
investments required to compete for future awards. Large down- tuted two-thirds of awarded service obligations between FY15
ward budget fluctuations, like across-the-board budget cuts, could and FY19
deter potential new entrants from participating in defense mar-
• Foreign military sales for aircraft, ships/submarines, and land
kets and, thereby, slow down the defense modernization process.
vehicles amounted to 48% of awarded product obligations
between FY15 and FY19
12NDIA VITAL SIGNS 2021
DEMAND SCORES
Factor Indicator 2020 Change, 2018 – 2020
Demand Department of Defense Contract Obligations 93 +16
Overall Demand Score 93 +16
Figure 1.2, Source: Govini
Factor Score Key -6 and worse -1 – -5 0 +1 – +5 +6 and better
INTRODUCTION DEPARTMENT OF DEFENSE
The Department of Defense’s demand for defense goods and ser- CONTRACT OBLIGATIONS
vices powers production and investment in the defense industrial
Department of Defense Contract Obligations
base. As recent history has shown, changes in the volume and
composition of DoD’s purchasing of goods and services drive cor- Department of Defense Contract Obligations
responding changes in firms’ participation in the defense industrial 100 93
base, what they produce, and their role in supply chains. This sec- 85
tion of Vital Signs 2021 presents an analysis of major trends in DoD’s 77
contract demand and its impact on industry while offering scores for 75
indicators of government demand for defense goods and services.
METHODOLOGY 50
Indicator scores are determined by the ratio of an indicator’s aver-
age value to a baseline value. Baseline values reflect historical peak 25
values or ideal standard values, which means that they are unique
for each indicator. Ultimately, the availability of data in the public
domain constrained the selection of baseline values. The overall 0
section score averages variable scores that consist of averages 2018 2019 2020
of indicator scores, which are capped at 100 to allow for a 0-to-
Figure 1.3, Source: NDIA
100 scoring scale.
Overall, the annual total amount of DoD contract obligations DoD’s contract obligation volume scored a 93 for 2020, trend-
serves as the main indicator of demand. This indicator combines ing upward by 16 points over the 2018 score of 77. This score is
the total value of new DoD procurement contract awards; research, based on the rise of DoD contract obligations to $394.7 billion in
development, testing, and evaluation (RDT&E) contracts; and FMS FY19—which is an increase of $65.4 billion over FY17.
contracts. This analysis was provided by Govini, our research part- As the nation’s sole buyer of defense goods and services, and
ner, who calculated total contract obligation values based on a as the largest buyer in the world, the Department of Defense and
custom federal contracting dataset. its annual total of contract obligations provide the best indication of
the demand for defense goods and services. Contract awards drive
production activity throughout industry as the defense industrial
base relies on consistent demand from DoD to justify investments
in the productive capacity required to fulfill contracts and compete
for future awards. Due to a limited amount of data available from the
Carter-Reagan buildup era, annual DoD contract obligations were
scored against 2008’s baseline value of $392.6 billion—the highest
peak in contract obligation volume within our dataset.
DoD’s recent budget limitation has not affected its increas-
ing contract obligation volume. In fact, DoD’s budget authority
increased over five consecutive fiscal years—FY16 to FY20—from
$596 billion to $713 billion in current dollars and including Overseas
Contingency Operations funding.1 However, DoD’s contract obliga-
tions sharply increased from $306.7 billion in FY16 to $394.7 billion
in FY19. We expect budget levels to likely flatten over the next few
1 Office of the Undersecretary of Defense (Comptroller)/Chief Financial Officer, “Defense Budget Overview” May 2020. https://comptroller.defense.gov/Portals/45/
Documents/defbudget/fy2021/fy2021_Budget_Request_Overview_Book.pdf
13NDIA VITAL SIGNS 2021
DoD Awards By Obligation Amount & Percentage of Total, By Level-One Category Management Group, FY15 – FY19
% of Total
Aircraft, Ships/Submarines, $272.B B 16.9%
& Land Vehicles
Facilities & Construction $200.5 B 11.9%
Professional Services $182.7 B 10.9%
Information Technology $153.9 B 9.1%
Sustainment S&E $143.3 B 8.5%
Research & Development $131.5 B 7.8%
Weapons & Ammunition $121.5 B 7.2%
Transportation & Logistics $114.8 B 6.8%
Services
Medical $102.4 B 6.1%
Equipment-Related $93.1 B 5.5%
Services
Electronic & $55.5 B 3.3%
Communication Equipment
Industrial Products & $37.8 B 2.3%
Services
Clothing, Textiles, & $22.0 B 1.3%
Subsistence S&E
Other $18.9 B 1.1%
Human Capital $13.4 B 0.8%
Travel & Lodging $7.7 B 0.5%
Office Management $4.9 B 0.3%
Security & Protection $4.5 B 0.3%
Miscellaneous S&E $1.7 B 0.1%
Electronic & $1.6 B 0.1%
Communication Services
$0 B $50 B $100 B $150 B $200 B $250 B $300 B
Awarded Amount
Figure 1.4, Source: Govini
years, affecting DoD’s purchasing power. As a result, defense con- the modernization of lethality, dominance across all domains,
tract obligations warrant close attention in the future.2 nuclear deterrence recapitalization, strengthened homeland missile
In its FY21 budget proposal, DoD addressed the spending limits defense, and the development of critical technologies.4 According
established in the Bipartisan Budget Act of 2019 as well as the to an analysis by Govini, the FY21 defense budget request reflected
tough choices the Department made to realign resources to sus- the necessary adjustments for those emphasized areas identified
tain and advance the recent gains in readiness and effectiveness.3 by the National Defense Strategy.
While DoD states that the sequestration-driven decline in military Among all categories, major defense platforms—aircraft, ships/
readiness has been overcome with past budgets, it acknowledges submarines, and land vehicles—were awarded the most total con-
that a high level of funding is not guaranteed in the future. tract obligations, valued at $272.6 billion. Although these platforms
From FY19 to FY20, DoD emphasized great-power compe- accounted for a combined 16% of total contract obligation awarded
tition and the prioritization of innovation and modernization to between FY15 and FY19, professional services and information
strengthen the U.S. competitive advantage across all warfighting technology spending outpaced aircraft, ships/submarines, and
domains. For FY21, DoD proposes strengthened military readiness, land vehicles with 20% of total contract obligation.
2 Rhys McCormick, “Defense Acquisition Trends 2020.” October 8, 2020. https://www.csis.org/analysis/defense-acquisition-trends-2020-topline-dod-trends
3 Office of the Undersecretary of Defense (Comptroller)/Chief Financial Officer, “Defense Budget Overview” May 2020. https://comptroller.defense.gov/Portals/45/
Documents/defbudget/fy2021/fy2021_Budget_Request_Overview_Book.pdf
4 Id.
14NDIA VITAL SIGNS 2021
Percent Change in Total Obligation Value, By Service Percent Change in Total Obligation Value, By Product
Category, FY15 – FY19 Category, FY15 – FY19
100% 79%
80%
89%
67% 67%
64%
80% 60%
45%
61%
60% 40%
21%
40% 20%
34% 34% 31%
26%
20% 0%
12%
Sustainment S&E
Electronic &
Comm. Equipment
Weapons &
Ammunition
Aircraft, Ships/
Submarines, &
Land Vehicles
Clothing, Textiles, &
Subsistence S&E
Industrial Products
& Services
10% -3%
Miscellaneous
S&E
0%
Electronic &
Comm. Services
Facilities &
Construction
Equipment-
Related Services
Professional
Services
Information
Technology
Research &
Development
Medical
Transportation &
Logistics Services
Figure 1.6, Source: Govini
Figure 1.5, Source: Govini Among product categories, sustainment (79%), electronic and
Among service contract categories, between FY15 and FY19, communication equipment (67%), weapons and ammunition (67%),
the largest increases occurred for electronics and communication and major defense platforms—aircraft, ships/submarines, and land
services (89%); facilities and construction (61%); and equipment-re- vehicles—(64%) gained the most in terms of total contract obliga-
lated services (34%). Professional services, which is the second tion value between FY15 and FY19. While clothing, textiles, and
largest service contract category, accounted for 18% of all ser- subsistence only hold 3.4% of all product contract obligation, their
vice contract obligation awards and received a 34% increase in category experienced a 45% increase in contract obligation value.
contract obligation value. At 10%, transportation and logistics ser- For FMS, two major service categories stood out. FMS involving
vices attracted the lowest increase in total contract obligation value knowledge-based services (35.3%) and equipment-related services
despite holding 11.4% of all service contract obligation. (30.9%) constituted two-thirds of contract obligation awards made
between FY15 and FY19. Meanwhile, FMS involving transportation
services and medical services were negligible, amounting to only
0.05% of contract obligation awards.
Foreign Military Sales Obligations & Percentage of Total, By Service Category, FY15 – FY19
% of Total
Knowledge-Based Services $12.5 B 35.3%
Equipment-Related Services $11.0 B 30.9%
Facility-Related Services $4.4 B 12.3%
Research & Development $3.4 B 9.6%
Logistics Management $2.7 B 7.7%
Services
Electronic & 1.2 B 3.3%
Communication Services
Construction Services $271.2 M 0.8%
Transportation Services $10.3 M 0.0%
Medical Services $7.0 M 0.0%
$0 B $2 B $4 B $6 B $8 B $10 B $12 B
Awarded Amount
Figure 1.7, Source: Govini
15You can also read