Strategic Plan 2020-2025 - AWS
←
→
Page content transcription
If your browser does not render page correctly, please read the page content below

Strategic Plan 2020-2025

STRATEGIC PLAN 2020-2025
              AND
ANNUAL PERFORMANCE PLAN 2020-2021

      INNOVATION
 FOR A BETTER FUTURE
FOREWORD

    On behalf of the National Advisory Council on Innovation (NACI), and in the context of
    policy reflection and renewal in South Africa, I am honoured to present NACI’s 2020-
    2021 Annual Performance Plan (APP). Government has been reviewing what it has
    achieved and not achieved since 1994, with the aim of guiding the enhancement of policy
    to address the persistent challenges of unemployment, inequality and poverty.

    The 2020-2025 Strategic Plan identifies strategic outcome-oriented goals to contribute to
    the realisation of the National Development Plan (Vision 2030) and the 2019 White Paper
    on Science Technology and Innovation (STI). Recently, the Council completed a review
    of the 1996 White Paper on Science and Technology, including a performance analysis
    of the national system of innovation (NSI) over a 20-year period, and submitted this as
    input into the draft new White Paper on STI. It also conducted foresight exercise whose
    outputs will inform the development of new decadal plan for STI. The Council continues
    to review the 2002 National Research and Development Strategy (NRDS) and Ten-Year
    Innovation Plan.

    NACI will continue to improve the quality, relevance and efficacy of its advice to the
    Minister of Higher Education, Science and Technology and, through the Minister, to the
    Cabinet. It generates advice proactively or at the behest of the Minister of Science and
    Technology. In thinking about advice, the Council recognises that it is important to focus
    on both the foundations of STI (disciplines or knowledge domains, infrastructure and
    human resources) and the role of STI in addressing the challenges of education, health,
    food security and global change in a sluggish economy. The Council sees access to good
    quality data, analytical capability, strong partnerships and healthy relationships with
    recipients of advice as critical. Some of NACI’s strengths include the ability to mobilise
    NSI stakeholders and access local and international experts to complement its limited
    resources.

    NACI will build on its previous efforts to strengthen planning, monitoring and evaluation
    capability in the national system of innovation (NSI). Working with partners, the Council
    will improve phase 1 and develop phase 2 of the National STI Information Portal, and will
    continue to develop a monitoring and evaluation framework and system for the NSI. The
    latter will take into consideration the new White Paper on STI, the new decadal plan, the
    reviews of the National Research and Development Strategy and Ten-Year Innovation
    Plan, and the foresight exercise.

    The Council values the importance of good corporate governance, communication and
    international engagement, and we are confident that NSI role players and South African
    citizens will benefit from the work NACI has planned for the 2020/21 financial year.

2
                         Strategic Plan 2020-2025 and Annual Performance Plan 2020-2021
ISANDULELO

Esikhundleni se National Advisory Council on Innovation (NACI), kanye nomongo
wenqubomgomo yokubuyekeza nokuvuselela eMzansi Afrikha, kuyintokozo kimina
ukunethulela i-Annual Performance Plan (APP) yeNACI yonyaka ka2020 kuya ku2021.
Uhulumeni ubelokhu ebuyekeza lokhu asekuzuzile nalokhu angakuzu-zanga kusuka
ngo-1994, ngenhloso yokuqondisa ukuthuthukiswa kwenqubomgo-mo ukubhekana
nezinqinamba eziphikelelayo zokungasebenzi, ukungalingani kanye nobubha.
Uhlelo lwamasu lonyaka ka2020 kuya ku2025 luveze imigomo egxile emiphumelweni
ukunikela kukuqonda kweNational Development Plan (umbono ka2030) kanye neWhite
paper on Science Technology and Innovation (STI) ka2019. Kamumva, umkhandlu
uqedele ukubuyekeza iWhite Paper on Science and Technology yonyaka ka1996,
kufakwa phakathi ukuhlaziywa komsebenzi weNational system of innovation ngaphezu
kwesikhathi seminyaka engu-20, wase uhambisa lokhu njengegalelo lombhalo omusha
weWhite Paper on STI. Ubuye wenza ukuvivinywa kokubona ngaphambili umphumelo
ozokwazisa ukuthuthukis-wa kwecebo leminyaka elishumi leSTI. Umkhandlu uyaqhubeka
ukubuyekeza iNa-tional Research and Development Strategy (NRDS) kanye neTen-Year
Innovation Plan.
INACI izoqhubeka nokuthuthukisa izinga, ukuhambisana kanye nokusebenza kahle
kwezeluleko zayo kunqonqoshe wesayensi nobuchwepheshe nangale kunqonqoshe
kuya kwiKhabinethi. Isungula izeluleko ezisebenzayo okanye kubuholi bukanqonqoshe
wesayensi nobuchwepheshe. Ngokucabanga ngezaluleko, umkhandlu ubone ukuthi
kubalulekile ukugxila esisekelweni seSTI (isizinda seziyalelo nolwazi, ingqalasizinda
kanye nezinsizakusebenza) kanye nendima yeSTI ekubhekeni izinqinamba zezemfundo,
ezempilo, ukuphepha kwezokudla kanye noshintsho emhlabeni jikelele emnothweni
ovilaphayo. Umkhandlu ubona ukufinyelela olwazini olusezingeni elihle, ukuhlaziywa
okunamandla, ukubambisana okuqinile, kanye nobudlelwane obunempilo nabamukeli
bezaluleko ezibalulekile. Amanye amandla eNACI afaka phakathi ikhono lokuhlanganisa
ababambiqhaza beNSI kanye nokufinyelela kochwepheshe bendawo nabasezweni
lonke ukuphelelisa imithombo yayo elinganisiwe.
INACI izokwakha emandleni ayo andlule okuqinisa ukuhlela, ukuqapha kanye nokuhlola
amandla kunational system of innovation (NSI). Ngokusebenzisana nabalingani,
umkhandlu uzothuthukisa isigaba sokuqala bese ukhulisa isigaba sesibili seNational STI
Information Portal, bese iqhubeka nokukhulisa uhlaka lokuqapha nokuhlola indlela
yokwenza yeNSI. Isakamuva sizobhekisisa iWhite Paper on STI entsha, icebo Elisha
leminyaka elishumi, ukubuyekezwa kwe Nation-al Research and Development Strategy
kanye neTen-Year Innovation Plan, kanye nesivivinyo sokubonela phambili.
Umkhandlu uyakwazisa ukubaluleka kokuphatha kukahulumeni okuhle, ukuxhumana
kanye nokuzimbandakanya kwamazwe omhlaba, kanti futhi siyaqinisekisa ukuthi
ababambe iqhaza kuNSI kanye nezakhamuzi zaseNingizimu Afrikha bazozuza
emsebenzini weNACI ewuhlelele unyaka wezimali ka2020/21.

                                                                                         3
                    Strategic Plan 2020-2025 and Annual Performance Plan 2020-2021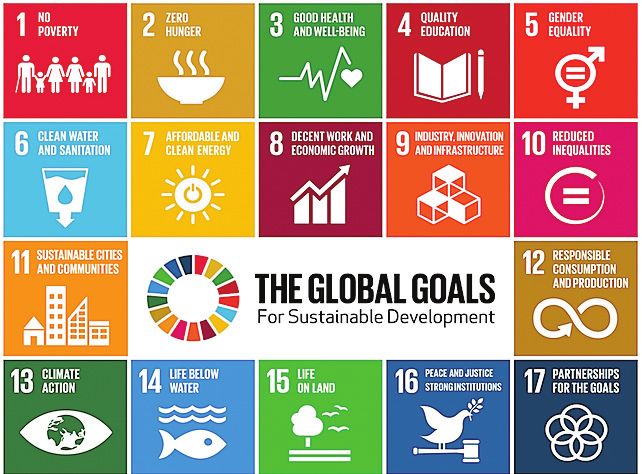
OFFICIAL SIGN-OFF

    It is hereby certified that this Annual Performance Plan (APP) was developed by the
    management of the National Advisory Council on Innovation (NACI) under the guidance
    of the Acting Chief Executive Officer of NACI; prepared in line with NACI’s 2020-2025
    Strategic Plan; and accurately reflects the performance targets which NACI will endeavour
    to achieve, given the resources made available in the budget for 2020/21.

    Dr Shadrack Moephuli

    Interim NACI Chairperson                                       ……
                                                                    ……………
                                                                       …………
                                                                        ……………
                                                                            … …..
                                                         Signature ……………………………..

    Ms Pretty Makukule

    Chief Financial Officer (DSI)                        Signature ……………………………..

    Dr Mlungisi Cele

    Acting CEO (NACI)                                              ……………
                                                                      …………
                                                                         …………
                                                                            ………
                                                                              ……..
                                                         Signature ……………………………..

    Dr Phil Mjwara                                       Signature………………………………

    Accounting Officer

    Approved by

    Minister Dr Blade Nzimande:

    Executive Authority                                  Signature ……………………………..

4
                          Strategic Plan 2020-2025 and Annual Performance Plan 2020-2021
TABLE OF CONTENTS

FOREWORD ................................................................................................................... 2

ISANDULELO ................................................................................................................. 3

OFFICIAL SIGN-OFF ...................................................................................................... 4

STRATEGIC PLAN ......................................................................................................... 6

PART A: OUR MANDATE............................................................................................... 7

1. Constitutional mandate .............................................................................................. 7

2. Legislative mandate................................................................................................... 7

3. Policy mandates ........................................................................................................ 6

4. Institutional policies and strategies governing the five-year planning period........... 10

5. Relevant court rulings .............................................................................................. 11

PART B: OUR STRATEGIC FOCUS ............................................................................ 12

6. Vision ....................................................................................................................... 12

7. Mission .................................................................................................................... 12

8. Values ...................................................................................................................... 12

9. Situational analysis .................................................................................................. 12

PART C: MEASURING OUR PERFORMANCE ........................................................... 60

10. Institutional performance information ...................................................................... 60

ANNUAL PERFORMANCE PLAN ............................................................................... 64

11. Annual performance plan ........................................................................................ 65

12. Resource considerations ......................................................................................... 80

LINKS TO OTHER PLANS ........................................................................................... 81

REFERENCES .............................................................................................................. 82

                                                                                                                                       5
                                Strategic Plan 2020-2025 and Annual Performance Plan 2020-2021
STRATEGIC
      PLAN
           2020-2025
6
     Strategic Plan 2020-2025 and Annual Performance Plan 2020-2021
PART A: OUR MANDATE

1. Constitutional mandate

There are no specific constitutional provisions for NACI.

2. Legislative mandate

The National Council on Innovation Act, 1997 (Act No. 55 of 1997), provides the mandate
for NACI (2015). The Act mandates NACI to advise the Minister for Higher Education,
Science and Technology and, through the Minister, Cabinet, on the role and contribution
of science, mathematics, innovation and technology, including indigenous technologies,
in promoting and achieving national objectives, namely, to improve and sustain the
quality of life of all South Africans, develop human resources for science and technology,
build the economy, and strengthen the country’s competitiveness in the international
arena.

3. Policy mandates

3.1 The relationship between the NDP and the National System of Innovation
    (NSI)

The 2011 National Development Plan (NDP) highlights the centrality of science,
technology and innovation (STI) in creating sustainable socio-economic development
and addressing societal challenges such as education, health, food security, water
scarcity and climate change. The difference between countries that are able to tackle
poverty effectively by growing and developing their economies, and those that cannot, is
the extent of their ability to grasp and apply insights from STI and use them creatively
(NDP, 2011).

The NDP acknowledges that economic development is a longer-term project and that
innovation should grow in importance over time. In the first phase (2012-2017), the focus
was to be on “intensifying research and development spending, emphasising opportunities
linked to existing industries”. In the second phase (2018-2023), the “country should lay
the foundations for more intensive improvements in productivity”, and “innovation across
state, business and social sectors should start to become pervasive”. As the country
approaches 2030, “the emphasis should be on consolidating the gains of the second
phase, with greater emphasis on innovation, improved productivity, more intensive pursuit

                                                                                             7
                     Strategic Plan 2020-2025 and Annual Performance Plan 2020-2021
of a knowledge economy and better utilisation of comparative and competitive advantages
    in an integrated continent”.

    The NDP is clear that achieving a competitive and sustainable economy will require a
    strong and effective national system of innovation (NSI), which must contribute to
    transformation. It views the NSI as the principal tool for creating new knowledge,
    applying knowledge in production processes, and disseminating knowledge through
    teaching and research collaboration. The NDP further acknowledges that advances in
    technological innovation and the production of new knowledge are critical to growth and
    development.

    Having identified the potential contribution of the NSI to socio-economic development,
    the NDP proposes two actions for the NSI. First, a common overarching framework
    should be created to address pressing challenges in the NSI (involving the higher and
    further education systems, state-owned enterprises and private industries). The NSI
    should function in a coordinated manner with objectives that are aligned to national
    priorities. Second, the size and effectiveness of the NSI should be increased.

    3.2 Medium-Term Strategic Framework (MTSF) 2020-2025

    During the State of the Nation on the 20 June 2019, President Ramaphosa said that
    within the next decade, South Africa would have made progress in tackling poverty,
    inequality and unemployment, where: (a) no person in South Africa will go hungry; (b) the
    economy will grow at a much faster rate than our population; (c) two million more young
    people will be in employment; (d) the schools will have better educational outcomes and
    every 10-year-old will be able to read for meaning; (e) violent crime will be halved.

    In pursuit of these goals, the President outlined seven priorities that will guide government
    over the next medium-term strategic framework (2020-25). These are:

       • Priority 1: Capable, Ethical and Developmental State

       • Priority 2: Economic Transformation and Job Creation

       • Priority 3: Education, Skills and Health

       • Priority 4: Consolidating the Social Wage through Reliable and Basic Services

       • Priority 5: Spatial Development, Human Settlements and Local Government

       • Priority 6: Social Cohesion and Safe Communities

       • Priority 7: A better Africa and World

8
                          Strategic Plan 2020-2025 and Annual Performance Plan 2020-2021
The achievement of these priorities will require improved coordination both vertical and
horizontal, alignment between various policies (including STI), leadership, resources
(human and financial), infrastructure and so forth. The key challenge will be to align the
implementation of MTSF with other policies including the National Development Plan
(NDP), the Re-imagined Industrial Strategy, the 2019 White Paper on STI and post-
school education policy.

3.3 Science technology and innovation policy mix

The post-apartheid STI policy (from the 1996 White Paper on Science and Technology to
the 2019 White paper on STI) serve as an instrument of transformation of the human
conditions in order to ensure that all South Africans enjoy freedom, social justice, equality,
peace, and sustainable shared prosperity and improved quality of life and well-being. To
this extent, the concepts of NSI and innovation were introduced and have become the
subject of much of discussion and reviews. Questions are raised about the existence,
coordination, resourcing and broader understanding and awareness of the NSI beyond
the Department of Science and Innovation and whether innovation has always been
understood as an all-encompassing of different elements including the non-technological.
Most importantly, the major weakness of the pre-1994 exclusionary and racialised science
and technology system and the NSI, is the persistent misalignment between the STI
policy and ‘needs of the majority’, the poor, working class and black women. This is the
fundamental issue that should feature prominently in the country’s STI agenda for the
next five-years or so. The 2019 White Paper on STI acknowledges the problem and
promotes the transformation, inclusion and coherence as important underlying principles
of the new STI agenda and ambition. Namely, that STI should contribute towards the
creation of the sustainable and inclusive socioeconomic development. To the extent that
the 2019 White Paper on STI put strong emphasis on the outcomes and impact of STI on
society, environment and economy.

The 2019 White Paper is premised on the view that the South Africa’s national system of
innovation is relatively productive considering the challenges (which include its size,
funding and governance, its racial, age and gender-skewed human resources, and its
bias towards technological innovation).

The 2019 White Paper also recognises that South Africa is part of a world in transition.
Some of the features of this transition include growing unemployment, inequality, poverty,
climate change, the hollowing of nation states through excessive contracting, a multipolar
distribution of power in the world, new wars, megacities, growing migration, the ongoing

                                                                                                 9
                      Strategic Plan 2020-2025 and Annual Performance Plan 2020-2021
effects of the 2008 global economic crisis (with another predicted in the near future), the
post-truth approach and the rise of chauvinistic nationalism. The Sustainable Development
Goals (SDG) are a global agreement to address these challenges.
In South Africa, particular challenges include the legacy of colonialism and apartheid
(including the land question), the burden of disease (such as HIV/Aids), youth
unemployment, a sluggish economy, the erosion of agricultural land, water scarcity, the
mismatch between education investments and outcomes.
4. Institutional policies and strategies governing the five-year
planning period
The 2019 White Paper on STI has number of implications for the system and its actors.
It proposes a number of actions in relation to NACI. Namely,
• NACI will be reconfigured to act as the national STI M&E institution, charged with
analysing STI information and undertaking work to inform government planning on
STI. NACI will convene a high-level forum to develop a framework of indicators to
monitor South Africa’s NSI performance.
• To support the Ministerial STI Structure in carrying out its mandate, government
recognises that, in addition to the STI Plenary discussed above, there is a need for
ongoing stakeholder engagement. NACI will be strengthened to facilitate such
engagement, for example, by following up on matters discussed at the STI Plenary.
Policy advice from relevant NSI institutions and think-tanks, for instance the Academy
of Science of South Africa (ASSAf), the HSRC and the Centres of Excellence, will
also be used.
• Furthermore, the Ministerial STI Structure will require expert studies and up-to-date
performance and environmental information to support its decisions. To advise the
Ministerial STI Structure, a strengthened NACI will undertake such studies.
• Implement knowledge management systems to enhance the analysis of NSI
performance and support evaluation work that informs strategies. In this, NACI will
draw on the work of existing specialist centres that collect STI-related information.
Existing institutional arrangements for data collection (e.g. innovation and R&D
surveys) will be maintained and strengthened and, where necessary, expanded.
10
Strategic Plan 2020-2025 and Annual Performance Plan 2020-2021• The DSI, working with NACI, will develop a public STI investment framework to
support the commitment of public resources for STI by the Ministerial STI Structure.
NACI’s role will be to undertake foresight studies and provide an independent STI
M&E function (including regular analysis of public STI spending). The framework will
be based on an analysis of STI funding requirements in line with strategic and
sovereign priorities, as well as consultation across government through an
interdepartmental STI Budget Committee at the level of Director-General, including
national and provincial governments with significant STI mandates. NACI to work
with DST, the DPME and the National Treasury to ensure that the framework delivers
actionable and comparable information that can inform the management and funding
of the NSI initiatives.
Appropriate links will also be established between NACI and the DPME to help integrate
STI into transversal government planning by the DPME, and to support funding
prioritisation by the DPME and National Treasury (e.g. via the annual Budget Mandate
Paper). For instance, based on its new M&E function and on regular environmental
scanning, NACI will prepare reports on the implications of geopolitical and demographic
shifts, technological changes, environmental sustainability imperatives and other
megatrends for government STI planning.
In order to give effect to the above proposals, a process will be initiated to amend the
NACI legislation.
5. Relevant court rulings
None.
11
Strategic Plan 2020-2025 and Annual Performance Plan 2020-2021PART B: OUR STRATEGIC FOCUS
6. Vision
A leading advisory body to government on science, technology and innovation, in a well-
coordinated, responsive and functioning national system of innovation.
7. Mission
To provide evidence-based advice to the Minister of Higher Education, Science
and Technology and, through the Minister, Cabinet on science, technology and
innovation matters, through the research expertise and engagement with stakeholders.
8. Values
a) Professionalism.
b) Integrity.
c) Innovation and knowledge sharing.
d) Transparency and accountability.
9. Situational analysis
This section is not intended to be a comprehensive assessment of the situation, but to
identify key trends and challenges confronting all science systems in general, and the
South African NSI in particular. Although deeper analysis may be required to provide a
better understanding of some trends, the available information has been used to reflect
on NACI’s current work and possible future work, and to develop this Strategic Plan
and APP.
9.1. External environment analysis
9.1.1 Global macro trends
Global social inequality – as expressed in the growing gap between rich and poor – is
one of humanity’s most remarkable and enduring legacies. It is a social relic that, so far,
has stubbornly defied the passage of time, holding its place as a constant across both
ancient and modern worlds, with such pronounced and obscene visibility that, despite
spectacular feats of science and technology by our species over the centuries, remains
12
Strategic Plan 2020-2025 and Annual Performance Plan 2020-2021to this day one of humanity’s stunning acts of misachievement (NACI, 2019).
Contemporary South Africa is a stunning exemplar of this striking historical phenomenon
– this, despite the passage of over 25 years of democratic governance, one of the most
progressive constitutions in the modern world, the Bill of Rights and numerous efforts to
reconstruct the economy. Many, particularly poor black communities, feel left behind,
excluded and treated as unimportant, like the counterparts in many other parts of the
world, as Ángel Gurría argued, “at the mercy of big impersonal forces of globalisation,
technological change, large corporations and financial institutions”. Yet the forces are
recognisable, definite and historical, the product of human imagination and social power
(NACI, 2019). The message is clear: the world we live in is characterised by unbalance,
inadequate and uneven development, and growing demands for a better life.
For its part, the United Nations have recognised and framed the societal challenges as
actionable 17 SDGs as shown in Fig 1. The SDGs ought to be addressed and achieved
in an integrated fashion. To this extent, the emphasis should therefore be on interlinkages,
collective actions, coordination and collaboration between different nations, institutions
and policies.
FIGURE 1: SUSTAINABLE DEVELOPMENT GOALS
13
Strategic Plan 2020-2025 and Annual Performance Plan 2020-2021Without discussing these SDGs or societal challenges in details, in the next section, we
discuss selected global macro trends, which have bearing on the developing countries
including South Africa.
9.1.1.1 Growing social inequality and instability
Barring major global catastrophes, and despite slowing global growth rates, the world is
very likely to be a much richer place by mid-century. World GDP is expected to more than
triple by 2060, per capita incomes are also set to rise rapidly, and wealth accumulation is
anticipated to continue apace. However, whether this will also be a better world depends
very much on how incomes and wealth will be distributed across the globe and within
countries.
At present, the prosperity gulf between developed and developing economies is wide.
But the future promises convergence. Over the next half century, disparities in GDP per
capita are expected to narrow across countries; per capita income levels of the currently
poorest economies will more than quadruple (in 2005 purchasing power parity terms),
whereas they will only double in the richest economies; China and India will experience
more than a sevenfold increase of their income per capita by 2060. Nonetheless,
significant gaps in living standards will remain between advanced and emerging
economies as well as between them and the least developed countries.
Inequalities within countries will pose major political, social and economic risks in the
coming years. Over two-thirds of emerging and poor countries, encompassing 86% of
the population of the developing world, will experience growing inequalities. For many,
the prospects of long-term help are particularly gloomy: by 2030, some two-thirds of the
world’s poor could be living in “fragile” states – in other words, in countries where there
is no government that could effectively constitute a counterpart for foreign aid agencies.1
Rising wealth and income in the developing economies of the world is progressing hand
in hand with the emergence of a global middle class. By current projections, the global
economy’s middle class is expected to more than double between 2009 and 2030, from
1.8 billion to almost 5.0 billion, accounting for about 60% of the world population. Some
two-thirds of those middle-class citizens are expected to be found in Asia.2 Of course, the
number of people in the middle class does not properly capture its spending power.
Given the broad range of expenditures that fall within the middle-class definition, some
countries have more affluent middle classes than others. Today’s middle class in Europe
1
ESPAS (European Strategy and Policy Analysis System) (2015), Global Trends to 2030: Can the EU Meet the Challenges Ahead?, ESPAS, Brussels.
2
Gros, D. and C. Alcidi (eds.) (2013), The Global Economy in 2030: Trends and Strategies for Europe, ESPAS, Brussels.
14
Strategic Plan 2020-2025 and Annual Performance Plan 2020-2021and North America make up just over half of the global total in terms of number of people,
but they account for almost two-thirds of total spending by the world’s middle class. This
is about to change. Asia’s share of global middle-class expenditure is expected to climb
from around one-quarter today to almost 60% in 2030, bringing about a huge shift from
spending on necessities such as food and clothing to choice-based spending on
categories such as household appliances and restaurants.3
Growing income and wealth inequalities are not the preserve of the developing world. In
the vast majority of advanced countries, the gap between rich and poor has reached its
highest level for three decades. Today, the richest 10% of the population in the OECD
area earn nearly 10 times the income of the poorest 10%, up from 7 times in the 1980s.
However, the ratio does vary widely across OECD countries. In Nordic and many
Continental European countries, the ratio is significantly lower than the average, but in
Italy, Japan, Korea, Portugal and the United Kingdom it is closer to 10 to 1, between 13
and 16 to 1 in Greece, Israel, Turkey and the United States, and as high as between 27
and 30 to 1 in Mexico and Chile.4
Importantly, however, the rise in overall income inequality in OECD countries is not only
about the top income bracket. The evidence suggests that what matters most is the gap
between low-income households and the rest of the population. Indeed, over the last 30
years, incomes at the low end of the scale often grew much more slowly during the
prosperous years and decreased during downturns. Unsurprisingly perhaps, for the vast
majority of developed countries for which data are available, poverty rates increased
from the mid-1990s to the 2010s, pushing up rates for the OECD area as a whole by 1.5
percentage points. Over the last couple of decades the risk of poverty has shifted
markedly away from the elderly towards families with children. Hence, large families with
three or more children also tend to have higher levels of poverty risk. Moreover, child
poverty is seen to be increasing in almost all OECD and EU countries. On average
across the OECD, the child poverty rate increased from 12.2% in 2000 to 13.2% in 2010.5
Also at risk are young adults, who make up an increasing share of the poor. The increase
in youth poverty is to be found particularly among youngsters not in education, employment
or training who run a greater than average chance of unemployment, lower wages, poorer
health and therefore a greater risk of long-term “scarring”. In many countries, migrant
3
Kharas, H. and G. Gertz (2010), “The new global middle class: A cross-over from west to east”, draft version of chapter in China’s Emerging Middle
Class: Beyond Transformation, C. Li, (ed.), Brookings Institution Press, Washington, DC.
4
OECD (2013), OECD Science, Technology and Industry Scoreboard 2013: Innovation for Growth, OECD Publishing, Paris, http://dx.doi.org/10.1787/
sti_scoreboard-2013-en.
5
OECD (2013), OECD Income Distribution Database, www.oecd.org/social/income-distribution-database.htm.
15
Strategic Plan 2020-2025 and Annual Performance Plan 2020-2021families and their children are also at risk. Within Europe, this is particularly true of non-
EU immigrant families and their offspring.6 And finally, there are those families facing
persistent poverty. These are most likely to be older people, single people (especially
women both with and without children) and jobless households.
9.1.1.2 Food sustainability: Local and global food security
It is estimated that 60% more food will be required to feed 9 billion people on Earth by
2050.7 Furthermore, changing diets, driven by a growing middle class, will lead to
additional demand for more resource-intensive types of food, such as meat. Presently
most countries are largely self-supporting with respect to food, but there are major
challenges, where war, poor governance and extreme events lead to major humanitarian
crises, especially in some African countries. In developing countries population growth is
still the most important factor driving the need for food. Yet in many countries demand for
food is driven more by affluence than by population growth. Increasing calorific intake
and livestock consumption linked to an expanding global middle class is emerging as a
future source of increasing demand.8
Food and nutritional insecurity will persist in many, predominantly poor, regions.9 An
increasing number of regions will face water scarcity, and the competition for scarce
water resources could lead to internal and international conflict.10 Soil degradation will
affect the amount of land available for productive agriculture: around half of the world’s
agricultural land is already affected by moderate to severe degradation and around 12
million hectares of productive land become barren annually due to desertification and
drought. If no significant improvements are achieved in production practices, the loss of
yield may be as high as 50% in some African countries by 2050.11 The situation in most
OECD and BRICS countries is less severe, as continuing yield improvements will lead to
more efficient use of land. Instead of agricultural land expansion, land abandonment is
planned in many countries, which will allow ecosystems to partially recover and
regenerate.12
6
Jokinen, K. and M. Kuronen (2011), “Research on families and family policies in Europe: Major trends”, in Wellbeing of Families in Future Europe:
Challenges for Research and Policy, FAMILYPLATFORM – Families in Europe Volume 1, Uhlendorff, U., M. Rupp and M. Euteneuer (eds.),
FAMILYPLATFORM, Brussels.
7
OECD (2013), Global Food Security: Challenges for the Food and Agricultural System, OECD Publishing, Paris.
8
http://ufm.dk/en/publications/2016/files/an-oecd-horizon-scan-of-megatrends-and-technology-trends-in-the-context-of-future-research-policy.pdf
9
FAO (Food and Agriculture Organization of the United Nations) and WWC (World Water Council) (2015), Towards a Water and Food Secure Future:
Critical Perspectives for Policy-makers, FAO/WWC, Rome/Marseille.
10
WWAP (United Nations World Water Assessment Programme) (2015), The United Nations World Water Development Report 2015: Water for a
Sustainable World, UNESCO, Paris.
11
UNCCD (United Nations Convention to Combat Desertification) (2014), Desertification: The Invisible Frontline, UNCCD, Bonn.
12
OECD (2012), Environmental Outlook to 2050: The Consequences of Inaction, OECD Publishing, Paris, http://dx.doi.org/10.1787/9789264122246-en.
16
Strategic Plan 2020-2025 and Annual Performance Plan 2020-2021Food production and consumption have a major impact on both health and environment,
including regional planning and land use. If food is need to be made more sustainable,
food production (farming systems) and consumption (change in food choices) as well as
processing and waste issues need to be addressed. The need for environmental
sustainability and food security both globally and locally combined with
the patterns of global population growth generates particular sets of future challenges
and opportunities the world.
At present, most agricultural resources (land, water and nutrients) go to feed animals
rather than humans and the current challenge is as much for ‘feed security’ as it is ‘food
security’. The production of meat and dairy, require large inputs of resources like energy,
land, nutrients and water, and result in emissions both from animals (greenhouse gases)
and manures (nitrogen, phosphorus). Some 80% of global agricultural plant harvest
(expressed as nitrogen) goes to feed livestock.13 Although smaller in their absolute
impact, there are also significant environmental effects of vegetables, vegetable oils,
coffee, tea and alcoholic beverages.
Rapidly increasing meat and dairy consumption in developing countries is increasing
environmental degradation, especially as markets and citizens shift towards western
diets. Even small changes in diets can affect resource use and have important
environmental and/or health impacts. Different kinds of alternatives to meat emerge
in supermarkets (crockets, quorn, tahoe, etc.) or are currently under
research. One example of laboratory grown meat is the so-called ‘stem cell burger’.14
The impact of such artificial foods on health and the environment remains to be
ascertained.
A major driver for change is the health risks from inappropriate diets, resulting, for
example, from excess meat and dairy consumption.15 Dietary risks represent the largest
factor, especially for cardio and circulatory diseases as well as by cancer. Reducing meat
and dairy consumption offers the double benefit of improved health and improved
environment.
A rapidly developing narrative concerns the opportunity to optimize human diets, to
provide appetizing and nutritious food that not only meets calorific needs, but minimizes
the health and environmental risks associated with overconsumption, waste and farming
13
Our Nutrient World’ (2013): http://www.gpa.unep.org/index.php/global-partnership-on-nutrient-management/publications-and-resources/global-
partnership-on-nutrient-management-gpnm/21-nutrient-management-key-messages-for-rio20-summit/file
14
http://www.bbc.co.uk/news/science-environment-23576143
15
http://www.forbes.com/sites/alicegwalton/2014/03/04/the-protein-puzzle-meat-and-dairy-may-significantly-increase-cancer-risk/
17
Strategic Plan 2020-2025 and Annual Performance Plan 2020-2021practices. There are emerging signals of reducing meat and dairy consumption in
developed countries, including rapidly developing narratives on vegan, vegetarian and
demitarian (halving meat intake) lifestyles, including the possible health benefits.
Changing diets affect the opportunity space for urban farming, with its own opportunities
and risks. Reducing excess intake of resource-intensive food types (such as meat and
dairy products) also reduces the need to use arable land for the production of livestock
feeds. This can potentially free up land for carbon sequestration, supporting climate
change mitigation, bio-based products replacing fossil inputs, as well as helping to meet
bioenergy goals. Similar challenges apply in fisheries and aquaculture, with rates of fish
consumption increasing substantially. Meanwhile, land limitations push for improved
methods to conduct agriculture in salt rich environments.
Agriculture and food face global challenges linked to sustainable rural economies, global
warming, plant and animal diseases, deforestation, erosion, soil depletion, eutrophication,
diversity loss and desertification. Other factors threatening the sustainability of the food
system are rising global demand for food, feed and biomass for bio-based products and
energy, rapid urbanisation, dramatic decreases in rural habitation, and decreasing land
available for food production, all pushing system resilience to its limits. There is a growing
recognition of the need to optimize food production and consumption in relation to
environmental challenges. Direct impacts of agriculture pose environmental threats
affecting from water, air and soil quality, to climate, stratospheric ozone and biodiversity.
These are caused by a wide range of material flows and their potential environmental
load, such as greenhouse gases, nitrogen and phosphorus pollution, as well as heavy
metal and pesticide residues.
Around 10% of world’s food production is exported. This figure might increase in the
coming decades due to large differences in terms of food supply and demand in various
countries. Countries like China and India have not enough agricultural land of sufficient
quality to satisfy their increasing demands for both feed and food. This will affect global
food transport and might turn some regions into new feed and food exporters.
Transportation of food forms additional energy cost and additional environmental impacts
from energy supply and use.
At the same time, we are living through an age of hitherto unprecedented and spectacular
advances in the techno-sciences whose effects are beginning to permeate virtually every
sphere of human and planetary life. This includes major advances in information and
communications technology (ICT), biotechnology, nanotechnology, the Internet of Things
(IOT), robotics, artificial intelligence (IA), machine learning, blockchain, 3D-printing,
18
Strategic Plan 2020-2025 and Annual Performance Plan 2020-2021amongst many others, all of which are elements of a new production revolution or fourth
industrial revolution (4IR) that transforms production processes and products; markets,
services and trading systems; entire industries and entire economies (NACI, 2019).
The societal challenges are systemic in nature. They require longer-term planning and
policy actions across technological, economic and social structures and boundaries, and
across national borders. While they can be seen as offering opportunities to the global
community, turning these challenges into opportunities for sustainable and inclusive
growth is not straightforward (OECD, 2015). Firstly, the societal challenges maybe
interlinked or have unexpected knock-on effects. For example, ageing societies can
lead to a reduced labour force, increases in health care costs, and a reduction in the tax
base. Secondly, some challenges have a global dimension, such as climate change,
which means that national policies alone are insufficient to solve them. Current government
policy structures and policies, including research and development (R&D) and STI policy,
are ill-adapted to tackle such complex challenges (OECD, 2015).
In the context of the above set of global societal challenges, South Africa has identified
and seeks to find solutions towards the triple challenge of inequality, unemployment and
poverty.
9.1.1.3 Innovation for socio-economic development
Innovation has always been a foundation for economic growth. From the invention of the
wheel to the Industrial Revolution, the invention of medicines to air transport and the
Internet, innovation leads to change and progress. In today’s world, beset by financial,
social and environmental challenges, and looking for new, stronger, more inclusive and
sustainable ways forward, innovation is more important than ever, and policies to foster
it, leading to the creation and diffusion of new products, processes and methods,
are vital.
Innovation can be measured in several aspects of a country’s growth. First, there is
technological progress embodied in tangible, physical capital, such as better machinery,
smarter equipment or greener buildings. Second, there is intangible, knowledge-based,
capital, such as software, data, research and development (R&D), design, intellectual
property, and firm-specific skills.
Third, there is the smarter, more efficient use of labour and capital to generate so-called
multifactor productivity growth (also referred to as total factor productivity). Fourth, there
is the role that innovation plays in strengthening the dynamics of an economy, with new
19
Strategic Plan 2020-2025 and Annual Performance Plan 2020-2021innovative firms entering the market, replacing other slower, less innovative ones in a
process known as creative destruction. Together, these four dimensions account for as
much as half of GDP growth.
Innovation is also about what humankind needs. It is critical for addressing profound
social and global challenges (such as climate change, health, food security, poverty and
access to clean water) in an affordable and timely manner. At the same time, innovation
can contribute to inequality, which is why it needs to be accompanied by appropriate
labour and social policies (OECD, 2015).
9.1.1.4 Climate change and energy
Ongoing climate change and its adverse effects on human and energy security
Global land and ocean surface temperature data show an averaged combined warming
of 0.85°C over the period 1880 to 2012. The greatest warming over the past century has
occurred at high latitudes, with a large portion of the Arctic having experienced warming
of more than 2°C. The last 30 years were likely the warmest of the last 1,400 years in the
northern hemisphere. Anthropogenic greenhouse gas (GHG) emissions are extremely
likely to have been the dominant cause of the observed warming since the mid-20th
century. Atmospheric concentrations of carbon dioxide (CO2), methane and nitrous oxide
are unprecedented in at least the last 800 000 years.16 CO2 emissions account for around
75% of global GHG emissions, with most coming from energy production – fossil fuel
combustion represents two-thirds of global CO2 emissions.17 Around half of the
anthropogenic CO2 emissions since 1,750 have occurred in the last 40 years. Agriculture
is a major emitter of the more powerful greenhouse gases of methane and nitrous oxide.
There is a strong, consistent, almost linear relationship between cumulative CO2
emissions and projected global temperature change during the 21st century. Further
warming over the next few decades is now inevitable, based on recent rises in atmospheric
CO2 levels, and the global mean surface temperature change for the period 2016-35
relative to 1986-2005 will likely be in the range 0.3°C to 0.7°C. Heat waves will likely
occur more often and last longer, while extreme precipitation events will become more
intense and frequent in many regions. Rainfall will most likely increase in the tropics and
higher latitudes, but decrease in drier areas.
16
Data from the following reference throughout the section unless otherwise indicated: IPCC (Intergovernmental Panel on Climate Change) (2014),
Climate Change 2014: Synthesis Report. Contribution of Working Groups I, II and III to the Fifth Assessment Report of the Intergovernmental Panel on
Climate Change, IPCC, Geneva.
17
OECD (2012), Environmental Outlook to 2050: The Consequences of Inaction, OECD Publishing, Paris, http://dx.doi.org/10.1787/9789264122246-en.
20
Strategic Plan 2020-2025 and Annual Performance Plan 2020-2021The oceans will continue to warm and acidify, strongly affecting marine ecosystems. The
global mean sea level will continue to rise at an even higher rate than during the last four
decades. The Arctic region will continue to warm more rapidly than the global mean,
leading to further glacier melt and permafrost thawing. However, while the Atlantic
Meridional Overturning Circulation will most likely weaken over the 21st century, an
abrupt transition or collapse is not expected.
Reducing and managing the risks of climate change will require a mixed strategy of
mitigation and adaptation. The extent of mitigation efforts will determine levels of future
GHG emissions: without additional efforts beyond those already in place today, warming
by the end of the 21st century will lead to a high risk of severe, widespread and irreversible
impacts globally, even with adaptation. The IEA’s New Policies Scenario is consistent
with a long-term temperature rise of 4°C.
In many respects, this is already an ambitious scenario that requires significant changes
in policy and technologies, but will still lead to dangerous levels of climate change. A
more stringent mitigation scenario that leads to CO2-equivalent concentrations of about
450 parts per million in 2100 would meet the 2°C targets agreed at the recent Paris
climate conference. This 2°C Scenario (2DS) is characterized by 40-70% reductions in
global GHG emissions by 2050 compared with 2010. It will mean increasing the share of
low-carbon electricity supply from the current share of approximately 30% to more than
80% by 2050.
Developing and poorest countries in the world are expected to be much more influenced
by climate change, largely due to the lack of financial resources to mitigate the adverse
effects.18 There are greater risks for agriculture and food security as well as increasing
pressures for health and social care systems, which may result in hunger and diseases.19
In the period from 2030 to 2050, climate change may cause 250,000 additional deaths
per year, mainly due to malnutrition, malaria and heat stroke.20 Furthermore, the rises in
the sea level and storm surges over the next years to come will have significant impacts
on coastal cities, especially in Asia’s most densely populated cities.
18
Roland Berger (2014) Trend Compendium 2030 //. — 2014. URL: http://www.rolandberger.com/expertise/trend_compendium_2030/Climate_change_
and_ecosystem_at_risk.html
19
World Bank (2014) Climate Change and Poverty: An Analytical Framework. Policy Research Working Paper;No. 7126. World Bank Group, Washington,
DC. URL: https://openknowledge.worldbank.org/handle/10986/20639
20
http://www.who.int/mediacentre/factsheets/fs266/en/
21
Strategic Plan 2020-2025 and Annual Performance Plan 2020-20219.1.1.5 Increasing demand for primary energy driven by population and economic
growth
Global demand for resources has grown significantly since the beginning of the 20th
century, which was a combined result of structural economic change as well as the
transition from agricultural to industrial economies. The population of the world has
increased fourfold, whereas the production volume went far beyond with 25-fold.21
Technological advances that led to the economic industrialisation provided significantly
greater variability in the use of natural resources, particularly to generate energy to run
the whole system. Global primary energy demand is set to increase further by 37%
between 2012 and 2040. Most of this demand will be due to economic growth in developing
countries, which will account for around 60% of global energy consumption. Meanwhile,
growth in global demand is expected to slow down from 2% per year in the last two
decades to 1% per year after 2025. This is a result of price and policy effects, as well as
structural shifts in the global economy towards services and lighter industrial sectors.22
Industry will remain the largest consumer of energy in 2040, by which time its energy
demand is expected to have risen by about 40%. Manufacturing in the OECD has
gradually shifted away from coal and oil over recent decades, a trend that is projected to
continue: while in 1990, coal and oil accounted for nearly half of heavy industry’s fuel,
they are expected to decline to just 15% of the fuel mix by 2040. China’s fuel mix will also
“lighten-up” by this time. This will lead to a fall in the average amount of industrial energy
demand per unit of economic output worldwide. Future energy demand growth varies by
industry sub-sector, however, with the chemical sector seeing the largest growth as the
demand for plastics and other chemicals increases.23
Transportation will be the second largest consumer of energy in 2040. While car numbers
are projected to expand with a growing global middle class, fuel efficiency improvements
mean energy demand from cars will rise only slightly. Hybrid vehicles could account for
nearly 50% of new-car sales by 2040, compared with just 1% in 2010.24 This effect will be
especially noticeable in Europe, where liquid fuels consumption is expected to decline.25
Commercial transport – including airplanes, shipping, trains and trucks – will account for
21
EEA (2016) Global megatrends// European Environment Agency. — 2016. URL: http://www.eea.europa.eu/soer-2015/global/competition http://www.
eea.europa.eu/soer-2015/global/competition
22
Barreneche, A., Keenan, M., Saritas, O. et al. (2016). An OECD Horizon Scan of Megatrends and Technology Trends in the Context of Future Research
Policy, A report prepared by the OECD Directorate for Science, Technology and Innovation, commissioned by Danish Agency for Science, Technology
and Innovation (DASTI), Copenhagen (Available at: http://ufm.dk/en/publications/2016/files/an-oecd-horizon-scan-of-megatrends-and-technology-
trends-in-the-context-of-future-research-policy.pdf)
23 35
ExxonMobil (2015), The Outlook for Energy: A View to 2040, Exxon Mobil Corporation, Irving, Texas.
24
25
http://www.eia.gov/outlooks/aeo/pdf/0383(2014).pdf
22
Strategic Plan 2020-2025 and Annual Performance Plan 2020-2021virtually all of the growth in energy demand from transportation. Most of this demand
growth will be met by oil.
The third largest consumer of energy in 2040 will be commercial and residential buildings.
Worldwide, households will increasingly shift towards cleaner fuels and will rely more on
electricity than primary fuels as domestic appliances and electronics become more widely
available. Nearly 1 billion people will newly gain access to electricity by 2040, but more
than half a billion will remain without it.26
9.1.1.6 Urbanisation and megacities: Move towards smarter and sustainable cities
By 2050, the urban population is expected to reach 6 billion up from less than 1 billion in
1950. By 2100, it is likely to reach somewhere around 9 billion, which may represent the
85% of the projected global population. Almost all the growth will occur in the cities of
developing countries, with nearly 90% occurring in Asia and Africa. In a few countries like
Japan and the Russian Federation, the urban population will decrease in line with falling
overall population numbers. The number of “megacities” of 10 million or more inhabitants
has almost tripled over the last 25 years, and they now account for 12% of the world’s
urban population. Forty or so such cities will exist by 2030.27
High fertility rates combined with limited job prospects in many rural areas are important
drivers of urbanisation, as cities typically offer better jobs and educational opportunities.
Indeed, urbanisation can be an important dynamo of economic growth: cities generally
provide easier access to modern and efficient infrastructure – for example, public
transportation, housing, electricity, water and sanitation – for large numbers of people in
an economically efficient manner28, 29. In emerging economies such as China, cities have
been the main sources of domestic demand, through higher consumption of a growing
affluent middle class and very high spending on infrastructure, a dynamic that is expected
to continue.30
Building on advances in sensors and their connectivity through high-performance
computing – the so-called Internet of Things – urban areas in more advanced economies
will increasingly become “smart cities”. Various utility and transport networks and systems
26
IEA (2014), World Energy Outlook 2014, OECD/IEA, Paris, http://dx.doi.org/10.1787/weo-2014-en
27
Barreneche, A., Keenan, M., Saritas, O. et al. (2016). An OECD Horizon Scan of Megatrends and Technology Trends in the Context of Future Research
Policy, A report prepared by the OECD Directorate for Science, Technology and Innovation, commissioned by Danish Agency for Science, Technology
and Innovation (DASTI), Copenhagen (Available at: http://ufm.dk/en/publications/2016/files/an-oecd-horizon-scan-of-megatrends-and-technology-
trends-in-the-context-of-future-research-policy.pdf)
28
OECD (2012b), Environmental Outlook to 2050: The Consequences of Inaction, OECD Publishing, Paris, http://dx.doi.org/10.1787/9789264122246-
en.
29
UN (2014), World Urbanization Prospects: The 2014 Revision, Highlights, UN Department of Economic and Social Affairs, Population Division, New
York.
30
EUISS and ESPAS (2012), Global Trends 2030: Citizens in an Interconnected and Polycentric World, EUISS and ESPAS, Paris.
23
Strategic Plan 2020-2025 and Annual Performance Plan 2020-2021will become progressively interconnected, thereby supporting more sustainable use and
management of resources.31
While cities will make it easier to provide modern energy and water infrastructures to a
growing number of people, air pollution and unmanaged waste will be major concerns for
public health in many urban areas.32 Climate change will see storm surges and rising sea
levels increase over the next decades, which will have major impacts on low-lying coastal
cities, especially in Asia, where so much of the world’s urban population lives. Extreme
weather events will also disrupt complex urban systems and will have major impacts on
the insurance industry in developed countries.
The economic benefits of urbanisation seen in countries such as China may not materialise
in other parts of the world, particularly in sub-Saharan Africa and some parts of Asia.
Inadequate education and physical infrastructure, combined with poor governance, have
so far constrained the efficient use of productive resources and the industrial development
that might have come with it.33 A growing proportion of low-income groups will become
urbanized over the next decades so that in some regions, urban growth will become
virtually synonymous with slum formation. Urban slums suffer from substandard housing
and inadequate water, sanitation and waste management services, all of which have
negative consequences for human health and the environment.34 Such areas are also
more likely prone to conflict and social unrest.35
Improving health in cities has emerged as an important issue. In high-income countries,
the burden of non-communicable diseases, including cardiovascular and respiratory
diseases, cancer is projected to rise from some 86% in 2005 to 89% in 2030 in terms of
DALYs.36 Air pollution, noise and temperature account for a considerable proportion of
these non-communicable diseases. Ambient particulate air pollution was ranked ninth as
a determinant of disease in the ranking of the Global Burden of Disease estimates in
2010 and is estimated to reduce life expectancy by almost 9 months on average in
Europe.37
31
EC (European Commission) (2014a), Preparing the Commission for Future Opportunities: Foresight Network Fiches 2030, working document, https://
ec.europa.eu/digital-agenda/en/news/european-commission-foresight-fiches-global-trends-2030.
32
OECD (2012b), Environmental Outlook to 2050: The Consequences of Inaction, OECD Publishing, Paris, http://dx.doi.org/10.1787/9789264122246-
en.
33
OECD (2015a), The Metropolitan Century: Understanding Urbanisation and Its Consequences, OECD Publishing, Paris, http://dx.doi.
org/10.1787/9789264228733-en.
34
OECD (2012b), Environmental Outlook to 2050: The Consequences of Inaction, OECD Publishing, Paris, http://dx.doi.org/10.1787/9789264122246-
en.
35
UK Ministry of Defence (2014), Global Strategic Trends – Out to 2045, Strategic Trends Programme, Fifth Edition, Ministry of Defence, Swindon.
36
Busse R., et al. (2009). Managing Chronic Disease in Europe, Department of Health Care Management, Berlin University of Technology.
37
http://www.aphekom.org/web/aphekom.org/home;jsessionid=F72B04D8770C600FD1311ABF499C250D
24
Strategic Plan 2020-2025 and Annual Performance Plan 2020-2021You can also read