North East Transport Plan 2021-2035 - Moving to a green, healthy, dynamic and thriving North East - Sunderland City Council
←
→
Page content transcription
If your browser does not render page correctly, please read the page content below
AD.30

North East Transport Plan 2021-2035
Moving to a green, healthy, dynamic and thriving North East

CONSULTATION DRAFT
Contents                                                                                          Foreword
North East Transport Plan                                                                     1                    On behalf of the North East Joint Transport Committee (NEJTC), I am
Contents / Foreword                                                                          2                     delighted to present the draft North East Transport Plan.
Executive Summary                                                                            3
                                                                                                                   This is the first regional Transport Plan which sets out our collective
What is the North East Transport Plan?                                                       4                     ambitions up to 2035. Through its delivery, we will create a modern
What this Plan covers                                                                        5                     transport network that we are all proud of.
Our vision and objectives                                                                    6
                                                                                                  Our schemes are ambitious and are so far worth £6.1 billion an amount which will grow as
North East England – our region                                                           7-12
                                                                                                  further schemes are developed over the lifetime of the Plan. We believe this to be a fair
   Map                                                                                       7
                                                                                                  share of national transport funding which should be allocated to our region from Central
   Our environment                                                                         8-9    Government to 2021-2035.
   Our economy                                                                            10-13
   Our health and social inequalities                                                     14-15
                                                                                                  These projects will help to protect our environment by providing attractive carbon-neutral
                                                                                                  sustainable transport for people across the North East. Our plans will also significantly
   Our geography and people                                                               16-17
                                                                                                  fuel regional economic growth which will help to boost job creation.
   Our transport network and travel habits                                                18-21
   Safe, secure network                                                                  22-23    Our region not only has the passion to drive forward this exciting plan, we also have the
   Where we are now                                                                         24    existing transport assets to provide a strong foundation upon which we can build. Here
Measures of success (Key Performance Indicators)                                         25-26
                                                                                                  we set out how we will deliver this game-changing system, including greener travel
                                                                                                  options which will greatly improve the physical and mental health of people across the
Our transport network                                                                    27-48
                                                                                                  North East.
   What do our users think?                                                                 27
   Our transport network                                                                    28    As we reflect on the significant challenges our region has faced in 2020, I am pleased to
   Making the right travel choice                                                        29-31    now turn to the future and consider how transport across the North East will look and feel
   Active Travel                                                                         32-33
                                                                                                  in 2035. Developing our network is key to unlocking our green transport ambitions. It will
                                                                                                  boost our economy, increase connectivity across the North East and help us to overcome
   Public transport: travelling by bus, ferry and on demand public transport             34-36
                                                                                                  long-standing health, social and economic inequalities.
   Private transport: travelling by car and using road infrastructure                    37-40
   Public transport: travelling by local rail and Metro                                  41-43    It is my hope that the public will fully engage with our draft plan to drive forward our vision
   Connectivity beyond our own boundaries                                                44-46    of ‘moving to a green, healthy, dynamic and thriving North East’. We welcome members
   Research, development and innovation                                                     47
                                                                                                  of the public to feedback on this document and share their aspirations for the future of
                                                                                                  regional transport.
Implementation of the Plan                                                               48-55
   Our call to action                                                                    48-49    On behalf of the NEJTC I would like to thank the public, our partners and stakeholders for
   Shovel-ready schemes – delivery map                                                      50    playing their part in the development of this strategic Transport Plan. We look forward to
   Schemes for delivery in the next five years – requiring funding to be accelerated –            the many discussions and debates that will take place in the coming months throughout
                                                                                            51    this consultation.
   delivery map
   Schemes for development and delivery in the next ten years – delivery map                52
                                                                                                  Cllr Martin Gannon
   Schemes for development and delivery beyond ten years – delivery map                     53
                                                                                                  Leader of Gateshead Council and
   How we will deliver this Plan                                                         54-55
                                                                                                  Chair of the North East Joint Transport Committee
This Plan is supported across our region                                                    56
Conclusion                                                                                  57

North East Transport Plan                                                                                                                                                                           2
Executive summary
This is our first region-wide Transport Plan for             the use of public transport, cycling and walking,       Implementation Plan
the seven local authority areas in the North                 resulting in congestion and poor air quality.           We have an ambitious but deliverable timeline             Delivering this Plan, achieving our
East, covering two Combined Authorities,                     However, the Covid-19 pandemic lockdowns in             which will lead us towards delivering our vision          vision and objectives will support
brought together by the North East Joint                     2020 gave us cleaner and quieter towns, cities and      and achieving our objectives by 2035. We have             a shift to a more sustainable and
Transport Committee:                                         neighbourhoods. We will work to sustain some of         clearly set out the timeline showing our priorities       healthier way of life in the North East,
The North East Combined Authority                            the benefits this afforded and this Plan will help      and ambitions in our Delivery section of this Plan        through lowered emissions, better air
(comprising Durham, Gateshead, South Tyneside                take us towards carbon neutrality.                      and this will be accompanied by a forthcoming             quality and travel choices.
and Sunderland)                                              Ultimately, our approach recognises that different      Implementation Plan.
                                                             communities across the North East have different        A programme of schemes has been developed                 • Easier access to, education, skills,
The North of Tyne Combined Authority                         transport needs and will need different transport                                                                   and higher value jobs
(comprising Newcastle upon Tyne, North Tyneside                                                                      and this will be managed as a live programme with
                                                             solutions. For example, the role of the car and of      regular updates to the schemes and evidence               • Health levels at least equal to other
and Northumberland)                                          public transport is very different in rural and urban   that underpins them to ensure that the region can           regions in the UK
This North East Transport Plan sets out the                  communities.                                            continue to address our challenges and grasp              • Better connections from the North
transport priorities for our region up to 2035.              Those transport links need to be fast, reliable,        opportunities. Our Plan is divided into the following       East to national and international
Home to two million people, our region is distinct and       resilient, accessible and affordable. They must have    timescales:                                                 destinations
diverse. It consists of urban and rural communities all      the capacity we need and, crucially, be sustainable.    • Shovel-ready schemes                                    • A transport network with improved
with a rich history and positive people who want to          Better integration is also key.
                                                                                                                     • Schemes for delivery in the next five years –             environmental credentials including
contribute to moving our country forward.                    This is our Plan for how we will rectify our wider        requiring funding to be accelerated                       mores sustainable journeys, better air
This mixture of urban, suburban and rural                    regional and transport challenges and grasp future                                                                  quality and reduced carbon output
                                                             opportunities by 2035.                                  • Schemes for development and delivery in the
communities results in a range of transport                                                                            next 10 years                                           • A safer and more reliable integrated
challenges, from rural isolation in more remote areas        We already have the foundations to launch a world-                                                                  transport network which is more
                                                             class sustainable transport network. This Plan builds   • Schemes for development and delivery beyond               intuitive for customers with a
to poor air quality and congestion in parts of our
                                                             on our existing assets and gives us the framework to      10 years                                                  sustainable cost base
cities, along with pockets of ‘transport poverty’ across
the entire region.                                           enable us to deliver a more seamless, co-ordinated      We have set schemes across 7 work programmes              • Direct job opportunities in the transport
We already have a well-established integrated public         and integrated transport system across the region.      consistent with our Policy Areas:                           and infrastructure sectors
and sustainable transport system which makes a real          The Plan sets out our priorities and forms the basis    • Making the right travel choice;                         • Enabling new development and
difference to people’s everyday lives, allowing them         for bids and requests for funding for transport                                                                     housing sites and improving
                                                                                                                     • Upgrading North East active travel infrastructure;
to get to work, to visit friends and family, to the shops,   investment in the North East up to 2035.                                                                            accessibility to existing communities
and to get to essential services such as schools and                                                                 • Public transport: travelling by bus, ferry and on
                                                             This Plan is for the whole of the North East.
hospitals.                                                                                                             demand public transport;
                                                             It recognises the different needs of communities.
This Plan will show that our region has the potential        It considers why we travel and how those trips          • Public transport: travelling by local rail and Metro;
to improve it further to expand its reach, capability        are made and how journeys can be improved. Our                                                                    This Plan will deliver profound and
                                                                                                                     • Private transport: travelling by car and using road
and quality.                                                 Plan is for everyone, young and old and for people        infrastructure;                                         lasting improvements that will shape
                                                             traveling to, from, and within North East England.                                                                the North East and its people for
In some areas of our region, the existing network                                                                    • Maintaining and renewing our transport network;         decades to come.
needs to be improved and expanded so that it better          The North East Transport Plan vision is:                  and
connects the people and communities which it is              ‘Moving to a green, healthy, dynamic                                                                              To 2035, our region requires an
                                                                                                                     • Connectivity beyond our own boundaries.
supposed to serve, leaving no one and nowhere                and thriving North East’.                                                                                         estimated £6.1 billion of capital
behind. Creating, one, total network with integration        The objectives of the Transport Plan are:               We have complied a Technical Appendix, available          investment, an amount which will grow
at the heart is key. Solving our transport challenges                                                                on request, containing all of our data sources and        as further schemes are developed over
                                                                Carbon-neutral transport                             evidence used.
will go a long way in enabling the region’s long-                                                                                                                              the lifetime of the Plan.
standing health, social and economic inequalities to            Overcome inequality and grow our economy             The Integrated Sustainability Appraisal (ISA) also        We believe this to be a fair share of
be overcome.                                                    Healthier North East                                 accompanies this Plan. The appraisal seeks to             national transport funding which should
Recent years have seen rising levels of car use                 Appealing sustainable transport choices              identify any impact of our programme on key factors.
                                                                                                                                                                               be allocated to our region from Central
and ownership in the region and reductions in                                                                                                                                  Government to 2021-2035.
                                                                Safe, secure network.

North East Transport Plan                                                                                                                                                                                                    3
What is the North East Transport Plan?
The North East Transport Plan is the first              Making journeys is good                                                                                     Gross Value Added output rising but
ever comprehensive Transport Plan for the                                                                                                                           challenged by external pressures with a
region, bringing together the seven local
authorities in North East England: Durham,
                                                        Covid-19 accelerated the demand, ambition
                                                        and delivery of both digital transformation and
                                                        mobility but we want to encourage people to
                                                                                                                  £42-50m                                           persistent productivity gap GVA of £20,338.
                                                                                                                                                                    This is below the national average of £24,181.
Gateshead, Newcastle upon Tyne, North                   make trips around the North East. We travel to            For example, if the economies of                  We have fewer businesses per head and
Tyneside, Northumberland, South Tyneside                school, to work, to shop, to care for others and to       Ashington, Blyth and Newcastle are                fewer jobs in high skilled occupations than
and Sunderland.                                         socialise with friends. For businesses, the ability
                                                                                                                  brought ‘closer’ together through                 other areas.
A single Plan giving a truly regional focus is a step   to travel enables the opportunity to acquire, move
                                                        and sell products and goods. Doing so benefits
                                                                                                                  restored passenger rail links, there will         Analysis by IPPR North suggests that in
forward for the North East. Travel patterns in our                                                                be an increase in the level of interaction
                                                        local economies of communities which make                                                                   2019, planned Government on transport in
region are complex but 95% of our population
                                                        up our region. Transport can also enable social           between the two, resulting in economic            London was £3,636 per person, over seven
live and work within our seven local authority
                                                        connectivity to people who are isolated, and can          growth for both areas. £42m to £50m               times more than the £519 per head in the
areas1 and travel behaviour isn’t constrained by
                                                        enhance independence and opportunity. It is also          wider economic benefits.                          North East.
administrative boundaries.
                                                        the key to tackling inequality and deprivation by                                                           A range of transport issues has led to a
This is not a ‘business as usual’ Transport Plan.       facilitating access to jobs and leisure. High-quality                                                       contrast between rural isolation in our
It sets out the region’s transport priorities up to     and integrated transport links can also help            Successful delivery of the Plan will lead to the
                                                                                                                                                                    remoter areas and poor air quality and
2035 and how the North East can address our             promote and strengthen tourism and regional             North East having a world-class sustainable
                                                                                                                                                                    congestion in parts of our cities.
main future challenges, ultimately delivering           development. Making journeys of course leaves           transport network. Carrying out our Plan and
profound and enduring improvements to our               an impact on our environment and plays a big role       achieving our vision and objectives will lead       Commuting to workplaces is dominated
transport network.                                      in our health and wellbeing, so how we choose to        to better outcomes for our region’s residents,      by car travel, so congestion is a significant
                                                        travel is important. That is why connecting people      businesses and visitors and overcome our            issue on our roads, which affects public
The Plan is centred around connecting people                                                                    long- standing challenges:
                                                        to opportunities using greener, healthier and                                                               transport access and attractiveness, reduces
to good employment opportunities, generating
                                                        sustainable transport options is key to this Plan.                                                          productivity and increases inactivity and
economic growth, while enabling the region and                                                                       We have a growing population but a one
                                                                                                                                                                    vehicle emissions.
its people to move to healthier and greener more        Why is transport important?                                  that is ageing over time (2m people, average
sustainable ways of travel.                                                                                          age 43.7).                                     Public transport use is falling over the long-
                                                        Transport is a means to an end, a way of being
                                                        able to do the things that make up our lives                                                                term, despite an increase in bus use in 2019
The improvements we have identified have been                                                                        There are major health and income
                                                        and enables our region and its people to keep                                                               as a result of investment by bus operators.
agreed by the region and will be delivered by                                                                        based inequalities. High percentage of
a number of organisations through the range             moving. It enables physical connectivity between             economically inactive people in the region     Transport contributes a significant
of programmes and schemes set out in the                people and jobs, businesses and workers, and                 are long-term sick (North East: 28.5%,         proportion of carbon emissions and we have
Implementation section of this Plan.                    businesses to suppliers and customers. Within our            UK 22.1%)                                      an air quality problem in our region.
                                                        region, it’s important that our population of two
We will use this Plan to communicate                    million residents can reach work, education and              Plans for substantial housing growth           Cars are our region’s most used form of
opportunities for investment and improvements           healthcare and visit friends and loved ones. Links           need to be supported by good public and        transport and car ownership in the North
to our transport network. The Plan is our bedrock       to and from other regions and to other countries             sustainable transport connections: 109,555     East is increasing, leading to more traffic
for bids and requests for funding inward transport      are also fundamental for facilitating economic               new homes planned by 2036.                     congestion and vehicle emissions.
investment to the region from Central Government        growth and trade.                                            Average productivity in our region remains
and other sources. This is the long-term transport
                                                        Well-coordinated transport investment and land               16% below the output for England. This has
strategy for our forward-looking region.
                                                        use planning can foster social mobility (OECD                an impact on the potential competitiveness
                                                        2018), and collectively lead to better economic              and resilience of our businesses.
                                                        performance of specific areas as businesses are
                                                        located closer together.

North East Transport Plan                                                                                                                                                                                            4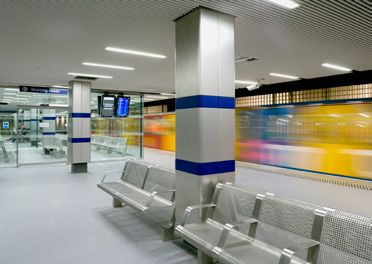
What this Plan covers
Interaction with other policies and strategies
This Plan builds on Connected North East – Our Blueprint,                  Transport type                 What this Plan covers                         What you’ll find elsewhere
published in October 2020, which sets out how a connected
North East can increase the prosperity, quality of life and
health of the region by uniting the potential of digital
and transport.                                                                                            How Active Travel contributes to our          Information on pop up cycle routes, local cycling
                                                                                                          region’s transport network, future            and walking improvement plans, and rights of way
The aim of this Plan is to help support our region’s wider                                                development and policy aims.                  improvement plans (Local Authority websites).
goals of creating and sustaining 100,000 more and better                     Active travel
jobs in a growing and decarbonised economy, where social
                                                                                                                                                        Details of, and decisions about specific ferry and bus
and health inequalities are greatly reduced.
                                                                                                                                                        services, fares, ticketing, timetables and routes:
The Plan is therefore closely aligned and interfaces with                                                 How buses, the Ferry and ‘on demand’
                                                                                                                                                        NEBus is the bus operators’ association which
the North East Local Enterprise Partnership (LEP) Strategic                                               public transport contribute to our region’s
                                                                                                                                                        encompasses the providers of services across the
Economic Plan and Local Industrial Strategy, Central               Public transport: travelling by bus,   transport network.
                                                                                                                                                        North East.
Government strategy, as well as all relevant policies and        ferry and on demand public transport
Plans of Transport for the North (TfN), the seven North East                                                                                            (Nexus website).
local authorities and Nexus. See the Call to Action page for a                                                                                          Local Highway management and investment proposals.
timeline of strategic interventions.
                                                                                                                                                        Highway Asset Management Plans and Traffic Asset
Our upcoming Transport Strategies which will be                                                                                                         Management Plans.
                                                                                                          How roads contribute to our
aligned to this Plan:                                                                                     region’s transport network and their          Highway Design Standards.
                                                                  Private transport: travelling by car    future development.                           Parking standards and car park CCTV.
 2021/22                        2022/23
                                                                     and using road infrastructure
                                                                                                                                                        Roadworks management (Local Authority websites).
 • Refresh of Metro and
                                • Active Travel Strategy                                                                                                Tyne Tunnel Toll information.
   Local Rail Strategy
                                • Roads and Electric Vehicle
 • TNE Engagement Strategy
                                  (EV) Infrastructure Strategy
 • Bus Strategy                                                                                           How Metro and Local rail contribute to        Details of, and decisions about, specific services, times
                                                                                                          our region’s transport network and their      fares and ticketing.

The table to the right shows what is in Plan and what is             Public transport: travelling by      future development.                           (Northern trains and Nexus website).
available elsewhere, for each form of transport, based on our             local rail and Metro
policy areas:
• Active travel                                                                                           How our national and global gateways
• Public transport: travelling by bus, ferry and on demand                                                contribute to our region’s transport
                                                                                                                                                        Details of, and decisions about, specific routes and port
  public transport                                                                                        network for both passengers and freight.
                                                                                                                                                        and airport operations.
• Private transport: travelling by car and using                                                          How we will work with partners to
  road infrastructure                                                                                                                                   (Newcastle Airport, Port websites, Main Line railway
                                                                         Connectivity beyond              strengthen connections from destinations
                                                                                                                                                        services, flight and sailing schedules).
• Public transport: travelling by local rail and Metro                   our own boundaries               in our region to everywhere in the UK
• Connectivity beyond our own boundaries                                                                  and beyond.

North East Transport Plan                                                                                                                                                                                           5
Our vision and objectives The vision and objectives for the Plan set the standard of what
we want to achieve and where we want to be by 2035.
The Vision
“Moving to a green, healthy, dynamic and thriving North East”
The Objectives
Carbon neutral Overcome inequality Healthier Appealing sustainable
Safe, secure network
North East and grow our economy North East transport choices
We will initiate actions to make travel in The Plan is aligned with the North East LEP’s The North East has the lowest life expectancy of all the We will introduce measures We will improve transport safety and
the North East net carbon zero, helping long term goals to first return the region to English regions. The Plan will help achieve better health which make sustainable travel, security, ensuring that people are
to tackle the climate emergency declared pre-Covid-19 GDP and employment levels outcomes for people in the region by encouraging active including cycling and walking, a confident that they will be able to
by our two Combined and seven Local and then to move forward in pursuit of travel and getting people to travel by more sustainable more attractive, greener, and easy feel safe and secure when travelling
Authorities, addressing our air quality the economic ambitions set down in their means, improving air quality, helping our region to attain alternative to getting around. around the North East.
challenges, and helpin to achieve the UK’s Strategic Economic Plan (SEP). health levels at least equal to other regions in the UK.
net zero by 2050 commitment.
Policy areas
We will enable people to make greener and healthier travel choices We must ensure all our actions improve transport across the region
Making the right whenever they can and ensure our sustainable network takes and deliver to the objectives of this Plan so we are greener, more
travel choice everyone where they need to go at a price they can afford. inclusive, healthier, safer and our economy thrives.
Private transport: Public transport:
Public transport: travelling by bus, ferry Connectivity beyond Research, Development
Active travel travelling by car and using travelling by local rail
and on demand public transport our own boundaries and Innovation
road infrastructure and Metro
We will help more people use We will improve bus travel and attract more passengers We must make our roads flow We must invest in Metro and We must work with partners We will embrace new
active travel by making the cycle with new rapid bus corridors. This will include changing better for goods and essential local rail to extend and improve to make movement of people technologies to meet our
network better across the North how road space is used to help buses move more quickly. car journeys the network. and goods to and from our region, transport objectives and
East. This will include being flexible We will take action to continue to support the Ferry and We must strengthen use of We will take action to drive our more efficient and greener. set innovation challenges
in how we use road space to help develop potential improvements where possible. cleaner, greener cars, vans partners to make travelling and We must work with partners to to industry creating new
cyclists and pedestrians. and lorries. moving goods around our region strengthen connections from opportunities with our network
We must help more people to reach the sustainable destinations in our region to as the testbed.
transport network with more ‘on demand’ solutions. more efficient and greener.
everywhere in the UK and beyond.
Overarching policy areas
We will strive to integrate within and between different We must constantly seek funding We will take action to make travel in the We must ensure that we work with partner
types of transport, so that each contributes its full opportunities to deliver our Transport Plan North East net carbon zero and improve organisations to drive new, quality roles and
potential and people can move easily between them. objectives. transport safety and security. innovate in the transport sectors.
North East Transport Plan 6To Edinburgh,
North East England – our region
Glasgow, Aberdeen
Home to Nissan Shields Ferry
Motor Manufacturing 400,000 passenger
Port of Berwick
Berwick-upon-Tweed
One in 3 British cars is made journeys a year
at this plant – 442,300
in 2018
Holy Island Two UNESCO World
A1 Heritage sites
Farne
Islands
Nationally significant
Home to 2 million people 5 national catapult centres offshore energy hub Tyne and Wear Metro
Digital, Energy Systems, Wooler 60 stations
High Value Manufacturing, 89 trains
Offshore Renewable Energy 31 National Rail stations
5 sea ports 36m passenger
and Satellite Applications with 15.6 million entries and
Port of Berwick, Port of Blyth, journeys in 2018/19
Port of Sunderland, Port of Tyne
exits in stations in 2018/19
and Seaham Harbour
Home to a range of national Every journey on our Metro
innovation centres Alnwick 54 million tonnes of freight
Northumberland and Local Rail network
Newcastle International Newcastle Helix, NETPark in To Scotland National Park in 2018 were lifted by GB
brings an £8.50 direct
Airport – 80 direct routes, Durham A697
registered HGVs
Coquet benefit to our economy
5.2 million passengers, 4,745 Rothbury A1
Island 4.7% of all freight
tonnes of freight in 2019. A68 (by tonnage) lifted in
Manufacturing England exc London 28% of households do not
15% of our GVA and 11% own a car – the highest
Value of exports of employment proportion outside of
£13.3 billion (2019) Growing cycling and London – shrunk by 9%
Value of imports Ashington walking network since 2002/03
£14.4 billion (2019) Morpeth
Bellingham
A696
Port of Blyth
A68 162.4 million bus passenger
A189
Newcastle Cramlington journeys in 2018/19
Airport Whitley Bay
North Shields
NEWCASTLE
UPON TYNE
Port of Tyne Home to the largest
South Shields
purpose built datacentre
A69 A69
Hexham campus in the UK
To Carlisle Haltwhistle Blaydon
A1 SUNDERLAND Stellium Data Centres, Cobalt
Port of Sunderland
Key A68
Business Park, North Tyneside
A692 Washington
Consett A693
Ports Chester-le-
Street A690 Seaham Harbour Four universities
A691 A1 (M) 80,000 students,
Port of Tyne – Ferry Terminal
17,000 international
A19
Newcastle International Airport DURHAM
Tyne and Wear Metro A68
Spennymoor
Wingate
Railway Line North East Bishop
Auckland Sedgefield
region
Newton
East Coast Main Line Aycliffe
To Tees Valley
Motorway
A688
Major Road Network
Barnard To York,
Enterprise Zones Castle
Leeds,
Manchester,
Midlands,
7
London
North East Transport PlanOur environment
Carbon Neutral North East Air Quality
In recent years there has been a general increased awareness of The North East has air quality hotspots in cities and towns. We face While 28% of households in the North East
the need to take action on climate change. In June 2019 the UK environmental directions from Government to improve air quality in do not own a car – the highest proportion
Government became the first major global economy to pass a law parts of the region as soon as possible. outside of London – this has shrunk from
that requires the UK to achieve 'net zero' greenhouse gas (GHG) 37% in 2002/3. The proportion of households owning
emissions by 2050.7
two or more cars has increased from 20% to 32% over
Although 92% of days were classed as ‘low the same period.
emissions’ on the Air Quality Index in the
All seven local authorities and both
North East in 2019, it is estimated that poor
Combined Authorities have declared
air quality is responsible for around 360 deaths each Most current vehicles on our roads significantly contribute to carbon
climate emergencies.
year in Central Tyneside alone. emissions. Dominance of the private car for commuting trips is a
significant challenge for the region that we must address.
How can transport help?
Commuting data suggests that rural residents are more dependent
Transport can play a significant role in providing solutions to achieve The region has the following air quality management areas:
on a car than people living in urban areas and make less use of
the UK’s net-zero carbon emissions commitment by 2050. This will buses largely as a result of service provision and levels of density.
require further development and use of low carbon technology. It Authority Authority Location(s)
will also require helping people to make the right travel choice for Congestion
Durham County Council Durham City, Chester Le Street
their journey. Our region has significant road congestion problems. High
Gateshead Council Gateshead Town Centre proportions of car and van use in the region results in road corridors
In early 2020, the UK Government announced a consultation on
bringing forward the end to the sale of new petrol and diesel cars Newcastle City Council Newcastle City Centre, Gosforth into the centres of Durham, Newcastle, Gateshead and Sunderland
and vans from 2040 to 2035, or earlier if a faster transition appears being regularly congested, especially at peak times and particularly
South Tyneside Council Boldon Lane/Stanhope Road
feasible. The Independent Committee on Climate Change (CCC) at city centre river crossings.
Leam Lane/Lindisfarne Roundabout
concluded that this is required for the UK to end its contribution to However, car use is continuing to rise and remains the most common
climate change by 2050. Some of the measures we have included in our AQMAs are: mode of transport for commuting. As with the rest of the UK, recent
Over the coming years, there will need to be substantial investment • Reducing the volume of traffic entering the area decades have seen rising levels of car use and ownership in the
in new fleets of cars, buses, and other road vehicles as well as trains, North East.
• Working with bus operators on emission standards for buses and
together with the necessary infrastructure (including Electric Vehicle to encourage the use of cleaner vehicles Demand for higher levels of car ownership in the coming years
charging points and railway electrification) for them to operate. • Encouraging cycling and walking. suggests increased future traffic congestion if alternative provision is
This means that interventions are required in the North East to not made.
The aim of these management areas is to improve air quality for
create a sustainable transport network that is attractive throughout a continued period. If this could be achieved, then the AQMA in
our region and beyond for both existing and potential users. question could be revoked on the grounds that air quality has
Road transport contributes 37% to the
If we do not address our carbon emissions from transport, then the improved sufficiently that it is no longer a concern.
North East’s carbon emissions
locations of emission exceedance in several urban communities will To compound this issue, people in the North East of England live – the most out of any sector.
continue to have a significant detrimental impact not only on the shorter lives and have shorter healthy life expectancy. Peak-hour
environment but on the health of the people living and working in congestion, particularly at city centre river crossings, is leading to
our region. poor air quality and unreliable bus journeys.
The North East is the lowest ranked region for transport CO2
Over the period to 2035, we need to focus on a decarbonised future We need to increase the volume and proportion of journeys made emissions per person outside London. This gives us solid
and this Plan will take us towards carbon neutrality. by low-carbon, sustainable transport types. This will bring about foundations on which to build a greener and more sustainable
improvements in air quality across the region, with a focus on areas transport network.
that exceed target levels.
North East Transport Plan 8Our environment
The future
Overall carbon emissions per capita The North East has been at the forefront of decarbonisation and
– 5.8 tonnes per person per year (2017). developing low-carbon solutions for our transport network, with
successes in offshore wind technologies and electric vehicles.
We are the third highest region in England
for carbon emissions per capita as a result of having The North East Automotive Alliance (NEAA) is an internationally
higher than average per capita emissions from significant automotive cluster that brings together regional
industrial, commercial, public and domestic sectors. organisations on workstreams including advanced propulsion.
Transport operators are also reducing emissions from buses and
freight vehicles, including the successful deployment of biomethane
Cleaner fuels operated buses in Sunderland by Stagecoach and the roll-out of nine
electric buses for Go North East (funded through the Government’s
The rise of cleaner fuels in particular electric will continue over the
Ultra Low Emission Bus Fund). Our new Metro fleet will be 32% more
next decade following legislation to end the sale of all new petrol
energy efficient, saving tonnes of carbon. Over the coming years,
and diesel cars by 2040; the region has a clear opportunity to
we are extremely well placed to explore the connections between
accelerate and assist in the uptake of these vehicles. Currently there
low emission transport, advanced propulsion and energy systems to
are almost 3000 registered electric vehicles in our region, over 800
improve our region’s environment.
chargers and through programmes such as Go Ultra Low North East
we are confident that the adoption of these vehicles will grow. Other As a region with a world-leading natural and historical environment
sectors including the bus and logistics industries are also investing it is our duty to protect it for future generations against harmful
in this area. A cleaner vehicle fleet results in potentially improved pollution levels. Making better decisions about transport provision
air quality and a more efficient energy sector. However, an increase can lead to a more sustainable (and therefore healthier) way of life in
in the uptake of electric vehicles will not enable us to achieve our the North East for our residents, commuters and visitors.
objectives alone, as it will not fully resolve health impacts, make
efficient use of road space or improve road safety.
This Plan will address these challenges and
embrace the opportunities, taking the North
East towards carbon neutrality, achieving our
objective of Carbon Neutral North East.
North East Transport Plan 9Our economy
Our economy, measured by GVA levels (total and per capita), Wages Economic inactivity
is performing below the national average, with a significant Within the North East, the median gross weekly wage for a full-time 23.4% of the North East’s working age population (16-64) were not
productivity gap and we have a smaller than average private employee also varied by local authority of residence and workplace: in work or actively seeking employment in the year to June 2020
sector economy. (economically inactive).
Wages and salaries (62%) and income from self-employment (5%)
accounted for a smaller percentage of total household income in This was above the England excluding London rate of 20.2%.
Measured in 2018, our region had a workday the North East region in 2018/19 than across England as a whole
Public/private sector employment challenges
population of almost one million people and (63% and 10%, respectively). In contrast, pension income and
benefits accounted for a larger proportion of household income than There is a gap between the North East and other regions on private
the GVA of the North East was £40.9 billion, sector employment density.
across England.
which is 2.5% of English GVA.
It is also important to note that the employment rate also differed In 2018, North East private sector employment per head of working
widely in different parts of the region: age population was 0.52. For England excluding London the figure
was 0.62.
In 2018, the GVA per head of the North East was Authority Employment rate
In March 2020, there were 53,530 private sector enterprises in
£20,617 – well below the GVA per head of England
Newcastle 67% the North East LEP area. This is equivalent to 325 private sector
excluding London (£25,346) and England as a
enterprises for every 10,000 adults in the North East. If the North
whole (£29,356). Northumberland 74% East LEP area had the same rate of private sector enterprises per
North Tyneside 78% head as England excluding London, there would be an additional
26,000 enterprises.
Our economy Gateshead 76%
The North East economy was historically dominated by mining and South Tyneside 70% Productivity challenges
manufacturing. Our region’s traditional heavy industries such as coal The key issues that underpin our lower level of GVA per head
mining and shipbuilding ceased by the early 21st century, leaving us Sunderland 72%
compared to England excluding London are:
with an unemployment rate higher than many other areas despite County Durham 72%
our best efforts to take advantage of new economic opportunities. • A lower proportion of the population that are in employment
While manufacturing remains an important part of the regional The above figures were recorded to the period July 2019 – • A lower level of productivity
economy, it has diversified over recent decades. This has led to a June 2020.
GVA per hour worked in the North East LEP in 2018 was £29.94.
strong service sector including education, financial, professional and This is below the rates for England (£35.57) and England excluding
business services, transport and logistics, and construction. London (£32.74) It is the third lowest GVA per hour among the eight
We have key assets in the energy sector, including offshore energy Many of the long-standing economic challenges core city LEP areas.
and subsea technologies, regional energy, and demonstration and and inequalities that the region has always been
innovation. We are home to a world-leading clinical research sector vulnerable to have re- emerged as a result of the
that supports a growing health and life sciences sector. Covid-19 pandemic. It took until 2016 for North East Average productivity in our region remains
employment to return to 2008 levels following the 16% below the output for England.
We have plans to build on our manufacturing strengths with the
development of the International Advanced Manufacturing Park
last recession – the speed of this recovery must be
(IAMP) in Sunderland and South Tyneside near Nissan’s car plant faster and transport can play a key role.
close to the A19. Providing infrastructure to bring businesses here is
a key element of our Plan.
In recent years, a vibrant digital community with a combination of
start-up, high growth and established businesses across a wide
range of specialisms has been established.
But above all, our region has significant employment in the public
sector across both local services and Central Government back
office and shared services.
North East Transport Plan 10Our economy
Housing and commercial development
The North East has ambitious plans to provide new housing and
Health
commercial development in order to address demographic trends
Manufacturing
and drive economic growth. Some of our significant employment
sites, including out of town business parks and Enterprise Retail
Zones, are successful but have relatively limited public transport Education
connectivity. To support their onward vitality and growth there is
Business administration & support services
an opportunity to address the connectivity that is available and the
Accommodation & food services
quality of those connections.
Public administration & defence
Construction
Approximately 110,00 new homes Arts, entertainment, recreation & other services
planned in the region by 2036 Professional, scientific & technical
Transport & storage
Information & communication
Many new housing estates are located and designed in a way that Wholesale North East LEP
encourages car primacy and the growth in out of town retail and Financial & insurance England
business park development has reinforced this trend. Property England excl. London
Transport development cannot work in isolation and we will ensure Motor trades
that there is joined up working in the North East on transport, land Mining, quarrying & utilities
use and housing. Doing so will help to reduce inequality and grow
Agriculture, forestry & fishing
our economy.
0 2 4 6 8 10 12 14 16
% of employment
Addressing these challenges and embracing
the opportunities will allow us to overcome Employment by broad industrial grouping (% of total), 2018
inequality and grow our economy, by
creating a faster, more attractive and
affordable transport system. The six largest employing sectors in our region are responsible for The largest employing sectors in the North East are:
over three-fifths of employment.
While broadly similar to the national picture, our region has some 15.5% of total
Health employment
key differences:
• A higher percentage of employment in the North East is in Manufacturing 11% of total employment
manufacturing, health, public administration and defence
• A smaller percentage of employment in the North East is in
Retail 9.8% of total employment
professional, scientific and technical activities, wholesale,
information and communication, financial and insurance. Education 9.1% of total employment
Business administration 8.3% of total employment
and support services
Accommodation and 7.6% of total employment
food services
North East Transport Plan 11Our economy
Key sectors
Digital Advanced manufacturing
The North East LEP's Strategic Economic Plan (SEP) identifies four
areas of strategic importance, where our region has a distinct
opportunity to improve its economic competitiveness: Our vibrant digital community is one of the most productive and Across the North East, advanced manufacturing and engineering are
fastest developing in the UK, across industry and public services. globally focused with strong clusters in automotive manufacturing.
Digital A combination of start-up, high-growth and established businesses Manufacturing accounts for 15% of our GVA and 11% of employment.
exist across the region.
Nissan Motor Manufacturing UK, based in Sunderland, employs
PROTO, an emerging technology centre, located in Gateshead, is over 6,000 people and supports over 27,000 supply chain jobs,
Advanced manufacturing home to some of the region’s most innovative businesses. The 75% of which are in the North East. IAMP is designated a Nationally
Digital Catapult Centre in Sunderland provides localised and tailored Significant Infrastructure Project (NSIP) by the UK Government
Health and life sciences services to drive digital adoption across the North East. and has the potential to deliver over 7,000 new jobs over the next
10-15 years.
In the near future, the North Atlantic Optical Fibre Loop cable
will link Stellium Datacenters in North Tyneside - the largest
Offshore, subsea and energy technology purpose-built datacentre campus in the UK - to mainland Europe,
giving the region faster and more reliable digital connectivity and
interconnecting national and international networks.
As well as this, our schools, colleges and universities are leading the
development and uptake of digital skills.
The Covid-19 pandemic accelerated the demand, ambition and
delivery of digital transformation, and has presented our region with
significant opportunities as well as considerable challenges.
PROTO in Gateshead – an emerging technology centre home to some of Nissan UK and IAMP – connecting these major employment sites to our
the region’s most innovative businesses public and sustainable transport network is a key element of our Plan.
North East Transport Plan 12Our economy
Urban events, rural getaways
Health and life sciences Offshore, subsea and energy technology
The Great North Run brings 43,000 participants and supporters to
our region each year. The logistics of the event rely heavily on our
Our region is home to pharmaceutical manufacturing and world There are huge economic, social and environmental opportunities transport network and it is a key contributor to our visitor economy
health and life science innovation. In combination with the NHS and for the North East to contribute to new solutions that provide clean, in our cities.
our universities, this is our largest sector. secure and accessible energy. Our assets are categorised into three
key areas: regional energy, offshore energy and subsea technology, Our rural economy, particularly in Durham and Northumberland,
The Newcastle Campus for Ageing and Vitality is Europe’s largest demonstration and innovation. places a significant reliance on tourism. In 2018, tourism made
multidisciplinary site focused on ageing and the National Innovation up 11.8% of Northumberland's economy, 2.7% higher than the
Centre for Ageing will drive innovation delivery in this area. The Port of Blyth is a nationally significant offshore energy hub. national average, and it contributes £665 million to the economy,
In 2017, Northumberland generated the second highest amount of underpinning an estimated 1,500 jobs. The growth in ‘staycations’
electricity from onshore wind of any English local authority. and people seeking holidays in more remote outside spaces also
A March 2020 research study found that the total number of jobs benefitted rural tourism in the North East in 2020.
created in and supported by the supply chain for offshore wind On average, between 2017 and 2019, 3.4 million trips were taken
could reach 8,600 in the North East by 2025. each year to the North East. These equated to 1.06 million nights
per year and the annual value of these trips was £656 million
(Visit England).
Newcastle Helix – home to world-leading Health and Life Port of Blyth in Northumberland – the second largest port in the region Beamish in County Durham– the living museum of the North
sciences research by turnover and a nationally significant offshore energy hub
Key insight
These sectors are critical to harnessing future growth,
and our transport networks have a role to play in
facilitating that potential, by moving people and goods.
Improving connections from our major employment
sites to our public and sustainable transport network is
also a key element of our Plan.
North East Transport Plan 13Our health and social inequalities
Deprivation and Inequality
Pockets of health and income inequalities are seen
across the North East, with deprivation being largely
concentrated in urban areas. Public transport provision is
also poor in some of our more deprived urban areas.
The 2019 Index of Multiple Deprivation (IMD) concluded
Least deprived decile
that all areas of Tyne and Wear have above average
levels of multiple deprivation. Accessible public transport Third to fifth most deprived decile
which allows people to reach employment, education and
Second most deprived decile
training opportunities outside of their immediate area can
help to reduce these disparities. Most deprived decile
In the map to the right, the darkest shaded areas are Local Authority Boundaries
within the most deprived 10% in England, with the next
darkest within the second most deprived 10%. The lightest
shading shows areas among the least deprived 50%.
Some of the most deprived areas in the North East border
some of the least deprived areas.
Transport and socio-economic inequality are linked.
Inequalities in the provision of transport services are
strongly linked with where people live, and the associated
differences in access to employment, healthcare,
education, and local shops. The ‘Making the right travel
choice’ policy page details ‘Transport poverty’.
The map shows lower layer super output areas (LSOAs).
They are the most used small area geography for statistics
Index of Multiple Deprivation deciles – North East LSOAs, 2019
North East Transport Plan 14Our health and social inequalities
Household poverty
Northumberland 75 83 92 Between 2016 to 2019, 19% of people in the North East region were
Newcastle 77 82 88 living in households with below 60% of median household income
before housing costs. This compares to 17% across England as a
North Tyneside 78 82 88 whole.
Gateshead 78 81 87
If housing costs are included, in the North East region 35% of
South Tyneside 77 82 89
children, 24% of working age people and 14% of pensioners lived in
Sunderland 75 81 86 households in poverty, compared to, respectively, 31%, 21% and 16%
for England as whole.
County Durham 77 82 87
Quality of employment opportunities
Northumberland 71 80 88 In the last quarter of 2019, 47,000 individuals in the North East
Newcastle 78 84
region were employed on a zero-hours contract. This is equivalent
71
to 3.9% of those in employment – the second highest rate amongst
North Tyneside 72 78 83 English regions.
Gateshead 72 77 85
In 2018, the Low Pay Commission estimated that about 74,500
South Tyneside 72 77 83 employees in the North East were paid at or below the National
Sunderland 68 77 82 Living Wage (NLW) or equivalent for their age group. This is 9.6%
of all employees, a higher percentage than England (6.9%) and
County Durham 72 78 84
England excluding London (7.5%).
An estimated 20,000 jobs in the North East region were paid below
Life expectancy at birth – median, minimum and maximum values within North East local authority areas, 2013-2017 the National Minimum Wage (NMW) or equivalent in 2019, about 1.9%
of the total. This is the highest percentage of any English region.
Free school meals
Life expectancy
Life expectancy at birth for both men and In the North East, almost a quarter of pupils are eligible for free
Estimates of life expectancy at a local authority level are similar
women is about one year lower in the region school meals, the highest proportion of any English region.
across the North East LEP area. However, this conceals major
compared with England. Similarly, healthy life differences within each local authority which can be seen using
expectancy is about four years lower. small area (MSOA) data. There are gaps of nine years or more
between highest and lowest life expectancy for both males and Addressing these challenges and embracing
Life expectancy at birth in the UK in 2017 to 2019 was the opportunities will allow us to overcome
females in all seven North East local authorities. The largest range is
79.4 years for males and 83.1 years for females. inequality and grow our economy, creating
in Northumberland in both cases.
a faster, more attractive and affordable
Disability transport system.
Transport can help to reduce inequalities by enabling people to
access a range of services quickly and easily. Good transport links The incidence of disability is higher in the North East region than
also play a role in reducing deprivation by enabling people to England, with 28% of the North East population having a disability
access job opportunities which in turn can improve quality of life and in 2018/19, compared to just 21% across England. A person is
reduce inequality. considered to have a disability if they have a long-standing illness,
disability or impairment which causes substantial difficulty with day-
to-day activities.
We will ensure that our transport network leaves no one and
nowhere behind and is accessible to all.
North East Transport Plan 15Our geography and people
The North East is diverse, comprising a mix of urban and rural Our people Population
communities with a proud heritage and flexible economy that make
our region an attractive place to live, learn and do business. But above all, it is our people that make our region unique. The Age profile
North East is home to just under two million people who want to The proportion of the population that are of working age (aged 16 to
Located between Scotland, Cumbria, the Tees Valley, North contribute to moving our country forward. 64) in the North East is 62.8%, similar to that of England 62.6%.
Yorkshire and the North Sea, it consists of seven council areas in two
Combined Authorities: However, we have a larger proportion of our population aged 50
to 64 and 65+ and a smaller proportion of people aged 0 to 15 and
• The North East Combined Authority (comprising Durham,
25 to 49 compared to the national average. This means that our
Gateshead, South Tyneside and Sunderland)
population is ageing and the infographic below shows that by 2035
• The North of Tyne Combined Authority (comprising Newcastle, more of our residents are expected to be of retirement age and
North Tyneside and Northumberland) Diverse fewer will be of working age.
Two million Ageing
Our mix of urban, suburban and rural landscapes results in urban /
people population
complex demands for travel and is reflected in our varied transport rural mix
challenges, from rural isolation in our remoter areas to poor air
Per 100 people living in our region
quality and congestion in parts of our cities.
Our cities, towns, villages and countryside are home to a wide range 2020
Population 2019 Rural* % Urban* %
of leisure, cultural, sporting and historical attractions, including two
UNESCO World Heritage sites (Hadrian’s Wall and Durham Cathedral County Durham 530,094 (27%) 45 55
and Castle). The region also boasts miles of unspoilt coastline as 17 young people
well as Northumberland National Park. Gateshead 202,055 (10%) 8 92
The North East is well connected to the UK, Europe and the rest of Newcastle 302,820 (15%) 2 98
the world by rail, sea, road and air through key gateways for freight 62 working age
and passengers including mainline rail stations, five sea ports and North Tyneside 207,913 (10%) 4 96
Newcastle International Airport.
Northumberland 322,434 (16%) 46 54
South Tyneside 150,976 (8%) 0.4 99.6 20 retired
Sunderland 277,705 (14%) 1 99
North East 1,993,997
2035
* Based on Rural Urban Classification (2011) of Local Authority Districts in England
16 young people
Key insight
Our Plan considers different solutions for different 59 working age
communities across our region as we map out how to
develop the North East transport network and grow our
economy by 2035.
25 retired
©2019, Chris Foster, Sustrans all rights reserved
North East Transport Plan 16Our geography and people
Skills Apprenticeships
The working age population of the North East has a lower In 2018/19, there were 16,990 apprenticeship starts in the North East.
qualifications profile than England as a whole. A higher proportion of
Over 80% of North East apprenticeship starts were in one of four
those aged 16 to 64 have no qualifications and fewer are qualified to
subject areas:
degree-level or above (NVQ Level 4 or above). However, the North
East has made progress on this since 2014, with the percentage • Business, administration and law (32%)
of people with higher level qualifications increasing and the • Health, public services and care (22%)
percentage with none decreasing.
• Engineering and manufacturing technologies (16%)
• Retail and commercial enterprise (11%)
Education
Although the North East is home to just 3.6% of England’s working
The region’s academic sector includes four major universities:
age population, the proportions of apprenticeship starts in 2018/19
Durham, Newcastle, Northumbria and Sunderland.
were higher:
In 2018/19, North East universities had almost 90,000 undergraduate
• 4.3% of all apprenticeships in England
and postgraduate students.
• 4.5% of intermediate apprenticeships
The North East has nine further education colleges: • 4.3% of advanced apprenticeships
• Bishop Auckland College • 4.1% of higher apprenticeships
• Derwentside College In particular, the North East had:
• East Durham College
• 6.3% of all apprenticeship starts in construction, planning and the
• Gateshead College
built environment
• Newcastle College
• 5.8% of higher apprenticeship starts in engineering and
• New College Durham manufacturing technologies
• Northumberland College • 4.5% of higher apprenticeship starts in information and
• Sunderland College communication technology
• Tyne Coast College
We will use transport to improve health
and wellbeing outcomes for local people,
enabling the North East to attain health levels
at least equal to other regions in the UK,
achieving a Healthier North East.
North East Transport Plan 17Our transport network and travel habits
The infographics on this and the next pages show a
range of facts and information about our transport
network. They demonstrate that our travel patterns
Car occupancy by journey purpose Congestion on our region’s Strategic
are complex, but we know that commuting in our
and car sharing to work 2017/18 Road Network and how it compares
region is dominated by car use (60.5%). Travel on foot
is just over 10% over short distances, while bus (10%)
and Metro (3%) are also important contributors. Car occupancy 2017/18 Strategic Road Network:
This only represents trips taken for work purposes, which is around congestion = overage delay
15% of all trips in our region, and the low share of the Metro is Leisure: (seconds per vehicle mile)
because it operates only within Tyne and Wear, while the above
figures and the statistics on the following pages show the total
number of travel to work journeys across the entire region.
2.0 Ranked 5th out of 9 English regions for congestion
Yorkshire and The Humber best, London worst
Of the LA7, 5 exceed national average congestion
Integration Commuting: Sunderland and County Durham below average
Our region currently has the basis of a fully integrated public
transport network. Currently, our ticketing offer does include some 1.2 1% improvement in LA7 between 2017 - 2018
Compared to 2% worsening in North East
products that allow interchange between different operators
and types of transport. New technology has also helped make 12.1 seconds of delay per vehicle mile in LA7
comprehensive information more easily available. However, the Compared to the best, Harrow at 3.8 seconds
Overall: and the worst, Sandwell at 48.2 seconds
complex range of brands, fares offers and timetables has significant
limitations – for example not all the tickets valid on different forms
of public transport in Tyne and Wear currently extend across the
1.6
whole of our region. In addition, some types of ticket still exist only
in paper versions rather than using smarter forms of payment, while Over last 10 years: 8 roads
on the Strategic
timetables at important interchange points are not co-ordinated. Road Network in LA7
1.2 mins A1 | A1(M)
slower commute A19 | A194(M)
0.5 miles A184 | A66
Therefore, by 2035 we want to create a properly
13% longer commute A69 | A696
integrated and efficient public transport network
across the whole of our region, including simpler
ticketing and payment, easily available and accurate of commuters
travel information and seamless interchange between car share
different forms of transport.
2017/18
North East Transport Plan 18You can also read