Recommendations for Green and Healthy Sustainable Transport - "Building Forward Better"
←
→
Page content transcription
If your browser does not render page correctly, please read the page content below
Recommendations for Green and
 Healthy Sustainable Transport –
      “Building Forward Better”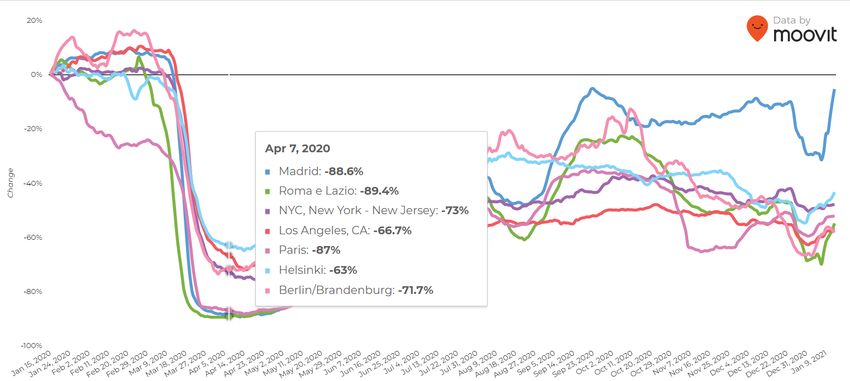
UNITED NATIONS ECONOMIC COMMISSION FOR EUROPE

Recommendations for Green and
Healthy Sustainable Transport –
   “Building Forward Better”

                   United Nations
                      Geneva, 2021
ii RECOMMENDATIONS FOR GREEN AND HEALTHY SUSTAINABLE TRANSPORT – “BUILDING FORWARD BETTER”
© 2021 United Nations
All rights reserved worldwide
Requests to reproduce excerpts or to photocopy should be addressed to the Copyright Clearance
Center at copyright.com.
All other queries on rights and licenses, including subsidiary rights, should be addressed to:
United Nations Publications,
405 East 42nd Street, S-09FW001,
New York, NY 10017, United States of America.
Email: permissions@un.org;
website: https://shop.un.org.
The findings, interpretations, and conclusions expressed herein are those of the author(s) and do
not necessarily reflect the views of the United Nations or its officials or member States.
The designations employed and the presentation of material on any map in this work do not
imply the expression of any opinion whatsoever on the part of the United Nations concerning
the legal status of any country, territory, city or area or of its authorities, or concerning the
delimitation of its frontiers or boundaries. Mention of a commercial company, product or service
herein does not imply endorsement by the United Nations or its Member States.
United Nations publication issued by the United Nations Economic Commission for Europe.
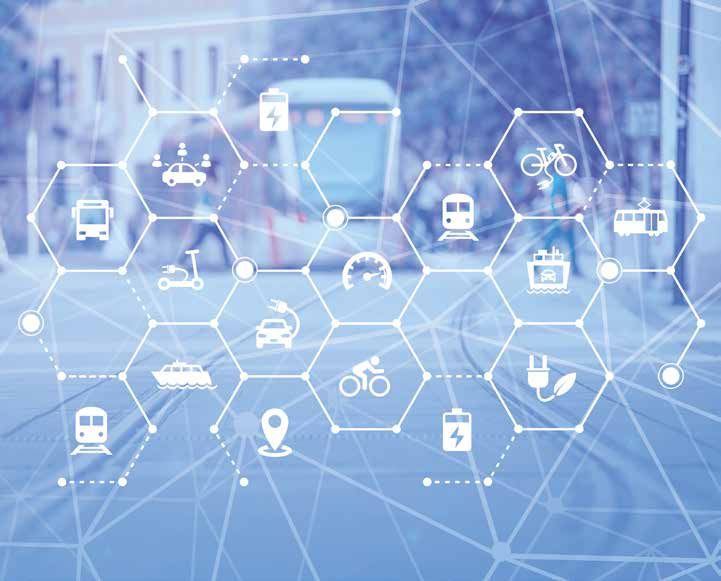
Photo credits: cover page – depositphotos.com.
ECE/AC.21/9
eIBSN: 978-92-1-005691-5RECOMMENDATIONS FOR GREEN AND HEALTHY SUSTAINABLE TRANSPORT – “BUILDING FORWARD BETTER” iii ACKNOWLEDGEMENTS This publication was developed within the Transport, Health and Environment Pan-European Programme (THE PEP). The “Recommendations for Green and Healthy Sustainable Transport – Building Forward Better” were developed thanks to the hard work of members of task force between April 2020 and January 2021. Experts from around the world dedicated a significant amount of their time to discussing, analysing and identifying the challenges and outcomes of the coronavirus disease (COVID-19) pandemic for the transport sector. Their deliberations led to the formulation of the recommendations proposed within the present publication. THE PEP secretariat was able to compile this publication thanks to the contributions and dedication of the following task force members, who authored parts of the document: Arianna Americo, Sergei Andreev, Yasmina Baaba, Mathew Baldwin, Ben Beck, Angelika Berger, Luana-Maria Bidasca, Matic Branislava, Lorenzo Casullo, Mary Crass, Marianne Dalgard, Elois Divol, Vadim Donchenko, Henrik Duus, Brian Evans, Biljana Filipovic, Andreas Friedwagner, Roberta Frisoni, Mario Fruianu, Miriam Gerlofs-Nijland, Andrea Giuricin, Pedro Homem de Gouveia, David Howard, Chris Irwin, Larisa Karpuk, Clemens Konrad, Sebastien Lesterle, Vladimir Lugovenko, Manuel Marsilio, Yonne Mulder, Renate Nagy, Laura Oliverio, Dmitry Osipovskiy, Marco Percoco, Piotr Rapacz, Matthias Rinderknecht, Vigdis Ronning, Anna-Lena Scherer, Ion Shalaru, Sylvia Skabrina, Sonja Spiegel, Vasilisa Sokolova, Brigit Staatsen, Enrico Stefano, Robert Thaler, Nino Tkhilava, Philip Turner, Andreas Unterstaller, Karen Vancluysen, Ağça Gül Yilmaz, Nicholas Bonvoisin, Nino Sharashidze, Virginia Fuse, Francesca Racioppi, Massimo Cozzone and Amy Choi. The compilation of the publication was coordinated by Francesco Dionori of the United Nations Economic Commission for Europe (UNECE) Sustainable Transport Division (who also co-authored some of the sections) with the support of Heini Salonen from the UNECE Sustainable Transport Division and edited by Nicholas Bonvoisin and Nicholas Aspin. The publication was prepared under the guidance of the chair of the task force, Robert Thaler (Austria). THE PEP Bureau and Steering Committee commented on an advanced draft of the publication.
iv                                                   RECOMMENDATIONS FOR GREEN AND HEALTHY SUSTAINABLE TRANSPORT – “BUILDING FORWARD BETTER”

CONTENTS

I.            Introduction.. . . . . . . . . . . . . . . . . . . . . . . . . . . . . . . . . . . . . . . . . . . . . . . . . . . . . . . . . . . . . . . . . . . . . . . . . . . . . . . .      1
              A.            Background....................................................................................................................................................       1
              B.            Current situation of the transport sector and outlook........................................................                      2
                            1. The transport sector pre-2020..................................................................................................2
                            2. Impacts of transport on environment and health.......................................................                                                             3
                            3. The impact of COVID-19 on transport.................................................................................                                              7
                            4. Air pollution during COVID-19 restrictions ......................................................................                                                11

II.           Actions for green and healthy sustainable transport. . . . . . . . . . . . . . . . . . . . . . . . . . . . . . . .                                                                12
              A.            A new future for transport – a call for action............................................................................                                          12
              B.            The development of key recommendations............................................................................                                                  13
              C.            Theme 1 “Consideration of public space allocation for all modes of
                            movement in the urban, peri-urban and rural environments, with emphasis
                            on the opportunities offered through spatial planning
                            and infrastructure investment”..........................................................................................................                            15
              D.            Theme 2 “Increasing investment in public transport to meet current
                            and future needs, as well as to ensure that it is safe (and attractive to use)
                            for users and workers”..............................................................................................................................                22
              E.            Theme 3 “Encourage the adoption of e-mobility solutions as a fundamental
                            part of powering public transport and active mobility”....................................................                                                          28
              F.            Theme 4 “Introduce mobility management solutions to manage transport
                            demand in an environment-friendly and healthy way, taking into account
                            the user-perspective and raising awareness of transport users, to facilitate
                            the switch to greener modes of transport and to make the transport
                            system more efficient in the urban, suburban and rural environments”.................                                                                               34
              G.            Theme 5 “Facilitate the adoption of innovation and technology in
                            transport to increase accessibility and safety and to reduce emissions
                            and environmental impacts, leading to increased health benefits”...........................                                                                         39
              H.            Theme 6 “Supporting active mobility as a sustainable and healthy
                            mode of transport.” ...................................................................................................................................             41
              I.            Theme 7 “Rebuilding the transport system in a fair and inclusive way, while
                            avoiding social disparities and particularly taking into account the needs
                            of vulnerable and disadvantaged groups in society. Taking into account
                            the social dimension of pandemics, as well as the need for a just transition
                            towards a green and healthy transport system”......................................................................                                                 45

III.          Key recommendations . . . . . . . . . . . . . . . . . . . . . . . . . . . . . . . . . . . . . . . . . . . . . . . . . . . . . . . . . . . . . . . . . . . .                       49

IV.           Next steps. . . . . . . . . . . . . . . . . . . . . . . . . . . . . . . . . . . . . . . . . . . . . . . . . . . . . . . . . . . . . . . . . . . . . . . . . . . . . . . . . . .   54

Bibliography. . . . . . . . . . . . . . . . . . . . . . . . . . . . . . . . . . . . . . . . . . . . . . . . . . . . . . . . . . . . . . . . . . . . . . . . . . . . . . . . . . . . . . . .     56
RECOMMENDATIONS FOR GREEN AND HEALTHY SUSTAINABLE TRANSPORT – “BUILDING FORWARD BETTER” v
LIST OF FIGURES
Figure I Pollutant emissions from transport (composite index of nitrogen oxides
(NOx), non-methane volatile organic compounds (NMVOCs) and
particulate matter (PM10)) in European Union-28, 1990–2017
(index 2000 = 100)..................................................................................................................................4
Figure II Percentage of the urban population of the European Union exposed to
air pollution concentrations above European Union and World Health
Organization reference values during the period 2016–2018....................................5
Figure III Deaths and injuries per 100,000 passenger cars, ECE region, 2009–2018...........6
Figure IV Weekly vehicle miles travelled in Berlin, London, New York and Paris, as a
percentage of pre-COVID-19 level, 2 March–22 June 2020.........................................7
Figure V Use of public transport in selected cities, 15 January 2020–9 January 2021.....8
Figure VI Use of bus and underground railway in London, 16 March–17 April 2020........9
Figure VII Use of public transport in the United Kingdom of Great Britain and
Northern Ireland, 1–3 May 2020 to 8–10 January 2021..................................................10
Figure VIII Avoid-Shift-Improve instruments..................................................................................................14
Figure IX Proposed micromobility definition and classification......................................................28RECOMMENDATIONS FOR GREEN AND HEALTHY SUSTAINABLE TRANSPORT – “BUILDING FORWARD BETTER” 1
I. INTRODUCTION
A. BACKGROUND
The pan-European region has been at the forefront in the development of sustainable mobility
solutions focusing on health, environment and prosperity. The Transport, Health and Environment
Pan-European Programme (THE PEP) brings the countries of the region together, unites three
core sectors of the economy – transport, health and environment – and provides countries
with the opportunity to share best practice and develop new policies. It therefore provides a
platform for accelerating transformation in the transport sector and making this transformation
irreversible. The recommendations, developed by a task force under THE PEP, will allow member
States to lock in sustainable transport solutions for the future, given the changes to the sector
brought on by the coronavirus (COVID-19) pandemic.
At the meeting of the Bureau of the Steering Committee of THE PEP in April 2020, member
States discussed the COVID-19 situation, its impact on transport, environment and health in their
countries and the need to take action. Participants agreed to establish a THE PEP Task Force on
“The Development of Green and Healthy Sustainable Transport Recommendations” to facilitate
the transition to a new normal with sustainable and healthy transport solutions at the heart of
decision-making and “building forward better”.
The objective of the Task Force was to make a synthesis of the “main lessons” learned from
the COVID-19 crisis and to propose a set of recommendations in order to support countries
in making the transition to green and healthy sustainable transport:1 a transition in line with
the goals of THE PEP,2 the Vienna Declaration of the Fifth High-Level Meeting of the Ministers of
Transport, Health and Environment, the 2030 Agenda for Sustainable Development and the Paris
Agreement,3 to name the key processes and instruments.
The Task Force was composed of over 50 experts from national ministries, international
organizations, city authorities, intergovernmental and non-governmental organizations (NGOs),
academia and industry. The Task Force was chaired by the Chair of THE PEP Steering Committee,
Mr. Robert Thaler (Austria).
The Task Force held eight monthly virtual meetings and, based on agreed terms of reference:
• Exchanged experiences and best practice from national actions to counter the effects of
COVID-19
• Established a framework under which the Task Force would function
• Developed common views on what should be the key themes for discussion in the
recommendations
• Agreed on a set of recommendations for the final document.
1
See ECE/AC.21/SC/2020/9-EUPCR2016697/5.3/9, paras. 1 and 2.
2
UNECE/World Health Organization (WHO) Regional Office for Europe, “Transport Health and Environment Pan-European
Programme: From Paris 2014 to Vienna 2019”, October 2015.
3
Available at https://unfccc.int/process-and-meetings/the-paris-agreement/the-paris-agreement.2 RECOMMENDATIONS FOR GREEN AND HEALTHY SUSTAINABLE TRANSPORT – “BUILDING FORWARD BETTER”
During this period, smaller, parallel drafting groups were set up to develop text for the
key themes identified by the Task Force as being fundamental to the development of the
recommendations.
The first draft of the recommendations was discussed at the meeting of the Steering Committee
of THE PEP in November 2020 and, following further consultations, was finalized in January
2021.4 The recommendations identified in chapter III below were then included in the Vienna
Declaration to be signed at the Fifth High-level Meeting on Transport, Health and Environment
in May 2021.
The remainder of this first chapter provides an overview of the current situation of the
transport sector, looking at the pre-COVID-19 situation as well as the transport effects
during the first lockdowns and the plans for the reopening phases. Chapter II opens with a
call for action for the future and describes the main themes that have been identified as key
areas for recommendations. Chapter III sets out the conclusions and recommendations for
member States. Chapter IV sets out the next steps for this work following the adoption of the
recommendations.
B. CURRENT SITUATION OF THE TRANSPORT SECTOR AND
OUTLOOK
1. THE TRANSPORT SECTOR PRE-2020
The car remains the main mode of transport across the region. According to Eurostat, in
relation to the European Union-28 member States,5 the market share of passenger road vehicle
transport in relation to all passenger transport increased from 82.5 per cent in 2000 to 83.3 per
cent in 2018. In comparison, railways had a market share of 8 per cent in 2018, compared to
7.1 per cent in 2000 and coaches, trolleybuses and buses had a share of 8.7 per cent, down
from 10.4 per cent in 2000. The share of passenger road vehicles is usually lower when looking
at cities only, but still remains the commonest mode in terms of the share in most cases.
The same is also true across the wider region of the UNECE where the car remains the main
mode of vehicle6 transport. Using UNECE data,7 passenger road vehicle transport market share
decreased from 93 per cent in 2000 to 89 per cent in 2018.8 In comparison, railways increased
from 1.6 per cent in 2000 to 2.3 per cent in 2018, and coaches, trolleybuses and buses from 5 per
cent to 8 per cent.
According to a 2014 Eurobarometer study,9 8 per cent of respondents said that, on a typical
day, cycling was their most often used mode of transport. Countries also report their own
data, though, data-collection methodologies can vary between countries, making data less
comparable. Recent national data show that there can be significant differences between
4
See ECE/AC.21/SC/2020/9-EUPCR2016697/5.3/9, paras. 3 and 4.
5
The 28 member States of the European Union, prior to the exit of the United Kingdom. Data from the Eurostat statistical
database https://ec.europa.eu/eurostat/data/database.
6
Data used here includes passenger cars, motorcycles, buses, trolleybuses and coaches and rail.
7
A selection of 13 countries based on data availability, data from the UNECE statistical database: https://w3.unece.org/PX-
Web/en.
8
Or latest available year.
9
European Commission, “Quality of Transport”, Special Eurobarometer 422a (December 2014), p. 12. Available at https://
ec.europa.eu/commfrontoffice/publicopinion/archives/ebs/ebs_422a_en.pdf.RECOMMENDATIONS FOR GREEN AND HEALTHY SUSTAINABLE TRANSPORT – “BUILDING FORWARD BETTER” 3
individual countries. For example, at the higher end, in 2016 the modal share of cycling was
27 per cent in the Netherlands,10 while, in 2017, Germany11 reported a share of 11 per cent.
At the lower end, in Portugal12 in 2016 the modal share of cycling was only 1 per cent, in Slovakia13
in 2017, 2 per cent, the same as in the United Kingdom of Great Britain and Northern Ireland14
in 2018. Although these numbers appear low, city-level data show that many cities have seen a
large growth in cycling in recent years.
The mode distribution of the freight sector is different, with rail having a significantly higher
share compared to passenger transport in many countries across the region, but as a whole, the
road sector remains dominant. This is even more pronounced in urban environments and other
settlements where rail and other non-road goods deliveries are extremely limited.
2. IMPACTS OF TRANSPORT ON ENVIRONMENT AND HEALTH
Transport, particularly road transport, has a negative effect on the environment and health. This
effect is exemplified by air and noise pollution, injuries, illnesses and deaths caused by poor road
safety, congestion and poor urban and spatial planning, and is exacerbated by physical inactivity
resulting from the use of transport modes on a daily basis.
In addition, in June 2019, the European Commission revised its calculations of the societal and
environmental impacts of transport.15 The total external environmental costs of transport (linked
to greenhouse gas emissions, local air pollution, noise, energy production, habitat damage), as
well as the costs of congestion and crashes in the European Union add up to almost €1 trillion
annually, with the urban share estimated to be at least 50 per cent. Road transport causes more
than 80 per cent of such external costs (approximately €620 billion caused by passengers and
€200 billion by freight), including road crash costs (some €280 billion), congestion costs (some
€270 billion) and environmental costs (some €270 billion).16
This is a very substantial increase in relation to calculations included in the 2013 Impact
Assessment, where total external costs of transport were estimated at €420 billion annually, with
the urban share estimated at €230 billion.17
To ensure good quality of life in cities and to make them more accessible, clean and competitive, a
modal shift towards sustainable modes of transport and public transport is necessary. Increasing
car traffic in cities and metropolitan areas leads to rising external costs relating to air pollution
and lost time, which consequently also negatively effects work-life balance.
10
Lucas Harms and Maarten Kansen, Netherlands Institute for Transport Policy Analysis, “Cycling Facts”, April 2018. Available at
https://www.government.nl/binaries/government/documents/reports/2018/04/01/cycling-facts-2018/Cycling+facts+2018.pdf.
11
German Federal Ministry of Transport and Digital Infrastructure, “Mobilität in Deutschland – MiD: Grafiken zum Rad-
verkehr und Fußverkehr”, p. 9 (in German only). Available at www.bmvi.de/SharedDocs/DE/Anlage/G/mid-analysen-
rad-fussverkehr-bilder.pdf?__blob=publicationFile.
12
Mark Sutton, “Portugal’s answer to upping cycling’s modal share? Start with the students”, Cycling Industry News, 27 May 2016.
Available at https://cyclingindustry.news/portugals-answer-to-upping-cyclings-modal-share-start-with-the-students/.
13
Cyclurban, “Slovakia”. Available at www.cyclurban.eu/countries/slovakia/#:~:text=In%.20Slovakia%2C%20cycling%20
has%20a,10%25%20cycling%20share%20by%202020.
14
Isi Avbulimen, United Kingdom of Great Britain and Northern Ireland, Department for Transport, “Walking and Cycling-
Statistics, England: 2018”, 31 July 2019. Available at https://assets.publishing.service.gov.uk/government/uploads/system/
uploads/attachment_data/file/821842/walking-and-cycling-statistics-2018-accessible.pdf.
15
European Commission, “Sustainable transport: Internalization of transport costs”, 29 January 2021. Available at https://ec.
europa.eu/transport/themes/sustainable/internalisation-transport-external-costs_en
16
Arno Schroten and others, “Sustainable Transport Infrastructure Charging and Internalization of Transport Externalities:
Executive summary”, (Luxembourg, Publications Office of the European Union, 2019), p. 7.
17
Ricardo-AEA, “Update of the Handbook on External Costs of Transport”, 8 January 2014. Available at https://ec.europa.eu/
transport/sites/transport/files/themes/sustainable/studies/doc/2014-handbook-external-costs-transport.pdf.4 RECOMMENDATIONS FOR GREEN AND HEALTHY SUSTAINABLE TRANSPORT – “BUILDING FORWARD BETTER”
Air pollution, of which transport is a significant cause, is a major health threat in Europe, causing
premature deaths and disease. Although air pollution from transport has been steadily declining
in the European Union in the past decades (see figure I below), it remains a concern. According
to European Environment Agency (EEA) data,18 inland transport (passenger and freight) is one
of the largest contributors to greenhouse gas emissions, responsible for about 22 per cent of all
emissions in the European Union, in 2017, with the road transport sector covering more than
two-thirds of that. Coupled with this, the road sector remains one of the biggest sources of
polluting emissions, including nitrogen oxides (NOx) (15 per cent) and 8 per cent of particulate
matter (PM2.5) emissions (the fourth-largest pollutant), but also of non-exhaust related pollutants
from brake, tyre and road wear.19
FIGURE I POLLUTANT EMISSIONS FROM TRANSPORT (COMPOSITE INDEX OF NITROGEN OXIDES (NOX),
NON-METHANE VOLATILE ORGANIC COMPOUNDS (NMVOCS) AND PARTICULATE MATTER (PM10))
IN EUROPEAN UNION-28, 1990–2017 (INDEX 2000 = 100)
140
120
100
80
60
40
20
0
1990
1991
1992
1993
1994
1995
1996
1997
1998
1999
2000
2001
2002
2003
2004
2005
2006
2007
2008
2009
2010
2011
2012
2013
2014
2015
2016
2017
Year
Source: Eurostat.20
EEA also estimates that, annually, 400,000 premature deaths in Europe are attributable to air
pollution. During the period 2016–2018, a significant proportion of the urban population of the
European Union was exposed to key air pollutants above European Union limit or target values
and above the health-based guidance values of the World Health Organization (WHO) as set out
in figure II below.
18
European Environment Agency (EEA), “Healthy environment, healthy lives: How the environment influences health and
well-being in Europe”, EEA Report, No. 21/2019 (Luxembourg, Publications Office of the European Union, 2020).
19
Data from the Eurostat statistical database https://ec.europa.eu/eurostat/data/database.
20
https://ec.europa.eu/eurostat/databrowser/view/t2020_rk300/default/table?lang=en.RECOMMENDATIONS FOR GREEN AND HEALTHY SUSTAINABLE TRANSPORT – “BUILDING FORWARD BETTER” 5
FIGURE II PERCENTAGE OF THE URBAN POPULATION OF THE EUROPEAN UNION EXPOSED TO AIR
POLLUTION CONCENTRATIONS ABOVE EUROPEAN UNION AND WORLD HEALTH ORGANIZATION
REFERENCE VALUES DURING THE PERIOD 2016–2018
EU limit/target values WHO guidelines
PM2.5 4-8% 74-78%
PM10 13-17% 43-48%
O3 12-34% 96-99%
NO2 1-7% 4-7%
BaP 15-20% 75-90%
SO2 < 1% 19-31%
Source: European Environment Agency (EEA), “Healthy environment, healthy lives: How the environment
influences health and well-being in Europe”, EEA Report, No. 21/2019 (Luxembourg, Publications Office of
the European Union, 2020), p. 68.
Abbreviations: PM2.5 , Particulate matter with a diameter of 2.5 µm or less; PM10 , particulate matter with a
diameter of 10 µm or less; O3 , ozone; NO2 , nitrogen dioxide; BaP, benzo[a]pyrene; SO2 , sulphur dioxide.
Maintaining a high level of road safety is one of the main challenges within the region.
Significant progress has been made in reducing the number of deaths and injuries (see
figure III below), but the numbers still remain too high. While the number of road deaths has
been steadily decreasing on some types of roads (motorways) and for some types of road
user (car drivers and passengers), the reductions have been much less marked for vulnerable
road users.21 Moreover, in the United States of America, mortality of pedestrians increased by
50 per cent in the last decade.22
Coupled with this is the problem of increased congestion. Rankings of cities made by a number
of international companies for 2019, based on mobile phone and global positioning system
(GPS) data, show that congestion levels in Europe decreased only in 30 out of 239 cities listed
compared to 2018.23
21
European Transport Safety Council (ETSC), “Safer roads, safer cities: How to improve urban road safety in the EU (PIN
Flash 37)”, 10 June 2019. Available at https://etsc.eu/safer-roads-safer-cities-how-to-improve-urban-road-safety-in-the-eu-
pin-flash-37/.
22
Governors Highway Safety Association, “Pedestrian Traffic Fatalities by State: 2019 Preliminary data” February 2020, P.5
https://www.ghsa.org/sites/default/files/2020-02/GHSA-Pedestrian-Spotlight-FINAL-rev2.pdf.
23
INRIX, “INRIX 2019 Global Traffic Scorecard”. Available at https://inrix.com/scorecard/? and TomTom Traffic Index Ranking 2019:
https://www.tomtom.com/en_gb/traffic-index/ranking/?country=AT,BE,BG,CZ,DK,EE,FI,FR,DE,GR,HU,IS,IE,IT,LV,LT,LU,NL,NO,PL,PT,
RO,RU,SK,SI,ES,SE,CH,TR,UA,UK.6 RECOMMENDATIONS FOR GREEN AND HEALTHY SUSTAINABLE TRANSPORT – “BUILDING FORWARD BETTER”
FIGURE III DEATHS AND INJURIES PER 100,000 PASSENGER CARS, ECE REGION, 2009–2018
1800 40000
1600 35000
1400
30000
Road traffic fatalities
Road traffic injuries
1200
25000
1000
20000
800
15000
600
10000
400
200 5000
0 0
2009 2010 2011 2012 2013 2014 2015 2016 2017 2018
Killed Injured
Source: UNECE Statistical Database.
Note: Only partial data available for 2018.
As a result of the increased use of motorized vehicles on a regular basis across the region, the
urban population tends to be less physically active. According to WHO,24 lack of physical activity
is one of the leading risk factors for noncommunicable diseases mortality. Insufficiently active
people have a 20 to 30 per cent increased risk of death compared to the sufficiently active.
Globally, 28 per cent of adults aged 18 or over were not sufficiently active in 2016 (23 per cent
of men and 32 per cent of women). This means they do not meet the global recommendations
of at least 150 minutes of moderate-intensity, or 75 minutes of vigorous-intensity, physical
activity per week. In high-income countries, 26 per cent of men and 35 per cent of women were
insufficiently physically active, compared to 12 per cent of men and 24 per cent of women in
low-income countries. Low or decreasing physical activity levels often correspond to high or
rising gross national product.25
The information provided in this section shows that, at the start of 2020, the transport sector
still had a long way to go before it could be identified as being green and healthy. THE PEP
has been working on a number of initiatives aimed at improving this sustainability through the
implementation of actions necessary to achieve its five priority goals.26 These initiatives have
come about primarily through the main activities of the Steering Committee and through a
number of partnerships including on cycling promotion, the Danube region, green jobs, eco-
driving, the integration of environment and health issues in urban and transport planning, and
other related activities such as on managed mobility.
24
WHO, “Physical activity”, factsheet, 26 November 2020. Available at www.who.int/news-room/fact-sheets/detail/physi-
cal-activity.
25
Ibid.
26
UNECE/World Health Organization (WHO) Regional Office for Europe, “Transport Health and Environment Pan-European
Programme: From Paris 2014 to Vienna 2019”, October 2015.RECOMMENDATIONS FOR GREEN AND HEALTHY SUSTAINABLE TRANSPORT – “BUILDING FORWARD BETTER” 7
3. THE IMPACT OF COVID-19 ON TRANSPORT
In the context described above, in spring 2020 the first wave of the COVID-19 pandemic triggered
a drastic response in countries around the world, with many cities going into complete lockdown.
This imposed restrictions on people’s movement, directly impacting traffic and the use of all
forms of transport. GPS27 and traffic volume data28 show that, in many normally congested cities,
traffic levels dropped by 70–80 per cent, and in some cities by even as much as over 95 per cent,
during the first lockdown phase. For example, the decline in vehicle miles travelled between
2 March and 22 June 2020 in Berlin, London, New York and Paris ranged from above 40 per cent
to 20 per cent compared to pre-COVID levels (see figure IV below). Of these cities, Paris was the
hardest hit, but traffic there also recovered fast after restrictions were lifted in May 2020. In the
other cities, traffic levels remained higher throughout the period, but recovery was slower.
FIGURE IV WEEKLY VEHICLE MILES TRAVELLED IN BERLIN, LONDON, NEW YORK AND PARIS, AS A
PERCENTAGE OF PRE-COVID-19 LEVEL, 2 MARCH–22 JUNE 2020
120%
100%
80%
60%
40%
20%
0%
22-Jun
1-Jun
8-Jun
13-Apr
20-Apr
27-Apr
6-Apr
15.juin
11-May
18-May
25-May
4-May
16-Mar
23-Mar
30-Mar
2-Mar
9-Mar
Berlin London New York Paris
Source: Traffic Technology Today, “New data assesses the impact of Covid-19 on UK and European traffic”.
Available at www.traffictechnologytoday.com/news/covid-19-news/feature-inrix-assesses-the-impact-of-
covid-19-on-uk-and-european-traffic.html.
27
Andy Marchant, “What can traffic data tell us about the impact of the coronavirus?”, TomTom, 17 April 2020. Available at
www.tomtom.com/blog/moving-world/covid-19-traffic/.
28
Ian Dickson, “Before and after COVID-19: Europe’s traffic congestion mapped”, HERE360, 10 April 2020. Available at https://360.
here.com/covid-19-impact-traffic-congestion.8 RECOMMENDATIONS FOR GREEN AND HEALTHY SUSTAINABLE TRANSPORT – “BUILDING FORWARD BETTER”
The freight transport sector was not immune to the effects of the first wave of COVID-19.
According to the freight tracking company Sixfold,29 truck traffic declined more than 50 per cent
in Spain, 46 per cent in France and 37 per cent in Italy due to lockdowns. In April 2020, Transport
Intelligence30 estimated that the road freight market in Europe could decline by as much as
17 per cent in 2020 and even in the most optimistic scenario almost 5 per cent. The International
Transport Forum31 estimates the decline in freight transport to be even larger. In Europe, the
reduction in inter-urban freight activity is projected to be about 40 per cent. However, the decline
in urban freight activity in Europe is estimated to be much less than this, around 12–14 per cent,
due to growth in online shopping and associated deliveries.
Similar impacts were reported on public transport. The mobility-as-a-service company Moovit
tracks the usage of public transport in cities around the world. Moovit’s Public Transit Index
shows a considerable fall in public transport use during the first wave of the COVID-19 pandemic,
which subsequently fluctuated at a lower-than-normal level in many cities (see figure V below)
also into 2021.
FIGURE V USE OF PUBLIC TRANSPORT IN SELECTED CITIES, 15 JANUARY 2020–9 JANUARY 2021
Source: Moovit, Moovit Global Public Transport Report 2020. Available at https://moovitapp.com/insights/
en/Moovit_Insights_Public_Transit_Index-countries.
Based on public transport data from London, the lockdown measures taken to respond to the
first wave of the pandemic were reflected in bus and underground railway usage, which fell to
only about 15 and 5 per cent, respectively, of the pre-pandemic level, from the end of March
2020 (see figure VI below).
29
Sixfold, “Effects of Covid-19 on Europe’s Road Freight Market”, 12 May 2020. Available at https://sixfold.com/news/effects-of-
covid-19-on-europe-s-road-freight-market.
30
Transport Intelligence, “European Road Freight Market Sizing 2020: COVID-19 impact analysis”, 15 April 2020. Available at
www.ti-insight.com/whitepapers/european-road-freight-market-sizing-2020-covid-19-impact-analysis-2/.
31
International Transport Forum, “How badly will the coronavirus crisis hit global freight?”, COVID-19 transport brief, 11 May
2020. Available at www.itf-oecd.org/sites/default/files/global-freight-covid-19.pdf.RECOMMENDATIONS FOR GREEN AND HEALTHY SUSTAINABLE TRANSPORT – “BUILDING FORWARD BETTER” 9
FIGURE VI USE OF BUS AND UNDERGROUND RAILWAY IN LONDON, 16 MARCH–17 APRIL 2020
90%
16 March: Advice to avoid travel and contact with others
80%
70%
20 March: Order to close pubs, restaurants and gyms
60%
Percent of usage
50%
40%
23 March: Nationwide lockdown
30%
20%
10%
0%
16.mars
18.mars
20.mars
22.mars
24.mars
26.mars
28.mars
30.mars
01.avr
03.avr
05.avr
07.avr
09.avr
11.avr
13.avr
15.avr
17.avr
Bus Tube
Source: Government of the United Kingdom of Great Britain and Northern Ireland, Available at www.
gov.uk/government/publications/slides-and-datasets-to-accompany-coronavirus-press-conference-22-
april-2020.
Abbreviations: Tube, underground railway.
Similar evidence on the impact of lockdowns during the first wave of COVID-19 has been
gathered in other cities. Research32 on the impact of COVID-19 on transport in Budapest shows
that the demand for transport halved during the spring 2020 lockdown, with an 80 per cent
decline in demand for public transport. There was also a significant shift in transport modes: the
use of private cars grew from 43 to 65 per cent compared to a 2018 baseline. Conversely, the
share of public transport decreased from 43 to 18 per cent.
During the pandemic, many people have shied away from using public transport for fear of
contracting COVID-19. Some of these passengers have shifted to using a private car as a result of
national authorities discouraging the use of public transport, but in many areas there is evidence
of growing enthusiasm for cycling. Several cities have responded positively to the increase in
cycling by improving infrastructure, although in some cases solutions have been temporary. The
European Cyclists’ Federation33 follows measures taken by authorities to promote or facilitate
cycling in cities. To date, over 2,000 km of infrastructural measures have been announced, of
which about 1,000 km have been implemented.
A study34 looking at different transport scenarios after the first COVID-19 lockdown in Italy
estimates the social costs and benefits of different policy choices. Under the assumption that
there are no policy interventions, in the most optimistic scenario after the lockdown, the modal
split between private cars and public transport is assumed to be 50-50. In this case, car-related
32
Peter Bucsky, “Modal share changes due to COVID-19: The case of Budapest”, Transportation Research Interdisciplinary Perspectives,
12 June 2020. Available at www.ncbi.nlm.nih.gov/pmc/articles/PMC7290209/.
33
European Cyclists’ Federation, “COVID-19 Cycling Measures Tracker”. Available at https://ecf.com/dashboard.
34
Paolo Ruffino, Matteo Jarre and Kees van Ommeren, “Social costs and benefits of post COVID-19 lockdown mobility scenarios
in Italy: Summary report”, Decisio (The Hague, Netherlands Enterprise Agency, 2020), pp. 10–15.10 RECOMMENDATIONS FOR GREEN AND HEALTHY SUSTAINABLE TRANSPORT – “BUILDING FORWARD BETTER”
social costs and congestion costs are estimated to be about €11 billion annually. In the
worst-case scenario, where all public transport users switch to cars, such costs would rise
to €21 billion. These costs would arise from increased congestion, longer journey times and
increased risk of road crashes. The study compares the “no policy intervention” scenario
to a situation where walking and cycling are encouraged. In this case, the assumption
is that a portion of car journeys are done by foot or bicycle instead. In the best case
scenario, public transport would capture 33 per cent of users, while 38 per cent of the
remaining journeys would be made by car, 50 per cent by cycling or e-cycling and 12 per
cent by foot, with the study estimating net benefits of €20 billion per year. The benefits
arise mainly from increased life expectancy, increased productivity and lower health-care
costs. The authors conclude that there is a strong basis for investing in and promoting
walking and cycling in cities.
According to a weekly survey conducted in the United Kingdom of Great Britain and Northern
Ireland since May 2020, after a slight recovery during the summer, the use of public transport
declined again in the autumn of 2020 during the second wave of COVID-19 (see figure VII below).
Road use has, after an increase in the summer, stayed relatively stable, with around 60 per cent
of those surveyed saying that they had driven a car or a van in the last seven days. The decline
in the use of public transport has not translated into a higher proportion of people walking
or cycling either. According to the survey, the proportion of cyclists has remained at 5–10 per
cent throughout the period. During the last quarter of 2020, the proportion of journeys made
on foot fluctuated around 40 per cent, down from a high of 50 per cent in September. Since
mid-December 2020, the use of public transport has shown signs of falling again, following new
lockdown measures introduced due to the worsening of the pandemic.
FIGURE VII USE OF PUBLIC TRANSPORT IN THE UNITED KINGDOM OF GREAT BRITAIN AND NORTHERN
IRELAND, 1–3 MAY 2020 TO 8–10 JANUARY 2021
50%
45%
40%
35%
30%
25%
20%
15%
10%
5%
0%
31 Jul-2 Aug
14-16 Aug
21-23 Aug
28-30 Aug
7-9 Aug
12-14 Jun
19-21 Jun
26-28 Jun
5-7 Jun
30 Oct-1 Nov
11-13 Sep
18-20 Sep
25-27 Sep
8-10 Jan
10-12 Jul
17-19 Jul
24-26 Jul
11-13 Dec
4-6 Sep
3-5 Jul
13-15 Nov
20-22 Nov
27-29 Nov
4-6 Dec
6-8 Nov
16-18 Oct
23-25 Oct
9-11 Oct
2-4 Oct
1-3-May
15-17 May
22-24 May
29-31 May
7-9 May
Public Transport Overall Bus Train
Source: Transport Focus, “Travel during Covid-19: Tracking research – week 34”, 15 January 2020, p. 2.
Available at https://d3cez36w5wymxj.cloudfront.net/wp-content/uploads/2021/01/14174435/Travel-
during-Covid-19-survey-15-January-2021.pdf.
By actively discouraging public transport use, many national and local authorities have sent
negative signals on the long-term sustainability of the transport sector. There is the risk that theRECOMMENDATIONS FOR GREEN AND HEALTHY SUSTAINABLE TRANSPORT – “BUILDING FORWARD BETTER” 11
short-term measures introduced to limit the spread of the virus (there is currently no evidence
to show that public transport is a vector for the virus)35 could have long-term impacts on the
use of public transport and its perceived risk.
4. AIR POLLUTION DURING COVID-19 RESTRICTIONS
Data show that the stark declines in transport use during lockdowns positively contributed
to air quality, with nitrogen dioxide (NO2) levels dropping in many countries. Menut and
others (2020)36 show that the lockdown measures in the United Kingdom of Great Britain and
Northern Ireland, the Netherlands, Germany, Spain, France and Italy resulted in a reduction
of NO2 concentrations of 20–50 per cent. Slightly smaller declines were visible for PM2.5 and
there was almost no change in ozone (O3) levels. This decline was of course accompanied by
a general decline in economic activity, the resulting temporary closure of factories and the
consequential fall in mobility.
Indeed, in several European cities, NO2 levels halved as a result of the first set of lockdowns
(see table below). However, data collected by the Centre for Research on Energy and Clean
Air show that pollution levels returned to previous levels after lockdown measures were lifted.
Cities with the largest reductions in pollution levels also saw the larges rebounds, indicating
that, in these cities, policies targeting transport-related emissions could lead to the largest
improvements in air quality.
Reduction in NO2 levels in selected European cities due to COVID-19 lockdown measures
City Reduction % City Reduction %
Bucharest 65 London 33
Paris 60 Copenhagen 42
Lisbon 44 Bern 37
Milan 47 Oslo 34
Zagreb 54 Munich 22
Brussels 49 Prague 29
Madrid 49 Ljubljana 31
Warsaw 35 Vienna 23
Moscow 35 Hamburg 20
Athens 32 Budapest 16
Barcelona 43 Berlin 18
Helsinki 47
Source: Hubert Thieriot and Lauri Myllyvirta, “Air pollution returns to European capitals: Paris faces largest
rebound”, Centre for Research on Energy and Clean Air. Available at https://energyandcleanair.org/wp/
wp-content/uploads/2020/06/202006-Europe-Rebound-4.pdf; and Moscow data from the Department of
Natural Resources Use and Environmental Protection, Government of Moscow.
While a fall in air pollution is welcome, the fact that it occurred against this background cannot
be seen as good news given the economic hardships that ensued and the fact that it is likely to
only be temporary.
35
University of Southampton (United Kingdom of Great Britain and Northern Ireland), “Study reveals COVID-19 transmission
rate on trains”, 31 July 2020. Available at www.southampton.ac.uk/news/2020/07/train-transmission.page; and Railtech.com,
“Research Deutsche Bahn: No increased risk corona infection train personnel”, 17 October 2020. Available at www.railtech.com/
coronavirus/2020/09/17/research-deutsche-bahn-no-increased-risk-corona-infection-train-personnel/?gdpr=accept.
36
Laurent Menut and others, “Impact of lockdown measures to combat Covid-19 on air quality over Western Europe”, Science
of the Total Environment, vol. 741, November 2020.12 RECOMMENDATIONS FOR GREEN AND HEALTHY SUSTAINABLE TRANSPORT – “BUILDING FORWARD BETTER”
II. ACTIONS FOR GREEN AND HEALTHY
SUSTAINABLE TRANSPORT
A. A NEW FUTURE FOR TRANSPORT – A CALL FOR ACTION
It is difficult to say how transport and mobility will evolve in the future based on the information
provided in the chapter above. What is clear is that transport and mobility as we know them today
are not sustainable. Traffic is the cause of several environmental, economic, social and health
challenges. Moreover, under the influence of the global increase in population and welfare, the
demand for transport will continue to grow. Public transport is fundamental to urban and inter-
urban transport but in many areas, it is not as competitive as the private car. Some parts of the
region are starting to embrace active mobility solutions, but this is still in its infancy across many
countries. This makes transforming transport and mobility for the better around public transport
and active mobility fundamental for a better future.
The COVID-19 pandemic has done untold damage to the economies of the region and has
exacerbated social inequality by increasing the socioeconomic divide and the gender gap in
many countries, with low-wage and part-time employees particularly affected. It has also created
some short-term benefits in terms of reduced air and noise pollution and increased attention to
promoting and providing for active mobility solutions. Furthermore, as traffic has fallen so too
has the number of road deaths (although in no way in a proportional manner). However, it is
also true that people have been encouraged to get back into their cars for their commute as the
common perception, often fuelled by advice from official sources, has been that public transport
is less safe; this has yet to be proved but is creating the need for increased investment in public
transport to match new requirements.
These positive and negative outcomes provide the international community with a springboard
to take action to facilitate the achievement of the Sustainable Development Goals (SDGs)37 and
the Paris Agreement.38 We must move beyond business-as-usual and work together to build
forward (not back) a cleaner, healthier and more prosperous community to meet mobility and
freight transport needs, focusing on creating a more sustainable future for the sector, in which
accessibility, efficiency, environment, safety and security are given an equal footing. This evolution
needs to consider the direct impacts of the COVID-19 pandemic, but also demographic changes
caused by an aging population and resilience in the face of future pandemics or similar national
and international disasters.
This aim needs to be embraced by Governments, city planners and citizens alike by integrating
transport planning and spatial planning, noting the central role of public transport, understanding
the key role that new technologies can play in sustainable mobility and incentivizing healthy and
environmentally aware consumer choices. Implementing actions need to induce behavioural
change by providing users with the capability, the opportunity and the motivation to change
their transport habits. This approach to rethinking and reorganizing the transport sector offers
economies a smart recovery and creates opportunities for green investments and a reduction
in inequalities, whilst recognizing that the (zero emission) private car will still have a role, albeit
significantly reduced, in the transport mix in member States.
37
See https://sdgs.un.org/goals.
38
See https://unfccc.int/process-and-meetings/the-paris-agreement/the-paris-agreement.RECOMMENDATIONS FOR GREEN AND HEALTHY SUSTAINABLE TRANSPORT – “BUILDING FORWARD BETTER” 13 A new approach offers opportunities and possibilities. It is important, therefore, to face the challenges together, by developing a common set of recommendations that can deal with the current situation and stand the test of time to facilitate the transition to more sustainable transport and mobility. The Task Force recognizes that this will not be easy to achieve as the themes and solutions identified below will need considerable time, effort and resources for successful implementation. Although it is also true that quick wins can be garnered from some of the proposed policy actions, the recommendations provided below should be seen as a framework for action. There is never a “one-size-fits-all” solution and good governance and patience, accompanied by tailored language and approaches, as well as the involvement of the sectors as a whole, will be fundamental in achieving success. B. THE DEVELOPMENT OF KEY RECOMMENDATIONS In order to develop a concrete set of recommendations, the Task Force agreed on the development of a key set of themes where a strong focus was placed on ensuring that the principle of “Avoid– Shift–Improve” (see figure VIII below) remains at the centre of actions to be taken. The principle seeks to achieve significant greenhouse gas emission reductions, reduced energy consumption and less congestion. Initially developed in the early 1990s in Germany, it is now considered as the “gold standard” in terms of how Governments can define policy initiatives to minimize the environmental impact of transport, leading to an improvement in citizens’ living standards. Inspired by the principles of sustainability, the approach focuses on people’s mobility needs instead of on car infrastructure. This principle has been applied throughout this document in a wholistic manner, taking into consideration the interaction of the three sectors of THE PEP, whilst at the same time recognizing that the transport and mobility sector needs to evolve beyond established practices and policies. Based on this, and on discussions within the Task Force, the following macro themes were agreed on as a basis for the recommendations: 1. Theme 1: Consider public space allocation for all modes of movement in the urban, peri- urban and rural environments with emphasis on the opportunities offered through spatial planning and infrastructure investment. 2. Theme 2: Increase investment in public transport to meet current and future needs as well as to ensure that it is safe (and attractive to use) for users and workers. 3. Theme 3: Encourage the adoption of e-mobility solutions as a fundamental part of powering public transport and active mobility. 4. Theme 4: Introduce mobility management solutions to manage transport demand in an environment-friendly and healthy way taking into account the user-perspective and raising awareness of transport users, to facilitate the switch to greener modes of transport and to make the transport system more efficient. A focus should also be on innovative solutions such as sharing mobility, tele-work or home office, green logistics and delivery and environment- friendly solutions for the “first and last mile” in the transport chain. 5. Theme 5: Facilitate the adoption of innovation and technology in transport to increase accessibility and safety and to reduce emissions and environmental impacts leading to increased health benefits.
14                             RECOMMENDATIONS FOR GREEN AND HEALTHY SUSTAINABLE TRANSPORT – “BUILDING FORWARD BETTER”

FIGURE VIII AVOID-SHIFT-IMPROVE INSTRUMENTS

"No travel                    "Active                       Public motorized               Individual motorized
Activity"                     Transport"                    Transport                      Transport
No desire or need to travel   Walking, cycling              Public transport (bus, rail)   Car, taxi motorcycle

               Avoid                                   Shift                                    Improve
          Avoid or reduce                                                                   Improve efficiency
                                                 Shift to more energy
         travel or the need                                                                  through vehicle
                                                   efficient modes
              to travel                                                                        technology

"Planning                     "Regulatory                   "Information                   "Investment
Instruments"                  Instruments"                  Instruments"                   Instruments"
"Land-use planning            Norms and standards           Public awareness               Fuel Improvement,
Planning/providing for        (emissions, safety)           campaigns, mobility            cleaner technologies,
public transport and non-     organisation (speed           management, marketing          end-of-pipe control
motorized modes"              limits, parking, road space   schemes, co-operative          devices, cleaner
                              allocation, production        agreements, eco-driving        production
                              processes)                    schemes

Source : Transport Urban Mobility Initiative, “Sustainable Urban Transport: Avoid–Shift–Improve (A–S–I)”
(Eschborn, German Agency for International Cooperation, 2019).
Note: Modified for translation purposes, original available at https://www.transformative-mobility.org/
assets/publications/ASI_TUMI_SUTP_iNUA_No-9_April-2019.pdf.

6. Theme 6: Support active mobility as a sustainable and healthy mode of transport.
7. Theme 7: Rebuild the transport system in a fair and inclusive way while avoiding social
   disparities and particularly considering the needs of vulnerable and disadvantaged groups
   in society. Take into account the social dimension of pandemics as well as the need for a just
   transition towards a green and healthy transport system.
The recommendations identified for each of these themes aim to reinforce positive actions that
have taken place during the pandemic but also to avoid a “lock-in” situation of negative practices
that have evolved. In doing so, the recommendations seek to set challenging but achievable
targets for member States. Each theme is structured as follows:

•    Introduction
•    The issue at hand (with the inclusion of relevant examples)
•    Outcomes and conclusions (then summarized in the form of key recommendations in
     chapter III).
RECOMMENDATIONS FOR GREEN AND HEALTHY SUSTAINABLE TRANSPORT – “BUILDING FORWARD BETTER” 15
The themes and related recommendations have been developed with the aim of going beyond
what has been the crux of activities within THE PEP in order to set the foundations for a transport
sector that can lead and shape the transformation of the urban and peri-urban environment,
including through appropriate spatial planning and economic policies, rather than having to
catch up as has been the case in the past.
C. THEME 1 “CONSIDERATION OF PUBLIC SPACE ALLOCATION
FOR ALL MODES OF MOVEMENT IN THE URBAN, PERI-URBAN
AND RURAL ENVIRONMENTS, WITH EMPHASIS ON THE
OPPORTUNITIES OFFERED THROUGH SPATIAL PLANNING
AND INFRASTRUCTURE INVESTMENT”
INTRODUCTION
Theme 1 examines social, economic and environmental considerations, reviews the emerging
importance of developing practices and explores their impact on mobility and on the
communities these systems serve, with particular emphasis on public space and spatial planning.
Wherever possible, the work is illustrated by examples of best practice that highlight where the
issue has been addressed successfully.
THE ISSUE AT HAND
What is the impetus for Green and Healthy Sustainable Transport? This Task Force title plainly
implies more than a recognition of the interaction between transportation, health and the
environment and underlines that the effectiveness and efficiency of transportation (from
the point of view of the public authority, the operator and the user) between nodes cannot
be an end in itself but rather must, of itself, be green, healthy and sustainable in respect of
those that it serves. In other words, there is implied a higher purpose to enable mobility for
people to access goods and services in a healthy, efficient, comfortable and environmentally
friendly manner. That this is true has been clear for some time. In the midst of a global
pandemic that shows little sign of abating until a vaccine can be found, this aim becomes
an imperative.39 Nowhere is this imperative more clearly evident than in the need for the
balanced and well-designed allocation of public space where the day-to-day interactions of
people’s lives are played out.
Today it is recognized globally that physical activity is important for physical and mental
health for all and therefore active travel for everyone becomes extremely important. The
mobility systems provided to deliver access to goods and services need to be designed in a
manner that encourages walking, cycling and wheeling,40 with an emphasis on connectivity
at the start and end of journeys and interchange along the route,41 and which help tackle
39
Paolo Ruffino, Matteo Jarre and Kees van Ommeren, “Social costs and benefits of post COVID-19 lockdown mobility scenar-
ios in Italy: Summary report”, Decisio (The Hague, Netherlands Enterprise Agency, 2020). Available at https://www.rvo.nl/
sites/default/files/2020/11/Social-costs-and-benefits-of-post-COVID-19-lockdown-mobility-scenarios-in-Italy.pdf.
40
Wheeling refers to all other forms of wheeled personal transportation (excluding cars and motorbikes).
41
European Environment Agency (EEA), “The first and last mile -– the key to sustainable urban transport, Transport and envi-
ronment report 2019”, (Luxembourg, Publications Office of the European Union, 2019). Available at https://www.eea.euro-
pa.eu/publications/the-first-and-last-mile.16 RECOMMENDATIONS FOR GREEN AND HEALTHY SUSTAINABLE TRANSPORT – “BUILDING FORWARD BETTER”
urban congestion, the costs of which put a drag of several hundreds of billions of euros
or United States dollars on the world economy.42 Of equal importance is the recognition
by most countries that decarbonization must proceed hand-in-hand with this aspiration to
deliver widely accessible active and eco-friendly movement systems.
There is a need therefore for an ambitious and imaginative aspiration or vision for
transportation across the ECE region that, within the overarching context of the SDGs
connects the issues of decarbonization, physical activity, environmental consciousness and
public health.
The first step in achieving this aim is to realise that all these objectives are inter-related and
action in pursuit of their achievement has to be integrated. It can no longer be the case that
programme for decarbonization, health and mobility can be seen and addressed as separate
matters.
As Higgs remarks in his recent book, “if we are to build the city of the future, it follows that we
must first of all imagine it”.43 Imagining and delivering such interconnection and integration
cannot be achieved only by analysis and quantification. It requires design solutions that
place people and their needs at the heart of the process. This means understanding not only
the principles of engineering and physical design of artefacts. It also requires that we must
master the opportunities presented by both service design (people-centred service design is
the activity of planning and organizing people, infrastructure, communication and material
components of a service in order to improve its quality and the interaction between the
service provider and its customers and their quality of life)44 and universal design (the design
and composition of an environment so that it can be accessed, understood and used to the
greatest extent possible by all people regardless of their age, size, gender, ability or disability).45
The allocation of public space should be designed to meet the needs of all people who wish
to use it, for example through the implementation of initiatives such as the “super blocks” in
Barcelona, Spain.46 While quick solutions of converting road space to cycle lanes can provide
benefits, it is also important to consider longer-term planning where a better solution may be
to create routes for cyclists through other public spaces.
Good examples include The Mayor of London Transport Strategy,47 adopted in 2018, that revolves
around the Healthy Street Approach. This approach uses 10 evidence-based indicators of what
makes streets attractive places. Working towards targets for these indicators will help to create
a healthier city, in which all people are included and can live well, and where inequalities are
reduced.48 The overarching goal of the Mayor’s Transport Strategy is that by 2041:
42
European Commission, “Sustainable transport infrastructure charging and internalisation of transport externalities Executive
summary”, (European Commission, Brussels, May 2019). Available at https://ec.europa.eu/transport/themes/sustainable/
internalisation-transport-external-costs.
43
Higgs, J., “The Future Starts Here: Adventures in the 21st Century”, Weidenfield & Nicolson, London, 2019.
44
See for example: Stickdorn, M. & Hormess, M., “This is Service Design Doing: Using Research and Customer Journey Maps
to Create Successful Services: Applying Service Design Thinking in the Real World”, 2016 and Down, L. Good Services: How to
Design Services that Work, BIS Publishers, Amsterdam, 2020.
45
The term universal design was coined by the architect Ronald Mace to describe the concept of designing all products and
the built environment to be aesthetic and usable to the greatest extent possible by everyone, regardless of their abilities.
See for example: Steinfeld, E. & Maisel, J, “Universal Design: Creating Inclusive Environments”, 2012.
46
Feargus O’Sullivan, Bloomberg, “Barcelona Will Supersize its Car-Free ‘Superblocks’”, 11 November 2020. Available at https://
www.bloomberg.com/news/articles/2020-11-11/barcelona-s-new-car-free-superblock-will-be-big
47
Mayor’s Transport Strategy 2018, Mayor of London. https://www.london.gov.uk/what-we-do/transport/our-vision-trans-
port/mayors-transport-strategy-2018?intcmp=46686.
48
Transport for London, “Healthy Streets for London”, (Transport for London, London, 2017). Available at http://content.tfl.gov.
uk/healthy-streets-for-london.pdf.You can also read