Age-friendly The New York Academy of Medicine - NLM Digital Collections
←
→
Page content transcription
If your browser does not render page correctly, please read the page content below

New York
                The
               Academy of Medicine
                          At the heart of urban health since 1847

Toward an
Age-friendly
        New York City: A Findings Report

              Fall 2008

Foreword
  Communities around the world are in the midst of major demographic transformation, and
New York City is no exception. New Yorkers are living longer and healthier lives. By 2030,
one-fifth of our City’s population will be over the age of 60; older adults will soon outnumber
school-aged children. The time is now to plan for our aging population.

  New York City has always been, and continues to be, a forward-looking city. We have focused
on our future in areas such as the environment, education, infrastructure, economic stability
for households, and energy. Yet, more planning is needed for our growing population of older
adults. Older people are the backbone of our society. They bring both stability and vitality to
our neighborhoods. The challenge before us is an opportunity to make New York City a caring
model for modern urban aging.

  The New York City Mayor’s Office and the New York City Council have joined together
with The New York Academy of Medicine and other stakeholders to evaluate the City’s age-
friendliness and to develop a new vision of what it means to grow older here. We are pleased to
have helped create a process for older adults to voice their hopes and dreams for a friendlier city.
The Age-friendly New York City Initiative has helped us focus on the needs of older adults, as
defined by older adults themselves.

  The findings presented in this special and timely report offer the opportunity to create
building blocks for the City to improve and to sustain the lives of older New Yorkers. It will
help guarantee that the people who made our city great will have a New York where they can
age happily in the city they love. While our efforts are focused on the needs of older people,
they improve quality of life for all. Modifications that make a city more “age-friendly” are good
for children, parents, and all communities. Helping older New Yorkers to thrive ensures that
New York City’s best days are now, as well as ahead.

Michael R. Bloomberg				                         Christine C. Quinn
Mayor of the City of New York		                  Speaker of the New York City Council

Acknowledgments

  The personal experience and the professional expertise of many people informed the development
of this report. We appreciate each of your efforts and apologize in advance for any oversight in these
acknowledgments.

  We could not have accomplished this assessment without the contributions of the more than 1,500
older New Yorkers from all five boroughs who gave so generously of their time. Thank you.

  We enjoyed great support from the Mayor’s Office and City Council Speaker. Thank you to Mayor
Michael R. Bloomberg, Deputy Mayor Linda Gibbs, and dedicated staff members, including Ronald
Richter, Wendy Perlmutter, and Marlon Williams. Thank you also to staff members of the various City
agencies who assisted with this effort, especially Linda Black, LaRay Brown, Kevin Jeffrey, Katherine
McVeigh, Sally Renfro, Caryn Resnick, Edwin Mendez-Santiago, Joseph Salvo, and Aviva Sufian.

  The New York City Council Speaker Christine C. Quinn was the first to be ignited by the vision
of an Age-friendly New York City and shared the vision with Chair of the City Council’s Aging
Committee Maria del Carmen Arroyo and Chair of the City Council’s Subcommittee on Senior
Centers James Vacca. We also thank the many other Council Members who actively participated in
and supported this effort. Thank you also to City Council staff members David Pristin and Yolanda
McBride, as well as others in the City Council’s Policy and Investigations, Member Services, Com-
munications, and Finance Divisions.

  The effort was guided from its inception by a distinguished Steering Committee including: Mary
Bassett, New York City Department of Health and Mental Hygiene; John Beard, The New York Acad-
emy of Medicine; Jo Ivey Boufford, The New York Academy of Medicine; Mimi Fahs, the Brookdale
Center for Healthy Aging & Longevity of Hunter College; Ruth Finkelstein, The New York Academy
of Medicine; Jill Gerson, Lehman College; Andrew Goodman, New York City Department of Health
and Mental Hygiene; Michael Gusmano, SUNY Downstate and the International Longevity Center-
USA; Judy Lear, Gray Panthers; Mary Mayer, United Nations International Federation on Ageing and
the New York Citizens’ Committee on Aging; Edwin Méndez-Santiago, New York City Department
for the Aging; Mia Oberlink, Center for Home Care Policy and Research at the Visiting Nurse Service
of New York; Nora O’Brien, The Brookdale Foundation; Shauneequa Owusu, Council of the City of
New York; Caryn Resnick, New York City Department for the Aging; Rosa Perla Resnick, Interna-
tional Association of Gerontology and Geriatrics, International Immigrants Foundation; Lani Sanjek,
New York Network for Action on Medicare and Social Security; Roger Sanjek, Queens College; Kris
Sartori, Council of the City of New York; Donna Seminara, Staten Island University Hospital; Marcia
Stein, Citymeals-on-Wheels; Marjorie Tiven, New York City Commission to the United Nations;
Fredda Vladeck, United Hospital Fund; and, Patricia Volland, The New York Academy of Medicine.
Thanks to the chairs of the expert roundtables as well as the participants. The roundtable chairs
include: Gordon Campbell, United Way of New York City; Jerilyn Perine, Citizens Housing and Plan-
ning Council; Gene Russianoff, NYPIRG’s Straphangers Campaign; Louise Seeley, City-Wide Task
Force on Housing Court; Walter Stafford, New York University’s Wagner School of Public Service;
and Kathryn Wylde, The Partnership for New York City.

   We wish to thank the following entities and organizations for their collaborative efforts: the Colum-
bia University Built Environment Project, the Charles B. Wang Community Health Center, One Stop
Senior Services, the American Bible Society, Amico Senior Center, the Carter Burden Center, Union
Settlement, Hamilton-Madison House, Grace Agard Senior Center, Services & Advocacy for GLBT
Elders (SAGE), the Lesbian, Gay, Bisexual & Transgender (LGBT) Community Center, Regional Aid
for Interim Needs (RAIN), the Harlem Honeys & Bears Swim Team, VISIONS/Services for the Blind
and Visually Impaired, Rochdale Community Center, Lincoln Hospital, the CYO Senior Guild of
Staten Island, the Joint Public Affairs Committee (JPAC), Jacob A. Riis Settlement House, Comuni-
life, the Institute for Puerto Rican and Hispanic Elderly, United Neighborhood Houses of New York,
the United Hospital Fund, UJA-Federation, CAMBA, Grandparents Empowerment Movement, and
the New York Chapter of Gray Panthers.

  We also want to thank the following individuals for their immeasurable help in carrying out this
effort: Rosemary Alcantara, Maria Alejandro, Adrian Bardoni, Faith Brigham, Monti Castaneda, De-
nali Dasguspta, Malini Doddamani, Jennifer Doeren, Rosa Gil, Amy Hart, Brad Hoylman, Nicholas
Inverso, Tom Kamber, Lorraine LaHuta, Crissy Liu, David Merin, Nancy Miller, Laurie Norris, Mary
Sanders, Linda Seligson, Shao-Chee Sim, Susan Stamler, James Quinn, Kathy Unsino, Jamie Van
Bremer, Joni Yoswein, and Shao Ping Yu.

  Special thanks to the New York City Council, The Fan Fox & Leslie R. Samuels Foundation, and
the Samuel and May Rudin Foundation, whose generous support made this project possible.

   Report Authors
   Ruth Finkelstein         Ana Garcia        Julie Netherland        Jessica Walker

   Contributors
   John Beard         Cyril Brosnan        Alex Kalache         Carolyn Stem
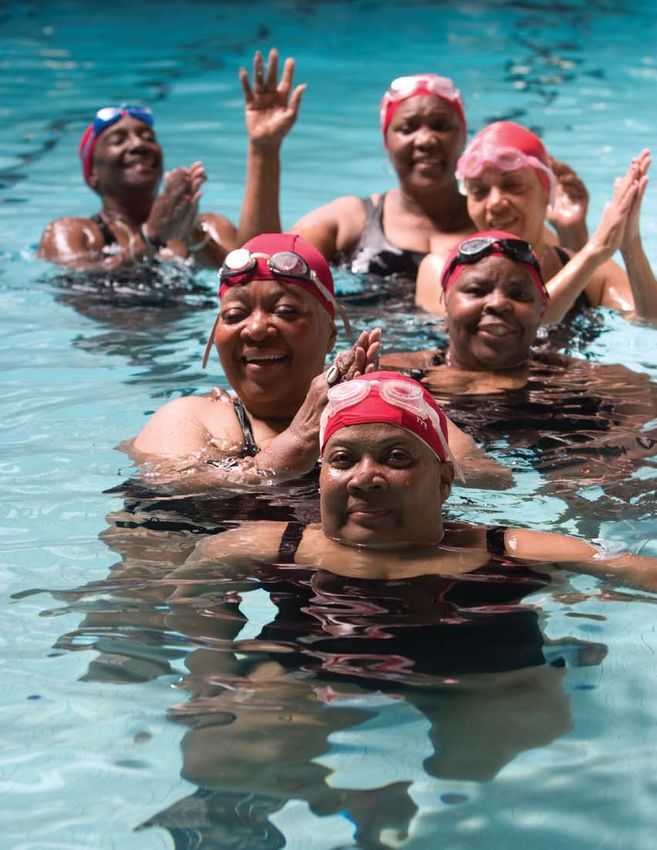
Table of Contents

                New York City: A Findings Report
                                                   2    Introduction
                                                   4    About the Initiative
                                                   6    Methodology
                                                   10   Key Findings
                                                        The City’s Older Population
                                                        Cross-cutting Themes
                                                        The Eight Domains of an Age-friendly City
      Age-friendly

                                                   50   Where do we go from here?
                                                   52   References
                                                   54   Maps
                                                        1. P
                                                            ercentage of Residents Age 65+ per Census Tract
                                                           (i.e. distribution of the City’s older population)
                                                        2. P
                                                            ercentage of Residents Age 65+ with a Disability
                                                           (by Census Tract)
                                                        3. P
                                                            overty Rate of Residents Age 65+ by Community
                                                           District using the Official U.S. Census Bureau’s
                                                           Definition of Poverty
                                                        4. P
                                                            overty Rate of Residents Age 65+ by Community
                                                           District using the City’s New Definition of
                                                           Poverty, as developed by the Center for Economic
Toward an

                                                           Opportunity
                                                           i. Comparative Chart of Maps 3 and 4

                                                        5. P
                                                            ercentage of Residents Age 65+ with “Unaffordable”
                                                           Housing Cost Burden (i.e. gross rent is equal to or
                                                           greater than 35 percent of income)
                                                        6. N
                                                            umber of “Walk-up” Residential Buildings per
                                                           Census Tract (i.e. apartment and other residential
                                                           buildings that lack elevators)
                                                        7. D
                                                            istance a Person Must Travel to Reach the Nearest
                                                           Bus Stop by Census Tract
                                                        8. Cleanliness Rating of Sidewalks by Census Tract
                                                        9. “Walkability” Rating by Census Tract
I. Introduction
   A century ago, life expectancy at birth for New      also tap the tremendous resources older people
Yorkers was a mere 40.6 years for boys and 44.9         can offer. Led by the World Health Organization,
years for girls.1 Today, life expectancy at birth       the Global Age-Friendly Cities project involves
is 75.7 for boys and 78.7 for girls.2 Most New          more than 35 cities, including Istanbul, London,
Yorkers can expect to live well beyond retirement       Melbourne, Mexico City, Moscow, Nairobi, New
into their 70s, 80s, and 90s. In fact, more and         Delhi, Rio de Janeiro, Shanghai, and Tokyo. The
more New Yorkers are in their 70s, 80s, and 90s.        New York Academy of Medicine (NYAM) is
Almost 12 percent of the population is over age         proud to have brought this exciting effort to New
65, and in some neighborhoods that proportion           York in 2007 with support from the New York
reaches 20 percent.3 These additional decades of        City Council and the Office of the Mayor.
life represent a triumph of science and civilization,
but they also pose a challenge: how can we adapt          Over the last year, our work has centered on a
our City and neighborhoods to make sure older           series of processes to speak with and hear directly
adults can lead happy, healthy, and productive          from older adults and their caregivers. In com-
lives? How can we become an age-friendly city?          munity forums, focus groups, and interviews
                                                        throughout the City, we asked older New Yorkers
  Age-friendly New York City is part of an interna-     to tell us what it’s like to walk down their street
tional effort to ensure the great cities of the world   and shop in their neighborhood, what they enjoy
not only support their residents as they age, but       and don’t enjoy about growing older, what changes

   2      Introduction
they would like, and what they hope never changes      senior center in the United States, the William
about New York. We also spoke with caregivers,         Hodson Community Center in the Bronx. The
service providers, and leaders in various public and   New York State Office for the Aging, one of the
private sectors in the City about the opportunities    first in the country, was created in 1961; and
and challenges for serving older populations.          the City’s Department for the Aging followed
                                                       in 1968. More recently, New York has been the
  This Findings Report presents the major themes       testing ground for naturally-occurring retirement
heard during the last year. A Technical Report         communities (NORCs), a revolutionary concept
with more detailed information about the City          for delivering community-based support and ser-
and its older population, the detailed data col-       vices for older people. And year after year, New
lected in the assessment process, and reviews of       York City Mayor Michael R. Bloomberg and the
the literature will be released separately. A third    New York City Council Speaker Christine C.
report with concrete recommendations for action        Quinn have stood together on the steps of City
will be issued in late 2008, following the first       Hall to announce a City Budget that supports
annual Age-Friendly New York City summit.              this pioneering work. The findings in this report
                                                       are offered to inspire that spirit of innovation
  New York has a strong tradition of respond-          with additional ideas that will benefit not only
ing to its older residents. In 1943, the New York      older adults, but also their families, caregivers,
City Department of Welfare established the first       and all New Yorkers for years to come.

                                       	Toward an Age-Friendly New York City                       3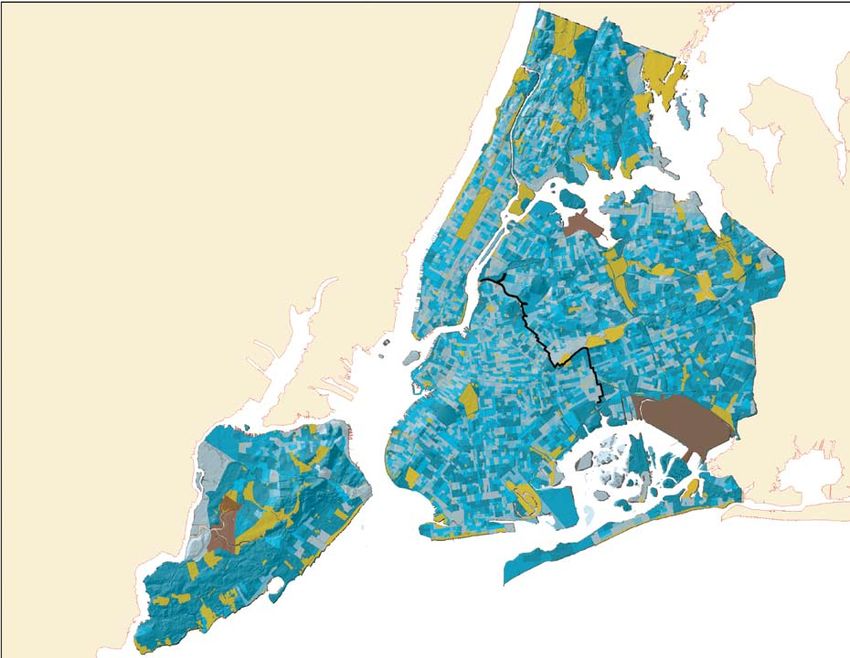
II. About the Initiative
  Age-friendly New York City is part of an in-            two trends, the WHO Global Age-friendly Cities
ternational effort begun by the World Health              project was developed.
Organization (WHO) to respond to two
significant demographic trends: urbanization                 Global Age-friendly Cities has involved 35 cities
and population aging. As of 2007, over half the           around the world in analyzing their communities
world’s population lives in cities, and by 2030,          and neighborhoods through the lens of the WHO
that proportion will rise to about three out of           Active Aging Framework. This framework shifts
every five people in the world. At the same time,         city planning away from a “needs-based” approach
improvements in public health have led to more            toward a “rights-based” approach that recognizes
and more people living longer lives. As a result,         people should have equal opportunity and treat-
the proportion of people aged 60 and over will            ment as they grow older. “Active aging” is about
likely double from 11 percent of the world’s              more than just “healthy aging”; the concept entails
population in 2006 to 22 percent by 2050.4 To             enhancing quality of life by optimizing opportuni-
help cities prepare for the convergence of these          ties for health, participation, and security as people

                                                                    Health and
                                  Economic
                                                                   Social Services
                                 Determinants

                                                                                    Behavioral
                     Social                         Active                         Determinants
                  Determinants                      Aging

                                                                        Personal
                                     Physical                         Determinants
                                   Environment

Figure 1. Determinants of Active Aging
Source: World Health Organization Global Age-Friendly Cities: A Guide, 2007.

   4 	About the Initiative
age.5 As indicated in Figure 1, the determinants dependence can be mediated through a healthy
of active aging include material conditions as well environment that provides access to things like
as social factors. Understanding from older adults nutritious foods, safe transportation, and good
how these determinants affect them personally work conditions. Furthermore, certain sup-
and function in their cities is a core activity of the ports such as comprehensive social services and
Global Age-friendly Cities project. environmental adaptations like well-maintained
sidewalks, legible street signage, and doors that
A second key concept for the age-friendly cities are easy to open can assist adults who might
movement is that cities should seek to extend the otherwise be homebound to regain or maintain
years an individual can live independently and independence and remain above the disability
above the “disability threshold” (Figure 2). Hu- threshold. This approach helps maximize older
man functional capacity inevitably declines with adults’ participation in society, but also helps
age, but the rate of that decline and the age at young children and disabled individuals of all
which people begin to experience disability and ages participate in the daily life of the city.
The presence
of supports can
help maintain
someone above
the disability
Functional Capacity
threshold
Disability Threshold
Early Life Adult Life Older Age
Growth and Maintaining highest Maintaining
Development possilbe level of independence and
function preventing disability
Age
Figure 2. Disability Threshold
Source: World Health Organization Global Age-friendly Cities: A Guide, 2007
Toward an Age-Friendly New York City 5III. Methodology
In July 2007, in partnership with the New York approach. Our aim with each method was to
City Mayor’s “A City for All Ages” Initiative and determine the existing age-friendliness of the city
the New York City Council, NYAM launched and identify ways in which it can become more
Age-friendly New York City, which adapted the age-friendly.
Global Age-friendly Cities project for New York.
The objective was to assess the city from the Community forums: NYAM and the New York
perspective of older residents in order to identify City Council co-sponsored 14 town-hall meetings
potential areas for improvement. Our overarching with older adults in Council districts throughout
question was: To what extent are the city’s services, the five boroughs. Nearly 1,500 people, the vast
settings, and structures inclusive of and accessible to majority of whom were older people and their
older people with varying needs and capabilities? caregivers, participated. The events were open to
To begin this process, a committee of local poli- the public and lasted between 90 minutes and
cymakers, service providers, community leaders, three hours. NYAM staff members facilitated the
researchers, and older residents was convened to meetings, often initiating discussion with infor-
advise NYAM on the design and implementation mal, open-ended questions such as “What do you
of the assessment, the analysis, and the dissemi- like about living in this community?” and then
nation of results and to connect to other efforts allowing participants to drive the discussion as
addressing aging in New York. much as possible. Two forums included transla-
tion into Spanish, one included translation into
The information-gathering process included both Cantonese and Mandarin, and numerous
the participatory mechanisms outlined below. others had informal translation into various
We sought to engage with as many sectors of city languages. The forums were held at the locatons
life as was practicable using a mixed-methods listed below:
• Adam Clayton Powell Government Building • Grace Agard Harewood Senior Center
Harlem (Manhattan) Fort Greene/Bedford-Stuyvesant (Brooklyn)
• American Bible Society • The
Lesbian, Gay, Bisexual & Transgender
Upper West Side (Manhattan) (LGBT) Community Center
Co-sponsored with One Stop Senior Services Greenwich Village (Manhattan)
Co-sponsored with Services & Advocacy for
• Amico Senior Center
GLBT Elders (SAGE)
Borough Park (Brooklyn)
• Lincoln Hospital Mott Haven (Bronx)
• Carter Burden Luncheon Center
Two forums held at this location
Upper East Side (Manhattan)
• RAIN East Tremont Senior Center
• City Hall Senior Center
East Tremont (Bronx)
Chinatown (Manhattan)
• Corsi Senior Center • Rochdale Community Center
Jamaica (Queens)
East Harlem (Manhattan)
• CYO Senior Center • VISIONS/Services for the Blind and Visually
Port Richmond (Staten Island) Impaired at Selis Manor
Chelsea (Manhattan)
6 MethodologyFocus groups: NYAM conducted six focus groups to capture the views of older adults often under- represented in other research, such as immigrants, isolated older adults, and those living in poverty. Working with community partners (Charles B. Wang Community Health Center, Jacob A. Riis Settlement House, the Grandparents Empower- ment Movement, and Comunilife), NYAM convened one group with grandparents who have primary parenting responsibility for their grand- children; one group with formerly homeless or HIV-infected older adults; one group conducted in Mandarin with Chinese residents of Flush- ing, Queens; and three additional groups with primarily low-income elders recruited through fliers posted in different neighborhoods. In total, we spoke with 46 older people (19 men and 27 women) through the focus groups. Each session lasted approximately 90 minutes. Of those who provided such information, about half indicated earning under $10,000 per year, with one man indicating he is currently homeless. Interviews: NYAM conducted one-on-one inter- views with 24 older immigrants living in Jackson Heights, Queens (17 women and seven men). Conducted primarily in Spanish, these interviews captured the perspectives of older immigrants from 12 countries (mostly in Latin America), who were between the ages of 64 and 87. Most of the interviewees had annual incomes of less than $10,000. Three people had been in the United States less than ten years, six people for between ten and 20 years, and 15 people for longer than 20 years. Constituent feedback forms: At the community forums, City Council members asked attendees to use a NYAM-developed questionnaire to rate several aspects of their local community and the
City Council Speaker Christine Quinn (right) and Council Member Gale Brewer at the community forum on the Upper West Side of Manhattan.

impact these features have on the well-being of                       roundtable chairs reviewed minutes summarizing
older residents. The feedback forms were also                         their session and were reconvened by NYAM to
made available on the initiative’s website and                        identify cross-cutting themes that emerged from
distributed to several community organizations                        their discussions.
to share with older clients. Over 600 completed
forms were collected. Approximately 83 percent                        Data mapping: NYAM’s Center for Urban
of respondents who gave their age indicated be-                       Epidemiologic Studies, in partnership with the
ing 65 years or older.                                                Columbia University Built Environment and
                                                                      Health Project, created maps describing New
Expert roundtables: The New York City Council                         York City’s older residents and the environments
and NYAM convened seven roundtable discussions                        in which they live. This mapping provides a
in January and February of 2008 with local experts                    visual understanding of what is occurring in lo-
and key leaders. The roundtables each had a distin-                   cal communities and reveals unexpected areas of
guished chairperson from the community who led                        need and opportunity.
a focused discussion on one of the following topics:
business, housing development, civic engagement,                      Request for information: NYAM issued a “Re-
transportation and outdoor spaces, tenant rights,                     quest for Information” to hear from stakeholders
social services, and health. The purpose was to                       about the policy and regulatory changes needed
allow experts from various sectors to identify ideas,                 to make the city more age-friendly. NYAM
concerns, and needs relating to the anticipated                       received 18 responses, with the majority com-
growth of the City’s older population and the con-                    ing from reputable not-for-profit organizations
tributions that these respective sectors can make                     such as the International Longevity Center, the
(and, in some instances, have already made) toward                    United Neighborhood Houses of New York, the
bettering the lives of New York’s older residents. At                 Federation of Protestant Welfare Agencies, and
the conclusion of this series of meetings, the seven                  the New York Citizens’ Committee on Aging.

    8        Methodology
At the expert roundtable on civic engagement (left to right): City Council Member David Weprin of Queens; Fredda Vladeck of the United
Hospital Fund; and Alex Kalache of NYAM.
Self-assessment of City agencies: As part of Limitations: This year-long assessment was both
its “A City for All Ages” project, the Mayor’s comprehensive and ground-breaking, but limita-
Office charged the commissioners of 22 City tions remain. While every effort was made to
agencies with engaging in an assessment of the include the perspectives of linguistic minorities,
“age-friendliness” of their agencies using an we did not have the resources to reach out to all
adaptation of the WHO protocol. The results of of the vast array of groups who live in New York.
that assessment are not included in this report, NYAM’s work in this area is ongoing with plans
but the process was an important step toward for additional work among aging immigrants.
aligning City agencies with the age-friendly In addition, we did not collect the perspectives
framework. of homebound or institutionalized older people
directly; rather we relied on advocates, caregivers,
Secondary research: NYAM conducted a friends, and service providers to communicate
review of existing literature and studies to gain their needs. Many of the methods we employed
information about the needs, experiences, and are qualitative and are not designed to answer
characteristics of the older population in New questions about frequency and prevalence. How-
York City and local, national, and international ever, we have incorporated quantitative informa-
aging trends. tion wherever possible to add context and give
added weight to many of the qualitative findings.
Website: A project website was launched at The Technical Report, which will be available
www.AgeFriendlyNYC.org to allow people to online at www.AgeFriendlyNYC.org, provides
learn more about the initiative and to e-mail sug- a more in-depth exploration into the context of
gestions for making the city more age-friendly. these findings as well as a more detailed render-
Launched in November 2007, more than 1,000 ing of all of the information collected through
people have visited the site as of August 2008. this consultative assessment process.
Toward an Age-Friendly New York City 9IV. Key Findings
The bulk of our findings are organized into the
eight domains of city life identified by the Global
Age-friendly Cities project (Figure 3).6 Through
our assessment, however, we also gained a clearer
view of the population of adults who make up our
older population and identified two important
themes that impact all eight of the domains. These
latter findings are outlined below and are followed
by the domain-specific findings. Examples of
suggestions for improvement collected through
this process—most of which are from older New
Yorkers themselves—are included throughout.
Tran
spo
sing
r
tati
Hou
Ou ion
on
td
andoor sp t i c ipat
r
buil aces l Pa
din
gs Age- S ocia
friendly
ort City Re
y supp ces soc spect a
n it r vi ial i nd
mu th se nclu
Com heal sion
Civ d emp
rma on
and
an
tion
info icati
ic p loym
arti
andmmun
cipa ent
Co
tion
Figure 3. Age-friendly domains. Source:
World Health Organization
Age-Friendly Cities: A Guide, 2007.
10 key FindingsThe City’s Older Population
New York’s older population is both growing Older New Yorkers have high rates of disability;
and growing older. In 2005, approximately disability need not mean dependence. Old age
1.3 million New York residents were age 60 or is often associated with multiple chronic condi-
older.7 By 2030, this age group will increase tions and disability. Indeed, in 2005, 43 percent
by nearly a half million people to 1.8 million.8 of non-institutionalized New Yorkers age 65 and
While the subgroup of individuals age 60 to 74 older reported experiencing some form of disabil-
will continue to comprise the bulk of the city’s ity.12 Map 2 shows several neighborhoods within
older population throughout this period, rapid the city in which over half of older residents have
growth is anticipated among those age 75 or a disability. The percentage of older New Yorkers
older between 2020 and 2030 (Figure 4). This who are both poor and disabled is more than
is significant, as individuals over age 75 are twice the national rate: 12.1 percent versus 5.5
at increased risk of developing chronic health percent.13 Disability is not an inevitable correlate
conditions, disability, and social isolation.9 of age, however. In many cases independence can
be maintained despite disability through accessible
The majority of New Yorkers age 65 and design, social supports, and/or assistive devices
above reside in the boroughs of Queens (30.2 such as wheelchairs or canes. When considering
percent) and Brooklyn (29.9 percent), followed and planning for New York’s older population,
by Manhattan (20.7 percent), the Bronx (14.6 three categories of functionality should be con-
percent) and Staten Island (5.5 percent).10 Sev- sidered: 1) independent older adults who are able
eral neighborhoods within the city have high to meet their basic needs and participate fully in
concentrations of residents age 65 or older. society, 2) adults who remain independent only
While this age group comprised less than 12 with the help of formal and informal supports,
percent of the city’s overall population in 2000, and 3) adults who are dependent insofar as they
Map 1 indicates that in many neighborhoods must rely heavily on the help and support of oth-
older adults comprise 17 percent or more of lo- ers in order to maintain a good quality of life.
cal residents.11 An age-friendly city should respect and accom-
modate all three groups.
60 -74 75+
NYC Population
1,400,000 Projection by
1,200,000 Age Group,
1,000,000 2000-2030
People
800,000
Figure 4. New York
600,000
City Population by Age
400,000 Group. Source: New
200,000 York City Department
0 of City Planning: NYC
2000 2005 2010 2015 2020 2025 2030 Projections by Age/Sex
& Borough, 2000-2030.
Year December 2006.
12 The City's Older PopulationMap 1
NYC Percent Total
Population Age 65+
Community Districts
Data sources include: US Census Bureau, Census of Population and Housing, 2000 and the NYC Department of City Planning. Maps are reprinted full-size in the appendix of this report.
Green Space
Maps prepared by the Built Environment and Health Project, Columbia University (www.beh.columbia.edu) in collaboration with The New York Academy of Medicine (www.nyam.org).
Airports, Landfill
0.00 - 5.60
5.61 - 8.60
8.61 - 11.8
11.9 - 16.7
16.8 - 1.00
Percent Total Census Tract 65+ Civilian Noninstitutionalized Population
Map 2
Percent of Persons 65+
Reporting Any Disability
Community Districts
Green Space
Airports, Landfill
0 - 33%
34 - 42%
43 - 49%
50 - 58%
59 - 100%
Percent Persons Age 65+ Reporting Any DisabilityEstimated Changes to Ethnic Composition of
New York City Population Age 65 and Older: 2007 to 2020
Racial/ 2007 2020 Percent
Ethnic Group Population Population Change
White 485,517 448,355 -7.7 percent
Black 213,775 279,186 +30.6 percent
Native American 2,550 3,792 +48.7 percent
Asian/Pacific Islander 92,874 194,478 +109.4 percent
Hispanic 182,856 275,369 +50.6 percent
Figure 5. Estimated Changes to Ethnic Composition of NYC’s Older Population.
Source: Woods & Poole Economics, Inc. New York City profile, 2006.
Poverty can be found in surprising places. Still, poverty among the city’s older population
In 2006, the poverty rate among older New does not seem to be as geographically concen-
Yorkers (age 65+) was nearly twice the national trated as that found among other age groups.
average: 18.1 percent vs. 9.9 percent.14 How- Instead, older adults with incomes below the
ever, when the official U.S. Census Bureau poverty line can be found in most neighbor-
definition of poverty is tailored to acknowl- hoods across the five boroughs. This may be a
edge the high cost of living in New York City, result of rent regulations that have permitted
that figure grows to 32 percent of older New many low-income older people to remain in
Yorkers.15 This new and more precise measure their communities of residence even as others
of poverty was developed by the Mayor’s Cen- are priced out by increasing rents.
ter for Economic Opportunity (CEO) and is
based on a set of recommendations made by There is a growing number and proportion
the National Academy of Sciences. Maps 3 of minority elders. Nearly half of today’s older
and 4 illustrate the comparison between these New Yorkers are members of racial and ethnic
different poverty thresholds. Map 3 uses the minority groups. As indicated in Figure 5, this
old measure while Map 4 shows the new one. proportion will continue to grow in the decade
In many sections of the city, the new CEO to come. All of the non-white categories will
poverty measure shows that elder poverty is have double-digit growth, and the Asian/Pa-
much more pervasive than previously thought. cific Islander senior population is expected to
In five community districts in Brooklyn, for double between now and 2020. This diversity
example, more than half of all older residents has significant implications for the importance
live in poverty. of culturally and linguistically appropriate
materials and services for older adults.
The maps on the right compare the presence of poverty based on two different measures: the official poverty thresh-
old as determined by the U.S. Census Bureau (Map 3) and a new measure developed by the Mayor’s Center for
Economic Opportunity (Map 4).
14 The City's Older PopulationMap 3
Official Poverty Rate for
New Yorkers 65 or Older,
by Community District
Data sources include: U.S. Census Bureau’s 2006 American Community Survey and the NYC Mayor’s Center for Economic opportunity. Maps are reprinted full-size in the appendix of this report.
Community Districts
Green Space
Map Prepared by the Built Environment and Health Project, Columbia University (www.beh.columbia.edu) in collaboration with The New York Academy of Medicine (www.nyam.org).
Airports, Landfill
00.00 - 10.00
10.01 - 20.00
20.01 - 30.00
30.01 - 40.00
50.01 - 60.00
Percent in poverty based on U.S. Census Bureau definition
Map 4
CEO’s Adjusted Poverty Rate
for New Yorkers 65 or Older,
by Community District
Community Districts
Green Space
Airports, Landfill
No Data
00.00 - 10.00
10.01 - 20.00
20.01 - 30.00
30.01 - 40.00
40.01 - 50.00
50.01 - 60.00
Percent in poverty based on new and more precise measure
developed by the Mayor’s Center for Economic OpportunityCross-cutting Themes
New York is often said to be a city of neighborhoods, and, indeed, each of
our community forums, focus groups, and interviews opened a window onto
a different world of advantages and disadvantages for the residents in that
area. Two salient themes emerged, however, about the City as a whole.
For many, New York City is a great place to Upper West Side spoke enthusiastically about
grow old. Some people we spoke with expressed their proximity to cultural institutions. Older
a desire to move away, but “I think New York immigrants in Jackson Heights said they liked
is the greatest place in the world to be old,” was living among the hustle and bustle of younger
the far more common observation. Many people immigrant families. Staten Island residents ap-
reported having lived happily in their neighbor- preciated owning their own homes. Residents of
hoods and even their apartments for 30, 40, 50 Jamaica, Queens, said they appreciate the calm-
years, and longer. As one focus group participant ness of their area and rarely travel into the noise
explained about her neighborhood, “I was born and traffic of Manhattan.
here. To me, it’s the center of the earth and to go
anywhere else is a step down. Anywhere else I’d Health and social disparities among older
be a fish out of water.” New Yorkers linked to issues beyond race and
poverty. A number of studies have described the
We also met many people who moved away effects of race and income on health outcomes,16
upon retirement, only to move back to the City and more recent work has shown the effects of
within a short time. “I kissed the ground when neighborhood residence on symptoms of depres-
I moved back to Brooklyn,” said one forum sion, even after controlling for income.17 Our as-
participant. Older New Yorkers told us they sessment adds yet another layer of understanding
recognize the City offers particular advantages to the causes of disparate health outcomes among
as they age. Many cited the easy access to public older adults. Throughout our year-long process,
transit; the convenience of having stores and we met older adults facing unique circumstances
other amenities in close proximity; the many in the city that influence their well-being. While
events, activities, and institutions to enjoy in differences based on race and poverty were
retirement; and proximity to high-quality health evident in many discussions, we also observed
care facilities. the salience of other factors. Various challenges
are discussed in further detail throughout this
We also observed that, while older New York- report but include linguistic and cultural isola-
ers have diverse tastes and interests, a remarkable tion, unconventional family structure, and lack
majority seem to have found a community or of social connectedness.
neighborhood that suits them perfectly. Love of
the City was widespread, but in many ways this We met an older woman in the Bronx who
rich diversity of neighborhoods means it is a very has difficulty speaking English: “We came to
different City that each loves. Residents on the this country late and it is difficult to commu-
16 Cross-cutting ThemesSupport offered through the City’s excellent health and human
services system as well as the protective benefits provided by
the strong social cohesion of some neighborhoods appear to
mitigate the effects of low income for many older adults.
nicate,” she said. We met older adults in East out our assessment, we met low-income older
Harlem who have lost familial ties because people with few significant unmet needs and
their children have moved away in search who were certainly not miserable. Support
of better opportunities. We met a widower offered through the City’s excellent health
who told us “it hurts to be alone” and it is and human services system as well as the
“hard when the phone doesn’t ring all day.” protective benefits provided by the strong
We met older people who are seemingly social cohesion of some neighborhoods ap-
“falling through the cracks” because their pear to mitigate the effects of low income for
family needs have not been anticipated by many older adults. For example, while the
government regulations: grandparents who relatively affluent Upper East Side residents
are ineligible for senior housing because they we met advocated developing additional
are the primary caregivers for their grand- social programs to visit isolated older adults,
children and older adults who are newer to several long-time residents of public hous-
the country facing tremendous frustration ing described feeling safe, contented, and
and psychological stress because they cannot connected to their environment, because, as
navigate systems and pathways to help. one woman told us, “I know most faces. If
not, they know my kids.” Despite having low
While there is a significant body of research incomes and living in low-income neighbor-
indicating that poverty is correlated with hoods, these elder residents reap rewards
unmet need and unhappiness in old age,18 from having lived in comfortable proximity
our findings caution against overstating this with their neighbors for many years.
association within New York City. Through-
Toward an Age-Friendly New York City 17The Eight Domains of an Age-friendly City
1. Respect and Social Inclusion
To what extent are public services, media, commercial services, faith communities
and civil society respectful of the diversity of needs among older adults and willing to
accommodate older adults in all aspects of society? 19
Sample suggestions:
1. “Require schools to discuss respect and teach respectful behavior towards the elderly.”
– Community forum on Staten Island
2. C
ombat ageism by developing a citywide public education and anti-discrimination campaign.
– LGBT community forum
3. Th
e oral histories of older people in New York City should be documented.
– Expert roundtable on civic engagement
The findings below are organized into the eight domains of city life defined
by the World Health Organization in its framework for the Global Age-
friendly Cities project based on previous research on the characteristics of
elder-friendly communities.20
Many older New Yorkers feel left out. Ageism, or “I was raised in New York City, in Manhattan,
disrespect of older people, is traditionally discussed and they took care of you back then,” said one
in terms of employment discrimination, negative woman. “You got school, and health and dental.
images in the media, and even elder abuse.21 In They should take care of us now.”
our discussions, however, concerns about exclu-
sion and the unfair treatment of older people were “Everything is about youth,” was often cited
most often paired with discussions about the many as the reason older people are sometimes treated
changes in the city during recent decades. Many poorly. In more than one community center, fo-
of the older adults we spoke with told us they had cus group participants told us they resented being
been raised to respect and to care for their elders, pushed out of meeting spaces and having their
and now that they are older, they are dismayed programs cancelled to provide more programs
to find the family networks, social supports, and for children. A forum participant distressed by
community networks they remember from their the number of new chain stores targeting young
youth are not available to them. These high ex- people on the Upper West Side told us, “We need
pectations have led some lifelong New Yorkers to affordable retail and services for older people.” In
feel they are being treated unfairly in their old age. East Harlem, we heard that urban renewal has
18 The Eight Domains of an Age-friendly City"I don’t feel secure. I feel vulnerable. If someone runs into me
I will go flying and no one will pick me up."
passed them by and left “nothing for older people runs into me I will go flying and no one will pick
here—no jobs or anything.” Another person dryly me up.” Heightened anxieties about being ne-
told us, “After 5 p.m. I don’t go out. They only glected or mistreated were linked with concerns
want the good-looking younger people. They about diminished physical or mental capacities.
won’t let senior citizens into those restaurants in Many people told us, for example, that they were
the trendy areas.” worried about being cheated or robbed in finan-
cial schemes or getting evicted by unscrupulous
The experience of exclusion combined with landlords both because there is not enough
increasing frailty may lead to fear. Along with respect for older people, but also because of their
concern and resentment about exclusion and own reduced ability to recognize a swindle or to
poor treatment, a significant number of people defend themselves.
also expressed fear. “I was scared of growing
older,” one woman told us. “So much has Despite New York City’s well-documented
changed. And there are cutbacks. I was worried decrease in crime since the 1990s, older people
what would happen, if there would be services. told us they fear crime and would like a more
I have so many medications to take. I get wor- visible police presence on the streets because as
ried I won’t get to 70. I want to make it to 100, older people they are often frail and therefore
but let’s say 70.” Another woman told us, “My “easy targets.” Again, this anxiety appears to be
arthritis and my osteoporosis slow me down. linked to feelings of enhanced vulnerability as an
I don’t feel secure. I feel vulnerable. If someone older person and less about concrete experiencesof danger or crime. At the community forum guidance on plans and projects, especially those
in Manhattan’s Chinatown area, nearly all 150 which affect them and their neighborhoods-not
seniors who had traveled there from all five just on “senior issues.”
boroughs raised their hands to indicate feeling
unsafe in their local communities. When pressed, Lastly, while many advocates discourage use of
however, only a handful had been victims of the terms “elderly” or “aged” as disrespectful,22
crime–or knew someone who had been such a this view was not shared by the older people with
victim–within the last few years. whom we spoke. Instead, they overwhelmingly
told us they don’t care what they are labeled so
To increase respect for and inclusion of older long as they are treated with respect. “Call me
people, elders and experts we spoke with recom- what you want, just do things for me,” said one
mended mass education through public service person. A woman from Queens laughed as she
announcements, school programs, and employee told us her first experience being referred to as
training about the needs, expectations, and an older person. As she was walking down the
concerns of older adults. Older adults also widely street a group of young men were playing and
agreed that they should be invited to participate one wanted to stop their play in order to let the
in designing plans for the continued development woman pass. He yelled, “Stop that. Don’t you see
of New York City. Older New Yorkers reminded that old lady?” “That’s the first time I thought of
us they retain the memories about the struggles, myself that way,” she said. “I just smiled and said
successes and failures in the City and can offer ‘thank you for looking out for me’.”2. Information and Communication
To what extent are older adults aware of the diverse range of programs and services
available within their community? And is information readily available, appropriately
designed and delivered to meet the needs of older people?
A lack of good information sources is impeding eligible older people have not taken advantage
access to opportunities and services. Decision- of the Senior Citizen Rent Increase Exemption
making responsibilities increasingly reside with (SCRIE), a program that protects low-income
older people and their caregivers as opposed to older adults from rent increases.24
health or social service providers.23 National
figures indicate, however, that 20 percent of At several community forums people expressed
adults age 65 or older do not know whom to call frustration over the “red tape” that requires them
for information about services. This was borne to exert so much energy to get needed help or
out in our local discussions, where older New information. Numerous people complained
Yorkers repeatedly mentioned difficulty learn- about automated telephone systems: “Give me
ing about resources that could enhance their a person to talk to!” Other problems mentioned
quality of life. “I know there must be something include: excessive jargon and confusing wording
out there to help me,” said one person at the in correspondence from insurance, housing, and
Upper West Side forum, but she was not sure other agencies; agency phone menus and writ-
how to begin to find an agency to help her ten instructions that require too many steps or
with her problem. A dramatic example of how include too much technical information; and
inadequate information may be affecting access important documents such as lease agreements
to benefits is that between 60,000 and 80,000 that are illegible due to small font size and low
Numerous people complained about automated telephone
systems: “Give me a person to talk to!”
Sample suggestions:
1. “ Agencies that are supposed to address the problems of the elderly should have some sort of
central agency that can better coordinate programs for the elderly. We don’t know where to go
sometimes. If there was a central clearinghouse for help and information it would be helpful to
the elderly.”
– Community forum in Harlem
2. “Expand instruction and learning opportunities for seniors around technology.”
– Focus group participant
3. N
ot-for-profit service providers should have access to low-cost or subsidized translation services
to help them conduct outreach to and serve a variety of populations.
– Expert roundtable on civic engagement
Toward an Age-Friendly New York City 21contrast. Older New Yorkers told us they need two-thirds of persons age 65 and older who are
more, better, and clearer information delivered linguistically isolated.26 At the forum we held
through multiple modalities. This message was in that neighborhood, an older woman who
unequivocal. speaks only Chinese said: “I’m blind because I
cannot read documents written in English. I’m
Some older adults requested the creation of a deaf because people speak to me in English and
centralized system for triaging community prob- I don’t understand. And I’m mute because I
lems and engaging with City systems. While sev- cannot communicate with anyone who does not
eral current central resources (including DFTA’s know my language.” Broadcasts and newspapers
website) were mentioned, each was deemed too in languages other than English are particularly
narrow to meet the need for a “one-stop-shop.” important for similarly isolated groups. The City
The City’s 311 telephone service system drew has made substantial improvements in this area:
praise from those who had used it (with the ACCESS NYC, its new benefit eligibility screen-
exception of a Spanish-speaking individual who ing tool, is offered in seven languages; 311 is avail-
said she found it confusing). However, skepti- able in 170 languages;27 and Mayor Bloomberg
cism about 311 was apparent among those who recently signed an Executive Order mandating
had not tried it, which may suggest the need for all City agencies that have direct interaction with
targeted marketing of its features. At our expert the public to provide language assistance in the
roundtables, making integrated health and social top six languages spoken in our city.28 A chal-
services information available in online, phone, lenge, however, is getting information to those
and print formats was repeatedly suggested. who need it in both their preferred language and
communication medium.
The most popular information sources are local
and free. Across the City, people told us they most Technology use: opportunity and challenge.
often get information about community events Opinions were split among older New Yorkers on
and services from free sources such as local com- the advantages of information technology. Some
munity papers; bulletin boards and newsletters people are even opposed to cell phones. “I find cell
in churches, senior centers, apartment buildings, phones difficult. I don’t use cell phones. I’m not
and neighborhoods; and word-of-mouth. Our good with modernized things. I prefer a windup
interviewees in Jackson Heights also told us they watch.” The majority favored cell phones, though
rely on the free community newspapers (Hoy there were concerns about cost, keypad size and
New York, El Especialito) for news as often as the font, and complexity of use. Reactions to comput-
larger citywide newspapers (The New York Times, ers were similarly mixed. More than half of the
Daily News). It was recommended that local and respondents to the constituent feedback form said
free sources be more actively used by agencies access to computers and the Internet are “very im-
that want to get information to older adults. portant” to the well-being of older New Yorkers,
but only about a quarter of all forum participants
Information is needed in multiple languages. reported having used a computer to get informa-
Approximately 27 percent of older New Yorkers tion or expressed interest in doing so.
speak English less than “very well.”25 In some
neighborhoods, however, linguistic isolation Among those who said they have used comput-
is particularly concentrated. For example, one ers, most access computers at their local library
census tract in Manhattan’s Chinatown has or community center. Experts stressed that com-
22 The Eight Domains of an Age-friendly Cityputers can help older adults (particularly those and costs of ongoing Internet service) and insuf- with mobility impairments) to maintain social ficient understanding of how to use computers networks. Some elders expressed anger, however, effectively. Suggestions for increasing computer at the suggestion that they use computers. “You literacy and access included providing on-call know what burns me up? When people say that technical assistance, expanding computer training they will e-mail me. I don’t have e-mail. I can’t specifically for older adults, offering low-cost or afford a computer.” Barriers to computer access free personal computers, and offering expanded include affordability (purchasing a computer, computer access (with helpdesk support) in public paying fees associated with computer training, spaces like libraries and public buildings.
3. Civic Participation and Employment
         To what extent do older people have opportunities to participate in community decision-
      making? And do older people have ample opportunities to contribute their experience and
      skills to the community in paid or unpaid work?

  Civic participation refers to the activities of personal and public concern
that are both individually enriching and socially beneficial to communities.
It can take many forms, including paid and unpaid work, involvement in
electoral politics, and community activism. These activities not only benefit
the community, they keep older adults engaged and prevent social isolation.

Older adults who are care-givers need acknowl-         access to senior housing as well as other services.
edgement and support. We found that one of             Similarly, the role of older adults as caregivers
the most significant ways older adults contribute      (for spouses and their own aged parents) is not
to the community is as caregivers. The role of         adequately acknowledged. Several of the older
grandparents has long been appreciated in this         adults at our Upper West Side forum mentioned
country, but the increasing role of grandparents       they are caring for parents in their own homes or
as parents (i.e. as the primary caretakers for their   coordinating care for parents out-of-state.
grandchildren) is a phenomenon that has gained
visibility in recent years. We spoke with many         Older New Yorkers provide critical resources
older women who, despite health conditions             to the City. Many people we spoke with had a
and extreme financial hardship, have taken on          rich history of giving to the City through their
primary caretaking responsibilities when their         time and efforts, and many were still playing
children could no longer act as parents for their      critical roles leading campaigns and serving on
grandchildren. One woman put it simply: “Older         advisory councils, tenant associations, and non-
people are the ones who bear the burden. They          profit boards. “If it wasn’t for the older people,
take care of kids left behind.” New programs and       the younger people wouldn’t have a place to stay,”
services, such as respite care and group counsel-      they told us in Queens. “Older people carry the
ing, have been emerging to support these older         community around here. We go to the tenant
caregivers. Unfortunately, we heard that their role    meetings, the PTA, all the meetings.” “We all
is not well-acknowledged in some social service        should volunteer,” said one older woman who
systems, and despite legal services designed to        visits with homebound individuals. Older adults
assist grandparent caregivers, some grandparents       told us they recognize that staying involved
have difficulty accessing benefits and securing        enriches their communities and their own lives.
guardianship. We heard stories that the presence       As one older person explained: “I’d like to do
of children in the home limited an older person’s      something that I can be proud of. I don’t mind

   24 	The Eight Domains of an Age-friendly City
Older adults told us they recognize that staying involved
enriches their communities and their own lives.
Sample suggestions:
1. E
xpand existing programs and services that support retirees as they re-enter the workforce and
create employment agencies for older people who have a wide variety of skill sets, work histories,
and professional backgrounds.
– Expert roundtable on business
2. E
nhance flexibility in employment opportunities to allow older people to phase into retirement
by working part-time.
– Expert roundtable on civic engagement
3. D
evelop public service announcements for broadcast locally outlining the advantages of hiring
older workers (e.g., knowledge, experience, reliability)
– Community forum in East Tremont section of the Bronx
4. A
ll 59 of the City’s Community Boards should have subcommittees focused on aging issues and
be given the tools, resources, and knowledge needed to review all Community Board business
and to advocate for older residents in their districts.
– Expert roundtable on civic engagement
getting old. I just want to be doing something.” Many older adults remain in the workforce.
Our findings are consistent with those of a recent While many adults are pleased to retire from
report by the New York Community Trust and paid work at age 65, more than three-quarters of
the United Neighborhood Houses of New York, the respondents to the feedback form indicated
which found that New York offers a range of that employment opportunities for older people
opportunities for the civic engagement of older are “very important” or “important” for their
people, particularly for volunteering. This report well-being. For some, the desire to work is tied to
also found, however, that a number of barriers a financial need. A recent survey of New Yorkers
prevent many from meaningful engagement in found that 35 percent of respondents age 65 and
community institutions and activities.29 One older have “little confidence” they will have the
community forum participant spoke about her resources needed to live comfortably when they
desire to bring activities to a nearby nursing home retire.30 The tight financial circumstances of
but said, “I don’t know how to go about it.” As many of our contacts bore this out. One focus
was noted in the Communication and Informa- group participant in Queens told us, “I waited
tion section, information about how to connect five years longer than I wanted to retire because I
to meaningful involvement is needed. needed the income.” Some older people told us,
Toward an Age-Friendly New York City 25You can also read