BRAZIL LSH MARKET STUDY FINAL - COMMISSIONED BY THE NETHERLANDS ENTERPRISE AGENCY - RVO
←
→
Page content transcription
If your browser does not render page correctly, please read the page content below

Brazil LSH Market Study Final

Commissioned by the Netherlands Enterprise Agency

BRAZIL
Market Studies
Business Opportunities for the Dutch Life Sciences & Health sector in Brazil

EXECUTIVE SUMMARY
Brazil has the 9th largest economy in the world, with a GDP of US$ 1.868 trillion. The Brazilian
government operates one of the largest universal health care systems to date, providing free services
to over 210 million people. Brazil has the second largest pharmaceutical market in the world and is
the leading medical device market in Latin America. The Brazilian healthcare market structure is on
the verge of transformation as the coupled effect of a rapidly ageing population and new
government catalyse change in healthcare demand and supply.

Like is the case in many countries around the globe, healthcare demands in Brazil are on the rise. The
system is becoming increasingly pressured by a changing national demographic profile, marked by
a growing elderly population and fast-increasing burden of non-communicable, chronic disease. At
the same time, welfare retrenchments increase pressures on Brazil’s public universal healthcare
system: the Sistema Único de Saúde (SUS), which currently serves approximately 75% of the
population. Austerity measures are expected to exacerbate inequality in access to health care across
regions and income groups.

Together, these circumstances have led to the growth of Brazil’s private healthcare market (66.7% of
total health expenditure in 2016), which, in recent years, has seen large growth compared to public
healthcare budgets. However, the private health sector has seen some turbulence, caused by the
2014-2016 Brazilian economic crisis. In this way, during periods of economic growth, Brazil’s market
share of private health plans increase, while during recessions the population shifts towards SUS.

In this market cycle, the Brazilian private health providers find themselves in an increasingly
competitive environment. This has led to an increase in pilot projects and the adoption of cutting-
edge innovative technologies. Likewise, in the public sector health providers under pressure from
austerity measures are hungry for disruptive innovations that increase efficiencies whilst reduce costs.
This demand provides opportunities for Dutch Smart Solutions within the strengths Hospital Design
and Build, eHealth, Medical Devices & Supplies and Mobility & Vitality.

This report was commissioned by the Netherlands Enterprise Agency (RVO.nl) and is produced by
the Task Force Health Care (TFHC) in cooperation with the Netherlands consulate-general in São
Paulo and the Netherlands Business Support Office Porto Alegre. It aims to align the respective Life
Sciences & Health sectors of the Netherlands and Brazil. In an effort to increase mutual
understanding and inspire collaboration between these countries, this report provides useful insights
into the Brazilian health system and sector and identifies potential areas of opportunity.

                                                                                                           2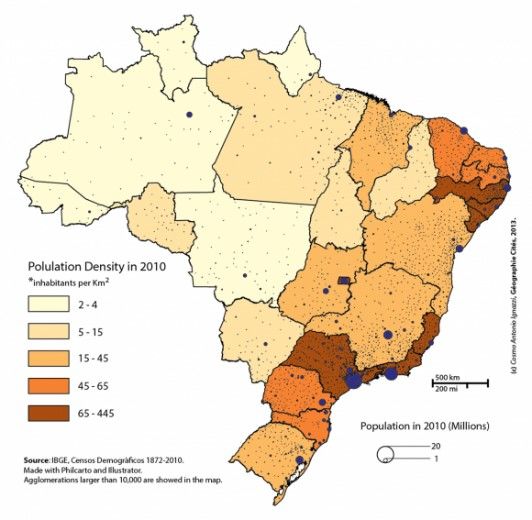
OUR APPROACH

         TASK FORCE HEALTH CARE
         IMPROVING HEALTHCARE TOGETHER
        Established in 1996, Task Force Health Care (TFHC)     Our core mission is to improve healthcare and well-
        is a public-private not-for-profit platform that       being internationally in a sustainable and demand-
        represents and supports the Dutch Life Sciences &      driven manner, with the use of Dutch expertise. We
        Health (LSH) sector. Our platform has a reach of       are currently actively engaged with over 20
        1200 LSH organisations in the Netherlands, with        countries to stimulate and facilitate relationships
        130 dedicated and diverse partners. Our partners       across government, knowledge institutes, and
        include   government,      industry,   knowledge       businesses. Our partners are active around the
        institutes, NGOs, and healthcare providers.            world and provide innovative and sustainable
                                                               solutions relevant to both global and local
                                                               healthcare challenges.

A PROGRAMMATIC APPROACH                                 OUR FOCUS

   Bridging Knowledge, Aligning Interests                    Mutual Interests and Benefits
   and Identifying Opportunities

   Fostering and Strengthening                               Developing Sustainable and Long-Term
   Networks                                                  Approaches

                                                             Demand-Driven and Context Specific
   Facilitating Dialogue on
   Health Themes and
   Opportunities to Collaborate

                                                                                                             3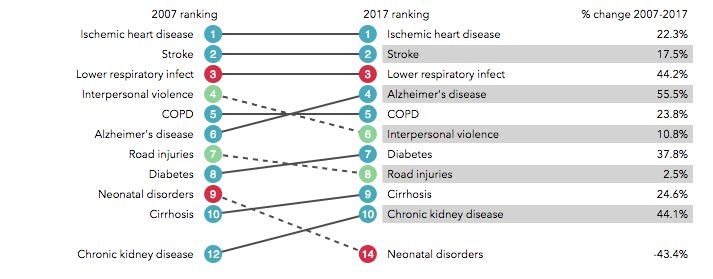
CONTENT

OUR APPROACH                                             3

CONTENT                                                  4

LIST OF FIGURES AND TABLES                               6

THE BRAZILIAN HEALTH SECTOR                              7

HOW DOES BRAZIL COMPARE?                                 8

1   ABOUT THIS REPORT                                    9

1.1 BACKGROUND & PURPOSE                                 9
1.2 METHODOLOGY                                          9

2   MAPPING DUTCH INTEREST IN BRAZIL                     10

2.1. SURVEYING THE DUTCH HEALTH SECTOR                   10

3   INTRODUCING BRAZIL                                   12

3.1 HISTORY & GEOGRAPHY                                  12
3.2 PEOPLE AND DEMOGRAPHY                                12
3.3 ECONOMY                                              13
3.4 TRENDS IN BRAZIL’S HEALTH STATUS AND INTERVENTIONS   13
3.5 VARIANCE IN HEALTH STATUS AND OUTCOMES               15

4   THE BRAZILIAN HEALTH SYSTEM                          18

4.1 THE HEALTH SYSTEM                                    18
4.2 HEALTH EXPENDITURE                                   20

5   MARKET STRUCTURE AND ACCESS                          27

5.1. MARKET STRUCTURE, SIZE AND TRENDS                   27
5.2. MARKET ENTRY, REGULATORY AFFAIRS AND REGISTRATION   30
5.3. BRAZIL’S LIFE SCIENCES & HEALTH SECTOR              25

                                                          4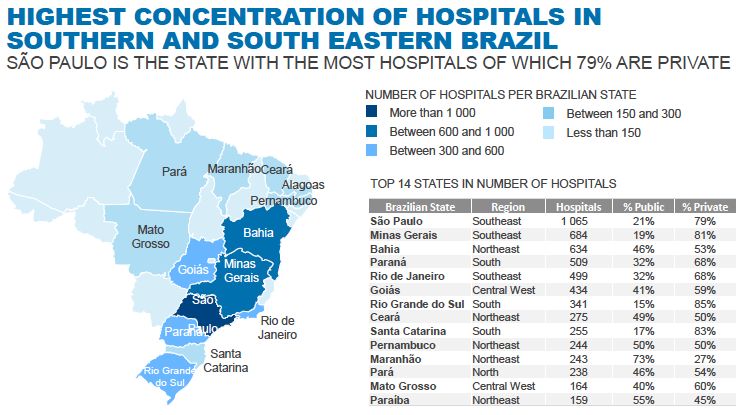
5.4. TIPS FOR ORGANISATIONS EXPLORING THE BRAZILIAN HEALTHCARE MARKET   31

6   ALIGNING DUTCH STRENGTHS WITH BRAZILIAN OPPORTUNITIES               34

6.1. ANNUAL HEALTH PROGRAMME (PROGRAMAÇAO ANNUAL SAUDE PAS)             34
6.2. HOSPITAL DESIGN AND BUILD                                          34
6.3. EHEALTH                                                            37
6.4. MEDICAL DEVICES & SUPPLIES                                         40
6.5. MOBILITY & VITALITY                                                43

REFERENCES                                                              46

ANNEXES                                                                 51

ANNEX 1 – LIST OF INTERVIEWEES IN BRAZIL                                51
ANNEX 2 – LIST OF INTERVIEWEES IN THE NETHERLANDS                       54
ANNEX 3 – LIST OF RELEVANT EVENTS AND TRADE FAIRS 2019                  55
ANNEX 4 – POPULATION PYRAMID                                            58
ANNEX 5 – LIST OF KEY BRAZILIAN MEDICAL INDUSTRY ASSOCIATIONS           59
ANNEX 6 – LIST OF IMPORTERS OF MEDICAL DEVICES & SUPPLIES               60
ANNEX 7 – LIST OF HOSPITALS IN BRAZIL                                   61
ANNEX 8 – ANVISA MEDICAL DEVICE REGISTRATION AND APPROVAL IN BRAZIL     63
ANNEX 9 – NATIONAL MEDICAL DEVICE MANUFACTURERS                         64
ANNEX 10 – SELECTION OF BRAZILIAN ORGANISATIONS IN THE LSH SECTOR       65

                                                                         5
LIST OF FIGURES AND TABLES
Figure 1: Respondents per Strength............................................................................................................................................................. 10
Figure 2: Activity in the LSH sector in Brazil .............................................................................................................................................. 10
Figure 3: Do you see growth potential in Brazil? .................................................................................................................................... 11
Figure 4: Do you experience market barriers in Brazil? ........................................................................................................................ 11
Figure 5: Population density and population pyramid (2050) in Brazil ......................................................................................... 12
Figure 6: Top 10 Causes of Death in 2017 and Percent Change, 2007-2017, all ages, number ......................................... 14
Figure 7: Map showing HCC distribution in Brazil .................................................................................................................................. 16
Figure 8: Organisation of the Health System in Brazil .......................................................................................................................... 19
Figure 9: Geographic locations of Brazilian hospitals with pharmacists ....................................................................................... 23
Figure 10: Concentration of hospitals by state ........................................................................................................................................ 23
Figure 11: Medtech segmentation in the Brazilian market ................................................................................................................. 27
Figure 12: Projection of the number of Health Services provided by (supplementary) medical schemes by age in
Brazil (2013- 2030) ............................................................................................................................................................................................... 44
Table 1: Geographic, Demographic, Economic, Business and Health context compared between countries. ................ 8
Table 2: Income groups in Brazil .................................................................................................................................................................... 13
Table 3: Economic indicators for Brazil *indicates projected numbers ......................................................................................... 13
Table 4: Public (SUS) versus Supplementary Healthcare ..................................................................................................................... 15
Table 5: Health Professionals in Brazil ......................................................................................................................................................... 25
Table 6: Typical segmentation of the expenditure of ANAHP members ...................................................................................... 29
Table 7: Hospital projects in Brazil ................................................................................................................................................................ 35
Table 8: Import share of medical products in Brazil .............................................................................................................................. 41
6TOP OPPORTUNITIES IN BRAZIL
Growth Healthy Ageing
Brazil’s private healthcare market is competitive, but As the number of people aged 60 years and older
has seen explosive growth over recent years, creating a continues to rise, the demands of this 6.5 million person
lively market environment for Dutch companies to population continue to grow in terms of their healthcare
explore. Read more about the Brazilian economy in needs. Brazil’s government and private sector are thus
Section 3.3. investing in innovations that assist seniors achieve
healthy, independent lives. Read about trends in Mobility
and Vitality in Section 6.2.
Innovative Private Hospitals
Electronic Health Record
Incentivised by increased competition, the private
sector has become the main driver and adopter of
innovation in healthcare in Brazil. Read more about
trends in Section 6.1.
The Ministry of Health announced potential
investments of up to US$ 450 million in the digitization
of public basic care units of the SUS. Private hospitals
are also investing in technology and several new
hospitals are formalizing their progress by obtaining
Telemedicine/Health
international certificates for data management and the
reduction in paper use.
The use of telemedicine solutions in both urban and rural
areas is a fast-growing trend in Brazil. A large project is
the Tele-health network, made-up of 57 university Thriving Industry
hospitals. In homecare, Brazilian industry also see
opportunities in solutions which allow Brazil’s population
to age and heal at home. Brazil has a competent local industry which continues
to succeed in supplying medical devices and
pharmaceuticals to the Brazilian population.
Growth of Pharma Chronic Disease Control
Changing demographics and an increase in NCDs has Brazil’s growing challenge with chronic diseases (NCDs)
driven growth in Brazil’s pharma industry. The presents enormous opportunities for Dutch Smart health
pharmaceutical market in Brazil is predicted to rise from solutions. The Brazilian Ministry of Health is eager to find
$25.5 billion in 2016 to $29.9 billion in 2021— a growth solutions relating to behaviour change, such as reducing
rate of 3.5% tobacco usage, alcohol consumption, increasing activity
and reducing salt intake. 7HOW DOES BRAZIL COMPARE?
Table 1: Geographic, Demographic, Economic, Business and Health context compared between countries. (BMI, 2017)
Brazil Chile Colombia Mexico Netherlands
Land Size (km²) 8 515 767 049 756 950 1 109 500 1 972 550 33 690
Population (2019) 212 000 000 18 00 0000 49 853 630 132 343 600 17 109 189
expected annual growth rate (%) 0.8 1.4 1.5 1.1 0.6
65 years and older (%) 9.6 12.2 9.1 7.6 19
expected in 2050 (%) 22.7 24.9 21 17 25
Maternal Mortality Rate (100 000 births) 58 17 71 38 7
Life Expectancy at Birth 76 80 75 77 82
Life Expectancy Global Rank (2017) 125 51 95 92 25
Economic Context
GDP (in current US$) (2017) 1 868 626 09 298 231 14 330 227 87 1 223 808 89 826.2
expected growth (2020) 1.1 4 2.7 2 2.09
GDP per capita (US$) 8 920 8 15 923 4 6 651 3 9 698 1 52 978 4
annual growth rate (%) 0.3 2.6 1.1 0.9 2.54
(Health) Business Context
Ease of Doing Business Rank 109 56 65 54 36
Logistics Index 56 34 58 51 6
Pharmaceutical Market (bln US$-2016) 20 547 3 520 3 140 16 190 6 000
Expected growth 2016-2021 (%) 8.6 8.6 6.0 5.1 0-0.5
Medical Device Market (mln US$ – 2016) 5 500 0 800 1 1 197 1 4 655 3 3 486 1
Expected growth 2016-2021 (%) 5.2 9.0 8.5 8.1 5.0
Medical Device Import from
the Netherlands 000s US$ 24 329 13 670 9 787 n/a -
Ranking 17th 12th 16th n/a -
Medical Device Export to
the Netherlands 000s US$ (%) n/a 737 n/a 69 879 -
Ranking n/a 5th n/a 4 -
Health Context
Health Expenditure (bln US$) 155.3 2.8 21.1 64.2 81.7
Health Expenditure as % of GDP 11.77 8.53 7.4 6.1 10.69
Health Expenditure per Capita (US$) 1 015 93 1 190 55 358 461 79 4 746 01
Public Health Share of HE
46% 51.5% 75.5 52.1 86.7
Type of Health System Social Health Social Health Social Health Social Health Social Health Insurance
Insurance and Insurance Insurance Insurance
supplementary
private insurance
Top three causes of death 1. Ischemic heart Ischemic heart Ischemic heart Ischemic heart Ischemic heart disease
disease disease disease disease
2. Stroke Stroke Stroke Chronic kidney Alzheimer’s Disease
disease
3. Lower Alzheimer's Interpersonal Diabetes Lung cancer
respiratory infect disease violence
81 ABOUT THIS REPORT
1.1 Background & Purpose
Aligning the interests & strengths of the Dutch Life Sciences & Health (LSH) sector with the health sector
dynamics and interests of Brazil
This market report was commissioned by the Netherlands Enterprise Agency (RVO) in The Netherlands. It is delivered
by Task Force Health Care (TFHC), in close cooperation with the Netherlands Consulate general in São Paulo and
the Economic Diplomacy Network in Brazil. It provides an analysis of the Brazilian healthcare sector, identifies
business opportunities for organisations active in the Dutch Life Sciences and Health sector, and makes
recommendations for organisations in The Netherlands that are interested in the Brazilian market. The main
objective is to get a better understanding and gain insights into the Brazilian healthcare market to raise awareness
and increase interest among Dutch health organisations.
1.2 Methodology
Step 1: Identification & mapping of Dutch interest and perceived barriers in the Brazilian LSH sector
In order to obtain a better understanding of the interests of the Dutch Life Sciences & Health sector in Brazil,
historical data, Dutch representation in Brazil, and results of a survey and interviews were referenced. The survey
was sent out to over 1,200 Dutch actors within the Life Sciences & Health sector to share their activities, ambitions,
and perceived opportunities and barriers in relation to Brazil. Data was classified into type of organisation, strength
(e.g. Medical Devices or eHealth), current or past activity in Brazil, and perception of Brazil in terms of market growth.
Section 2 shows the data out of the survey and interviews. This data has furthermore been used in Section 6 to align
challenges and opportunities in Brazil with Dutch expertise and solutions.
Step 2: Desk Research
In order to obtain a better understanding of the Brazilian health sector and its dynamics, desktop research was
conducted. A range of documentation was studied, including government documents, academic articles, and reports
from various organisations and federations. The information gathered was analysed in order to provide a thorough
overview of the Brazilian sector. This desk research was then used in the design of the programme of the factfinding
and structured interviews in ‘Step 3’.
Step 3: Fact finding visit to Brazil
An important element of the study was the fact-finding visit, to São Paulo and Porto Alegre, whereby a delegation
from TFHC, accompanied by representatives of The Netherlands Consulate General in São Paulo and the
Netherlands Business Support Office Porto Alegre, gained insights from key stakeholders in the Brazilian health
sector. The fact-finding visit included meetings and discussions with representatives from the public and private
sector, operating at the national, regional and local level. Concrete examples in this market study reflect activities in
these two states. Other Brazilian state were not visited or interviewed for this study. The list of interviewees located
in Brazil is presented in Annex 1, whilst the list of interviewees based in the Netherlands is presented in Annex 2.
Step 4: Finalising Report
The Desk Research and Fact finding visit to Brazil enabled the collection of information with regards to additional
sources and provided valuable insights into the sector. The data from these interviews allowed for cross-checking
of data that had previously been obtained, resulting in the development of an objective and realistic report.
92 MAPPING DUTCH INTEREST IN BRAZIL
2.1. Surveying the Dutch Life Science & Health Sector
In order to gain an understanding of the degree to which the Dutch are interested in the Brazilian market, an online
survey was sent out to 1 200 unique Life Sciences & Health organisations and companies in the Netherlands. The
survey was also shared with multiple networks and cluster organisations in order to extend its reach. Combined data
from the survey, Task Force Health Care, and the Netherlands representation in Brazil yielded 63 unique respondent
organisations with activity and interest in Brazil. Figures 1- 4 below show the current data available by ‘Strength’,
‘Activity in Brazil’, ‘Potential Growth Market’ and ‘Perceived Market Barriers’.
3 2
3
19 eHealth
8 Medical Devices & Supplies
Public Health
Hospital Design & Build
Mobility & Vitality
10 Product Development
Biopharma
18
Figure 1: Respondents per Strength
Which Dutch strengths are active in Brazil or have been in the past? In terms of export, research, projects or
otherwise.
36 of the 63 respondents who were active in Brazil, were medium-sized companies. The largest group consists of
eHealth companies which represent a diverse mix of solutions mainly aimed at big data, analytics and telemedicine.
This is followed by Medical Devices with both sophisticated devices and disposables, Hospital Build companies,
mainly active in building specific parts (no architects) and Public Health which represent mainly universities/UMCs.
2 1
3 9 eHealth
Medical Devices & Supplies
Hospital Build
6 Public Health
Product Development
Mobility & Vitality
8 Biopharma
6
Figure 2: Activity in the LSH sector in Brazil
10Which strengths see the most potential in Brazil?
53 of 63 respondents see business opportunities to grow their activity in Brazil. eHealth and Medical Device
companies are most optimistic, highlighting their propositions to make SUS more efficient and link-up with Brazil’s
large and vibrant private hospitals. Hospital Build and Public Health companies see most potential in Brazil’s Ageing
Society and respective capacity problems in both curative and elderly care.
2 1
3
eHealth
5 17
Medical Devices & Supplies
Public Health
Hospital Design & Build
Product Development
10
Mobility & Vitality
Biopharma
15
Figure 3: Do you see growth potential in Brazil?
Do you experience any market barriers in Brazil? Experienced or anticipated
19 of 63 respondents foresee or have experienced market barriers in Brazil. The most noted barriers are problems
with achieving reimbursement for innovative devices and market acceptation by Brazilian decisionmakers. Other
barriers include, bureaucracy, intensive regulation and registration process and connecting with the right
decisionmakers and business partners.
5
No
19
Yes
39 No answer
Figure 4: Do you experience market barriers in Brazil?
113 INTRODUCING BRAZIL
3.1 History & Geography
The 1988 Brazilian Constitution initiated the decentralization of health services in the country. This eventually
culminated in the creation of the SUS (Unified Health System), distributing responsibility of the majority health
services, delivery and spending to municipalities. Since SUS was established, Brazil has seen an increase in life
expectancy from around 64.4 years in the 1990s to 75.3 years in 2017 - although this is still lower than countries
such as Argentina, Ecuador and Chile. However, three decades into decentralization and there remains huge social
and economic variation across Brazilian municipalities, impacting their ability to deliver quality health care services
to their respective populations.
3.2 People and Demography
Brazil has a population of approximately 212 million people. The population is relatively young with 7.8% of the
population aged 65 years or older (United Nations, 2017). The Brazilian population is expected to grow modestly
with a compound annual growth rate (CAGR) between 0.4-0.6% between 2019-2030 which would amount to 223
million people by 2030 (United Nations, 2017). Brazil only recently became an “Ageing” society as the number of
people aged 65 years and older tripled to 18.3 million between 1988 – 2018. This growth trend is forecasted to
continue to 49 million in 2048 (BMI, 2017) (see Annex 4 for more population pyramids). Brazil is a highly urbanised
country, with over 80% of the population living in urban districts.
Figure 5 Population density and population pyramid (2050) in Brazil (IBGE, 2019) (United Nations, 2017)
(Noronha, 2018)
Brazil is a country with a highly unequal distribution of wealth, a fact that is supported by its Gini coefficient of 53.33.
This high rate of inequality means that different segments of the population have widely different budgets in terms
of their ability to purchase supplementary or private health services. There are several different concepts of social
classes in Brazil, but the one that is most widely adopted by the market classifies society in letters from A to E. These
are the classes as defined by the Brazilian Institute for Geography and Statistics, known as Instituto Brasileiro de
Geografia e Estatística or simply IBGE in Portuguese. IBGE defines the income based social classes in multiples of
the national minimum salary which is currently R$ 998 (Nes, 2016) (Trading Economics, 2019). Many of these classes,
and especially the poorer once, are primarily dependent on the Sistema Único de Saúde (SUS) as their main provider
of health services (Section 4). The five classes are displayed in table 2.
12Table 2 Income groups in Brazil (Nes, 2016) (ABEP, 2016)
Classification Proportion of Population Household Gross Monthly Income
Class A 2.9% Above R$ 15,760
Class B 22.3% Above R$ 7,880
Class C 47.8% Above R$ 3,152
Class D 14.1% Above R$ 1,576
Class E 12.5% Below R$ 1,576
3.3 Economy
Brazil is an upper middle income country and ranks and has the 9th largest economy in the world. In 2017 the
Brazilian economy was composed of 72.7% service sector, 20.7% industry, and 6.6% agriculture (CIA, 2019). In terms
of the labour force, 58.5% work in the service sector, 32.1% work in industry, whilst 9.4% work in agriculture (CIA,
2019). The Brazilian economy has been going through a prolonged period of recession. The countries growth rate
has been slowing for the past 2 decades with the annual growth rate dropping from 4.5% between 2006-2010 to
2.1% between 2011-2014. In 2018 the Brazilian economy is recovering slowly and grew by 1.1%. Key economic
indicators are displayed in table 3.
Text Box 1: The Brazilian Population’s Relatively Low Purchasing Power
Although Brazil ranks as the world’s 9th biggest economy, its GDP in terms of purchasing power parity (PPP) is
more typical of an emerging market. In 2018 Brazil’s GDP per capita (purchasing power parity) was 16.15
thousand US$. This is much lower than the purchasing power in regional neighbours Chile (25.98 thousand)
and Mexico (20.6 thousand). To illustrate, PPP GDP per capita comparison: the United States (62.61 thousand),
the United Kingdom (45.7 thousand), or the Netherlands (56.38 thousand). (IMF, 2018).
Find out more information at IMF’s World Economic Outlook
Table 3: Economic indicators for Brazil *indicates projected numbers (IMF, 2019)
Netherlands Brazil
2018 2016 2017 2018* 2019* 2020* 2023*
GDP PPP (bn US$) 972 3160 3250 3370 3500 3660 4160
real growth (%) 2.8 -3.3 1.1 2.1 2.1 2.5 2.2
per capita PPP (000) 56.57 15.41 15.74 16.15 16.66 17.32 19.32
Inflation rate (%) 1.4 8.7 3.4 3.7 3.6 4.1 4
Unemployment (%) 3.9 11.3 12.8 12.3 11.4 10.2 9.3
Government net 1.1 -9 -7.9 -6.8 -7.3 -7 -6.2
lending/borrowing (% of GDP)
Government gross debt (% of GDP) 54.4 78.3 84.1 87.9 90.4 92.4 96.5
3.4 Trends in Brazil’s Health Status and Interventions
Brazil has a triple epidemiological burden: the persistence or re-emergence of infectious diseases, the upward trend
of Chronic Noncommunicable Diseases (NCDs) and increasing cases of death by external cause.
133.4.1 Rise in Noncommunicable Diseases (NCDs)
The biggest health challenge in Brazil comes from the persistent increase in chronic noncommunicable diseases. In
2018 these caused 74% of all deaths in Brazil. Life years lost to NCDs are projected to grow by 10% by 2030 with
diabetes, cancer, neuropsychiatric conditions, and cardiovascular disease amongst the top conditions responsible.
In 2017 the leading cause of death in Brazil was heart disease, followed by stroke (World Health Organization, 2018).
Noncommunicable diseases are becoming a severe challenge to Brazil’s public health system, which currently acts
only on the consequences of these diseases. However, NCDs require a different approach, and effective interventions
bring economic benefits since they often cost less than treating these diseases.
Figure 6: Top 10 Causes of Death in 2017 and Percent Change, 2007-2017, all ages, number (Healthdata.org, 2017)
Decreasing but Persistent Burden of Communicable Diseases Burden
Mortality rates from communicable diseases have reduced significantly over the last few decades (from 45% in the
1930’s to 7.5% in 2018). This was achieved through improvements in basic sanitation and infrastructure, and targeted
public policies. However, the burden of communicable disease in Brazil still deserves attention. In recent years
multiple diseases were declared a “Public Health Emergency of International Concern” including the Zika virus in
2016 and the measles epidemic in 2017. This has led to the Brazilian government vaccinating approximately 11
million children under 5 years old (Lima-Costa, 2018) (UNICEF, 2019). Other emerging infectious diseases and major
influenza epidemics (e.g. SARS, H1N1), which require specific measures for quick and mass intervention are also
proving burdensome for the Brazilian health system.
Slight Decrease in Brazil’s Maternal/Child Health Status
After dropping for 26 consecutive years, infant mortality saw a relative increase of 5% in Brazil in 2016. There exists
some controversy regarding the cause of the increase with some Brazilian stakeholders pointing to budget cuts on
the primary care level while others see the 2016 Zika and chikungunya epidemics as main causes. (Collucci, 2018)
(The Guardian, 2018).
Maternal deaths or near-misses caused by pregnancy-related complications were associated with barriers to access
to specific healthcare services and with inadequate monitoring of complications in the hospital setting (Pacagnella,
et al., 2018) (Pacagnella, et al., 2018).
In Brazil, there is an unmet demand for contraceptives, estimated at 7.7%, which affects between ∼3.5 to 4.2 million
women of reproductive age. Of the total number of births in the last five years, only 54% were planned, and
unintentional pregnancies were reported by 55.4% of postpartum women (Pacagnella, et al., 2018).
14Ageing Population
Mainly due to high inequalities in Brazil’s economy, the health status and life expectancy of its population, lags
behind that of countries with comparable or even lower developed economies. In Brazil the life expectancy at birth
is 71.4 and 78.9 for males and females respectively, while the average healthy life expectancy is 66.0 (compared to
72.1 in the Netherlands). These figures are similar to that of Peru, Thailand, Saudi Arabia and Bulgaria while regional
countries such as Mexico and Chile score higher than Brazil (World Health Organization, 2016).
The longevity and healthy life expectancy of Brazilians has increased significantly over the past decade, partly thanks
to the improvements in the country’s healthcare system, leading to fast growth in the senior population (Lima-
Costa, 2018).
Disability is a major concern in the context of population aging caused by increase of the segment of frail people
within the senior population (Noronha, 2018). A recent study estimated that about 6.5 million Brazilians aged 60
years or older need help to carry out activities of daily living, 360,000 did not get help although they needed it, and
at least 5.7 million relatives or friends provide informal (nonpaid) care for older adults (Lima-Costa, 2018).
Enabling seniors to live independently is an end-goal of Brazilian policy. The number of seniors spending significant
amounts of time in isolation (loneliness) however is also on the rise. This is a negative development as this has been
associated with a worse health status and health-related habits (Negrini, 2018). There are therefore policies aimed
at social cohesion.
3.5 Variance in Health Status and Outcomes
Brazil’s healthcare access is not equal across the country, with those using the public healthcare system far less likely
to receive treatment. In 2017 the public health system was serving a population of 207.7 million people and the
private health system was serving 42.5 million people. Yet, those receiving chemotherapy in the SUS was just 3.1
million people (1.5% of the total population served) compared to 2.3 million in the private sector (5.4% of the total
population served). Thus, those able to afford supplementary private health insurance were almost 4 times more
likely to receive chemotherapy treatments should they be diagnosed with cancer. To further compare SUS and
Supplementary health view table 4.
Table 4: Public (SUS) versus Supplementary Healthcare (Montone, 2019)
Description Public (SUS) (million) Supplementary (Private) (million)
Served Population 207.7 42.5
Moved Resource (R$) 268,060.0 198,800.0
Admissions 11.4 8.0
Appointments 501.7 270.0
Exams 902.1 817.0
Chemotherapy 3.1 2.3
3.5.1 Rural Health
There are large regional disparities in health outcomes, infrastructure, and availability of public services in Brazil,
and these are often along urban-rural divides (Mullachery, Silver, & Macinko, 2016). According to the World Bank,
an estimated 14% of the Brazilian population live in rural areas (Trading Econmics, 2016). There is a shortage of
15physicians in rural areas and this is one of the factors that contribute to poor health outcomes associated with
remote regions of Brazil. Brazil's Northeast region is the poorest and least developed area in the country and hosts
the most concentrated population of rural poverty in all of Latin America. As can be observed in Figure 9 below,
most of the hospitals in the Northeast region are small hospitals (less than 50 beds) and are situated more than
120km away from a high complexity centre.
Figure 7 Map showing HCC distribution in Brazil (Rocha, 2017)
A recent study also found that out of 5565 municipalities, as many as 824 (14%) did not have access to a high
complexity centre (where essential surgery services are offered) within a 2-hour drive (Rocha, 2017). As with most
other countries in the world, the shortage of physicians in rural areas is one of the contributing factors to poor
health outcomes associated with remote regions. In 2014, 14 percent of the Brazilian population was considered to
be living in rural areas. The north, northeast and midwest regions are areas experiencing the greatest shortage of
physicians. The northeast is a well-developed region of Brazil.
3.5.3 Indigenous and Rural Populations
Brazil is home to roughly 240 indigenous tribes, totalling around 90 000 people (Survival International, 2019).
These populations live in 690 designated territories which are almost all within the territory of the Amazon
rainforest. Brazilian tribes come in many shapes and sizes, from tribes who are well integrated into mainstream
Brazilian society to a few rare tribes who live deep within the Amazon. Some of these tribes are yet to have ‘first
contact’ with modern Brazil. What all indigenous populations have in common, however, is a lower health status.
This is mostly caused by a lower use of quality health services, caused by geography, finances and/or a deficit in
health literacy. The Brazilian government tries to combat these discrepancies through the FUNAI (Fundação
Nacional do Índio) which executes policies relating to indigenous peoples. Many indigenous groups live in rural
areas of Brazil, and since only 6.2% of the total rural population has supplementary private health insurance, most
depend on public health services (Almeida, 2018).
163.5.4 Urban Health Status in Communities
22.3% of the Brazilian population live in poor, neglected and underdeveloped urban communities. Brazil’s last census
6 329 communities were identified in the country with a population of approximately 11.4 million people (IBGE,
2010). Communities house many of Brazil’s poorest and in many cases lack the most basic infrastructure, utilities
and sanitation that are commonplace in modern countries. This causes a range of health issues due to lack of
hygiene and insufficient access to quality health services. The Brazilian government and international organisations
aim to decrease this health discrepancy by investing in Brazil’s underserved populations (Gragnolati et al., 2013).
174 THE BRAZILIAN HEALTH SYSTEM
4.1 The Health System
Brazil’s health system is a decentralized, two-part public-private system that grants access to care to the poor and
the wealthy through two parallel yet partially overlapping tracks. It does this through a network of public facilities
that provide access to care to all Brazilians free of cost, and a parallel private system of operators that provide access
to care primarily to those who hold supplementary private health plans or can afford to pay out-of-pocket. There is
some overlap in the public and private spheres, since individuals with private plans are also entitled to use public
facilities (McGregor, Siqueira, Zaslavsky, & Blendon, 2017). In 2018 the public healthcare system served over 75%1
of the Brazilian population, funded by approximately 281 million reais. The private system on the other hand serves
25% of the population and is funded by approximately 208 million reais (FIPE - Institute for Economic Research,
2019).
4.1.1 Policy
In 2017 the Ministers and Secretaries of Health in the countries of the regions of the Americas unanimously endorsed
the Sustainable Health Agenda for the Americas 2018-2030 (SHAA2030) as the strategic policy instrument that
provides directions and political vision for health development in the region for the next 13 years. The goals
identified in this agenda include (Pan American Health Organization, 2017).:
• The expansion of equitable access to health services, with an emphasis on health promotion and illness
prevention
• Strengthening of stewardship and governance of the national health authority; Strengthening of the
management and development of human resources for health
• The achievement of adequate and sustainable health financing
• Ensure access to essential medicines and vaccines; Strengthening of information systems;
• Development of capacity for the generation, transfer, and use of evidence and knowledge in health;
• Strengthening national and regional capacities to prepare for, prevent, detect, monitor, and respond to
disease outbreaks; Reducing morbidity, disabilities, and mortality from noncommunicable diseases,
injuries, violence, and mental health disorders
• Reducing the burden of communicable diseases and eliminate neglected diseases
• Reduction of inequality and inequity in health
In January 2019 Brazil elected a new government administration into power. With this comes a revised focus and
changes to current health objectives. The latest objectives are yet to be published, however, in his inaugural speech
the new Minister of Health, Luiz Henrique Mandetta stated that “We will write together a new page in public health”
and pointed out his priorities: health promotion and disease prevention with the strengthening of Primary Care,
strengthening of vaccination rates and computerization of the whole Health network (Louzada, 2019). Brazil’s Health
Goals for the period 2018-2030 precede the new administration but remain relevant.
4.1.2 Governance
Brazil’s Ministry of Health (Ministério de Saúde) is responsible for all national health policies, the coordination and
financing of the public health system, environmental health, health information, health supplies, health surveillance,
and scientific research (Saude.gov, 2019). There are 7 secretaries of health within the ministry, who govern with the
supportive of collegiate and affiliated entities (see Figure 10 below). National policies are implemented in a
decentralised manner by states and municipalities. The implementation of primary care is a municipal responsibility,
1
Brazilian sources disagree slightly on the market share of SUS compared to private health insurers, estimating a SUS coverage
between 70-75%.. This is caused mainly by the supplementary nature of private insurance, which lead many patients (particularly
with multiple morbidities) to use both public and private insurance.
18which means that political accountability for primary care is located principally at the municipal level. Each level of
government is obliged by constitution to apply a minimum amount of its own funding resources to health. Thus,
public health financing is a common responsibility for the federal government, states and municipalities.
Figure 8 Organisation of the Health System in Brazil (Saude.gov, 2019)
Collegiate entities Affiliated entities
National Health Council Autarchy (Independent Joint stock companies:
National Council for agencies): ANVISA e ANS [**] Hospital Nossa Senhora
Supplementary Health Public foundations: da Conceição S/A
National Commission for FUNASA and FIOCRUZ [**] Hospital Fêmina S/A
Incorporation of SUS Public company: Hemobrás Hospital Cristo Redentor
Technologies [**] S/A
Ministry of Health
Luiz Henrique Mandetta
Secretariat of Science,
Secretariat of Labor
Executive Secretariat of Primary Secretariat of Specialized Technology, Innovation and Health Surveillance Special Secretariat of
and Education in
Secretariat (SE) Health Care (SAPS) Health Care (SAES) Strategic Health Supplies Secretariat (SVS) Indigenous Health (SESAI)
Health (SGTES)
(SCTIE)
Department of Department of
Undersecretary Department of Hospital, Department of Department of
Undersecretary of Department of Family Immunizations and Health Education
of Planning and Home and Emergency Pharmaceutical Assistance Indigenous Health
Administrative Affairs Health Communicable Diseases Management
Budget Care (DAHU) and Strategic Supplies (DAF) Care (DASI)
(DEIDT) (DEGES)
Department of Department of Health Department of Department of
Executive Board of the Department of Department of
Strategic Department of Science and Analysis and Environmental Health Work
National Health Fund Health Logistics Regulation, Evaluation
Programmatic Actions Technology (DECIT) Noncommunicable Determinants of Management
(DE - FNS) (DLOG) and Control (DRAC)
(DAPES) Disease Surveillance Indigenous Health (DEGERTS)
Department of
Department of Health Department of Department of Management
Certification and Department of Strategic
Economics, Investments Inter-Federative Health Promotion and Incorporation of Health Indigenous Special
Articulation with Articulation of Health
and Development and Participatory Department Technologies and Health District
Philanthropic and Private Surveillance (DAEVS)
(DESID) Management Innovations (DGITIS)
Hospitals (DCEBAS)
Department of SUS Monitoring
Department of Specialized Department of Chronic
Informatics of the and Evaluation
and Thematic Attention Conditions Diseases and
Unified Health System Department
(DAET) STI
(DATASUS) (DEMAS)
Departamento de Saúde
Department of Digital State National Institutes Ambiental, do
Health Superintendenci INCA, INC and INTO Trabalhador e
Emergências em Saúde
According to Decree No. 9,795, published in the Official Gazette (DOU) of 20 May 2019
[*]
INTO, National Institute of Traumatology and Orthopedics Jamil
Haddad
INC, National Cancer Institute José Alencar Gomes da Silva
INC, National Institute of Cardiology
[**]
ANVISA, National Health Surveillance Agency
ANS: National Agency for Supplementary Health
FIOCRUZ: Oswaldo Cruz Foundation
HEMOBRÁS: Empresa Brasileira de Hemoderivados e
Biotecnologia
4.1.3 Health Coverage
Health care services in Brazil are provided in two ways: publicly, through the Unified Health System (SUS) and
privately, through supplementary health service operators, regulated by the ANS (National Agency for
Supplementary Health), and other private establishments (hospitals, clinics, laboratories and autonomous medical
professionals). There is no clear cut separation between the public and supplementary private system. Complex
medical cases that might have been first treated under supplementary private coverage, can be reverted back to
public tertiary specialised hospitals. Moreover, many private hospitals also work in and for the public domain as part
of a philanthropic approach.
Public sector: Sistema Único de Saúde (SUS)
In 1988, the Brazilian Constitution determined that “Health is a right of all people and a duty of the state, guaranteed
by social, economic policies that reduce the risk of disease and other adversities and by universal and equal access to
actions and service.” This statement allowed for the creation of the Unified Health System, known as the SUS (Sistema
Único de Saúde). The main principles of the SUS are universal access, comprehensive care, and equity of actions
19(Stein & Ferri, 2017). The SUS serves approximately 208 million people (98 % of the population), providing free
universal healthcare to all Brazilians (Montone, 2019).
The SUS is funded from the social security budget and is financed by taxes and contributions from employees and
businesses. The funds are distributed to 27 state health departments, which are responsible for providing public
health services. The majority of inpatient care is carried out by private providers, which are reimbursed by the state
authorities. While free medical care is readily available at government hospitals, they are often crowded with long
waiting times for non-emergency medical treatment. Although the SUS has functioned well between 1990-2010,
the Brazilian economic crisis, political agendas, and cases of corruption have resulted in a break down in the system.
Many of the issues facing the SUS are caused by a lack of funding to the system.
Supplementary Health System (SHS)
Approximately 42.2 million Brazilians (22.4% of the population) make use of the Supplementary Health System (SHS)
(Montone, 2019). The SHS consists of private insurers, giving Brazilian businesses and individuals who can afford it
the ability to purchase health care that is easier to access with shorter waiting times. There are currently 737 medical
schemes active in Brazil.
In 2015 restrictions on foreign investment in the Brazilian health market were relaxed, allowing foreign investment
in/foreign ownership of private hospitals in Brazil. This resulted in the consolidation of the private health sector as
overseas investors became interested in the market. Deals include US-based UnitedHealth Group paying
US$4.9bn to buy Amil Participações, Brazil's biggest private health insurer, and US private equity group Bain Capital
buying insurer Notredame Intermedica (the 4th largest insurer) for US$620m in 2014 (KPMG, 2019).
Text Box 2: AMIL - Brazil’s Largest Private Healthcare Company
AMIL is Brazil's largest private healthcare company providing both medical and dental insurance plans, as well
as hospital services. Since October 2012, AMIL has been 90% owned by the UnitedHealth Group, the biggest
health insurance company in the US. Founded in 1972, AMIL serves some 4.6 million people, primarily located
in the states of São Paulo, Rio de Janeiro, Parana and the Federal District. More recently, the company has
expanded into the states of Minas Gerais and Recife. AMIL operates 29 hospitals, 42 clinics and 221 satellite
offices.
4.2 Health Expenditure
4.2.1 Public Sector: SUS
One of the main hurdles in implementing the activities of the SUS is the lack of financial resources available. In 2016
Brazil spent 11.7% of its GDP on health, and although this level of total health expenditure is comparable to other
countries in Latin America. Public expenditure per capita in Brazil is US$ 426.50, which is one of the lowest
proportions of public spending on health in Latin America (Montone, 2019). In 2018, the Federal government’s SUS
expenditure reached US$ 32.2 billion whilst the SUS budget reached was US$ 69 billion (Montone, 2019) (Massuda
et al., 2018).
In May 2016, the previous Brazilian government adopted an extensive reform agenda. This resulted in the approval
of Constitutional Amendment 95, which created the New Fiscal Regime and established a spending cap for the
federal budget. The amendment imposes a ceiling on public expenditures and prevents the expansion of
investments in sectors such as health and education for twenty years. In other words, until the year 2036, public
spending on public services will be frozen in Brazil. Beginning in 2017, the maximum possible variation for public
spending corresponds to inflation for the year. The impact of this amendment presents a particularly negative
outlook for Brazil's public healthcare services given recent cuts to the government's 2016 budget. The Ministry of
Health's 2016 budget was reduced to US$ 27.5 billion from US$ 28.2 billion (Roznai & Kreuz, 2018).
204.2.2 Supplementary Private Health Insurance
Private spending continues to represent more than half of all healthcare expenditure. In 2016 approximately 66.7%
of total health expenditure was accounted for by the private sector, with just 33.2% accounted for by general
government expenditure. This is unusual since the majority of Brazilians make use of the SUS, yet the private sector
trumps the public sector in terms of spending (Montone, 2019).
4.2.3 Health Service Provision
Decentralization is a major aspect of Brazilian governance and a key feature of the SUS. The provision of most
primary health services and nearly half of hospital care has been transferred to municipal governments, which are
responsible for the majority of health care provision in SUS.
Primary Care
The majority of primary care in Brazil is delivered through the public health system, although people are free to
choose whether they wish to make use of the public versus the private system. The management and provision of
public primary health care is the responsibility of Brazil’s 5 570 municipalities (Macinko, Harris, & Gomes, 2017). In
order to provide comprehensive primary health care (PHC) the SUS model has emphasized the rapid scaling-up of
community-based care. Among a number of important initiatives undertaken to develop this approach is the
introduction of the Community Health Agents Programme (Programa Agentes Comunitários de Saúde) and
subsequently the Family Health Strategy (FHS) (Estratégia de Saúde da Família. The FHS delivers primary care for
free at point of use. There are over 41 000 FHS teams across the country, each compromising of GPs, nurses, auxiliary
nurses, and lay health workers, with each team providing primary health care to a defined population (Stein & Ferri,
2017). One’s GP generally guides patients through second and tertiary care should they need it. Unfortunately, the
majority of healthcare resources remain concentrated in the largest cities, with many remote communities still
lacking proper healthcare assistance in primary care (Marcolino, et al., 2016).
21Text Box 3: Filling the Gap Between the Inefficiencies in SUS and Expensive Private Healthcare
Dr Consulta has spotted a business opportunity somewhere between the existing inefficiency in SUS (Brazilian
Unified Healthcare System) and unaffordable private healthcare. What is now a chain of 60 medical centers in
three Brazilian capitals and revenue of R$ 225 million in 2018 has started in 2011 as a pilot clinic in Heliópolis, a
heavily populated poor community in the city of São Paulo. EBITDA is still negative, but Dr Consulta has had five
rounds of investment and raised US$ 95 million among investors such as Madrone Capital Partners, Kaszek
Ventures and LGT, the social impact fund from the royal family of Liechtenstein.
Dr Consulta is a chain of medical centers that Currently Dr Consulta offers primary care and other 40 specialized
care, 100 types of exams and 30 kinds of low-complexity surgeries and aims at speeding up the experience of
the patient by offering consultation 25 times faster than the public healthcare system at a price point 60% to
90% lower than the average price from private services. The concept is based on filling the gap of inefficiencies
in the healthcare system. Of a demand of 1.3 billion consultations annually in SUS, around 800 million are not
held due to mismanagement and inefficiencies in monitoring patients. Specialized care may take an average of
three months to be scheduled and a diagnosis may take up to a whole year to be ready.
Its founder Thomaz Srougi is now taking the first steps towards turning Dr Consulta into a healthtech company.
In its eight years of existence, 1.3 million patients were served and the collected data can now be used in
preventive measures, in the communication with patients and allow for virtual consultations, ultimately adding
value to the healthcare value chain. It is possible that the new direction is a reaction to exhausted market
potential, coupled with increased costs and need to further scale up the business. Expanding is expensive – a
new medical center is estimated at R$ 1 million. Margins are tight, especially as exams have been incorporated
into the set of services, as care is not complete based solely on consultations. Dr Consulta is now partnering
with insurance companies to offer primary and secondary care to their clients.
By moving to a technology-driven company, Dr Consulta is aiming at a model similar to that of Good Doctor,
marketplace by the Chinese insurer Ping An, that connects physicians and patients. The business model
implemented by Dr Consulta has now been copied by such brands as Cia. da Consulta, Amparo and GlobalMed.
Secondary/Tertiary care
Public hospitals in Brazil are mostly used by SUS patients, with many functioning beyond capacity (Business Sweden,
2015). Although there are good quality public hospitals, many are in bad condition with waiting times for procedures
varying from 3 months to a year. Approximately 75% of all hospitals in Brazil are private/non-profit hospitals. These
are mostly attended by those who have supplementary private insurance plans and are generally high quality.
The national healthcare system is increasingly relying on private actors to deliver more healthcare services and marry
the ever-growing demands of the public system with the financial power of the private sector (Costa, 2017). The
National Association of Private Hospitals (ANAHP) had 118 members with 25 118 hospital beds (December 2018).
This corresponds to approximately 10% of all available beds in for-profit and non-profit private hospitals in Brazil.
Although Brazil has the largest hospital infrastructure market in Latin America the market remains fragmented.
While there are over 7 800 hospitals in the country, the average hospital is relatively small (24 beds) (Global Health
Intelligence, 2016). The majority of healthcare resources are concentrated in the largest cities, with many
communities having difficulties accessing specialists and diagnostic examinations (Marcolino, et al., 2016). These
types of shortages of specialty services, coupled with limited administrative capacity have led to poor quality services
in many public hospitals with long waiting times. These tend to be in more rural areas in the Northern parts of Brazil,
where there is a limited number of hospital and medical staff and thus less capacity to meet the demands of the
population (see Figure 10).
22Figure 9 Geographic locations of Brazilian hospitals with pharmacists (blue circles) and without pharmacists (orange
circles) (Santos, 2018)
Figure 10 Concentration of hospitals by state (Business Sweden, 2015)
23Text Box 4: The National Restructuring Programme of University Hospitals (REHUF)
The National Restructuring Programme of University Hospitals (REHUF), developed and funded in partnership
with the Ministry of Education, has been set up to provide financial support for the restructuring and
modernisation of university hospitals. It has seen investment of around R$ 2.5bn (US$ 0.6bn) between 2010 and
2014. Through the REHUF funding programme, university hospitals are being increasingly integrated into the
SUS as providers of reference services and cutting-edge technologies. In addition to REHUF funding, the Ministry
of Health transfers each year approximately R$ 1.2bn (US$ 0.3bn) to help fund medium and high complexity
treatment provided by these establishments. Currently, 46 hospitals and the two other health facilities attached
to universities are part of the programme. These institutions are located in 33 cities across the country, including
24 capitals.
Access to medical services is not equal across Brazil and the number of hospital beds has not kept pace with the
growing population (BMI, 2017). According to the Ministry of Health, the reduction in beds available to the SUS
reflects a move towards more ambulatory treatment and home care. New technology has also decreased the length
of stay and allowed procedures such as vasectomy to be performed on an outpatient basis. Other trends include
greater use of primary care services and emergency units as well as mobile health teams to reduce the pressure on
hospitals (BMI, 2017).
Long-Term Care (LTC)
One of the major challenges facing Brazil’s health system is the rapid aging of its population over few decades.
Brazilians are getting older before the country becomes richer. By 2050, the elderly will make up close to 29% of the
population. This is a concerning issue due to the high costs of long-term care. At the household level long-term
care in Brazil is fragmented, and there is no national policy to support such care. A recent study estimated that 6.5
million Brazilians aged 60 years or older need help to carry out activities of daily living, with 5.7 million relatives or
friends providing this informal (non-paid) care (Lima-Costa, 2018). Thus, Brazil’s legislation has bestowed the main
responsibility on the family, with LTC not covered under the SUS health plan. Older people are eligible for
institutional placement only if they are indigent and completely lacking family support. Care homes in Brazil are very
limited, and available in fewer than 30 percent of Brazilian municipalities, specifically concentrated in the Southeast
and in the larger cities. The majority of care-homes are philanthropic in nature or linked to private health plans. As
a result, fewer than 1 percent of older people reside in care homes (Garcez-Leme & Leme, 2014).
24You can also read