KHOMAS REGIONAL DEVELOPMENT PROFILE 2015 - Khomas Regional Council PO Box 3379, Windhoek Tel.: +264 61 292 4300
←
→
Page content transcription
If your browser does not render page correctly, please read the page content below
KHOMAS REGIONAL
           DEVELOPMENT PROFILE 2015

                          Khomas Regional Council
                          PO Box 3379, Windhoek
                           Tel.: +264 61 292 4300
                               http://209.88.21.122/web/khomasrc
Khomas Regional Development Profile 2015                           Page i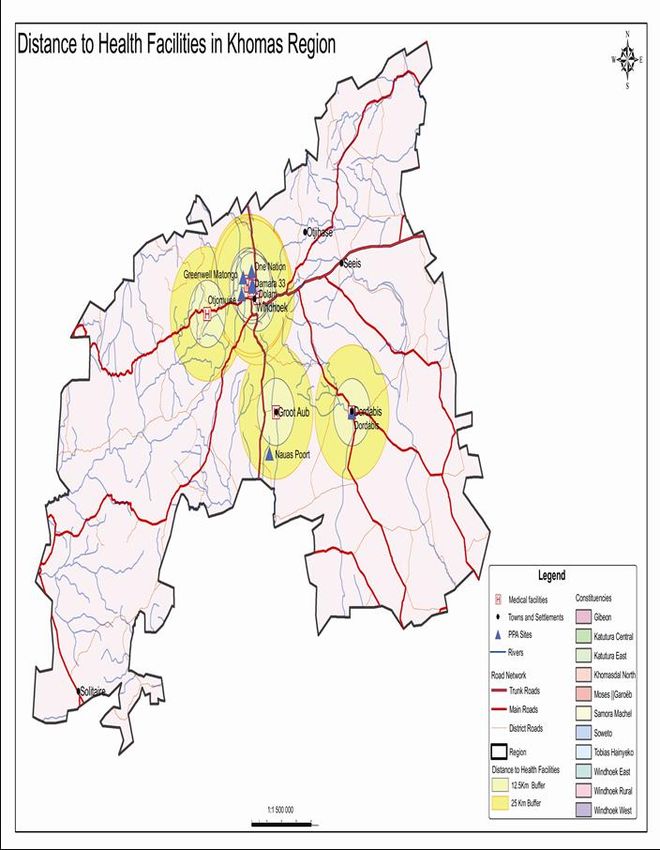
KHOMAS REGIONAL
  DEVELOPMENT
   PROFILE 2015

            ENQUIRIES
         cmafwila@khomasrc.gov.na
       bmweshihange@khomasrc.gov.na
          lshifa@khomasrc.gov.na

  http://209.88.21.122/web/khomasrc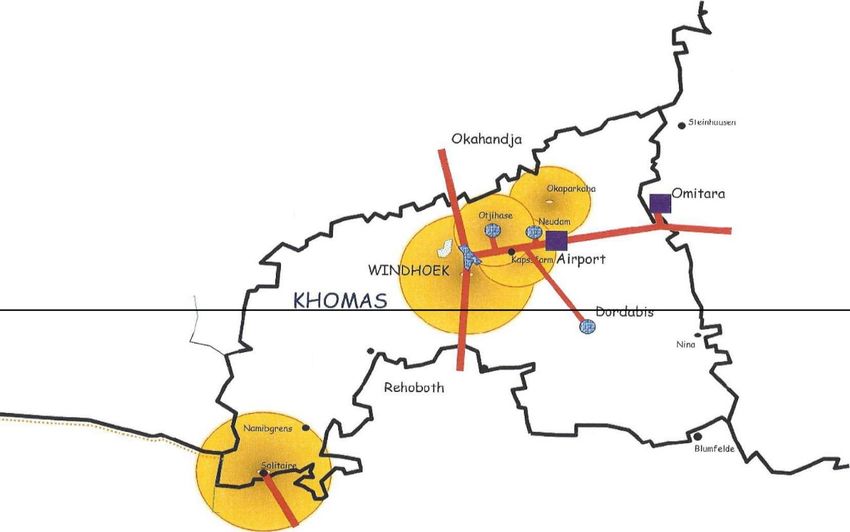
TABLE OF CONTENTS
Acronyms iii
List of Charts, Maps and Tables vi
Acknowledgment 1
Foreword 2
Executive Summary 3
Chapter 1: Introduction
1.1. Introduction to the region 5
Location 6
Size of the region 7
Population and demography 7
Landscape 8
1.2. Governance and Planning Structures 15
1.3. High Level Statements of the Khomas Regional Council 17
1.4. Methodology 18
Chapter 2: Key Statistics
2.1. Demographics 20
2.1.1 Population size 20
2.1.2 Population size per constituency 20
2.1.3 Age composition 21
2.1.4 Population groups 22
2.1.5 Unemployment rate 23
2.1.6 Average Life Expectancy 24
2.1.7 Poverty Prevalence in Khomas Region 24
2.2. Household Percentage with access to: 26
Safe water 26
Health facilities 26
Sanitation 27
Chapter 3: Regional Development Areas 28
3.1. Economic Sector 28
Agriculture 28
Tourism and Wildlife 28
Trade and Industrial Development 29
Mining 30
3.2. Social Sector 30
Housing 30
Health (and health facilities) 34
KRDP 2015 – Table of Contents i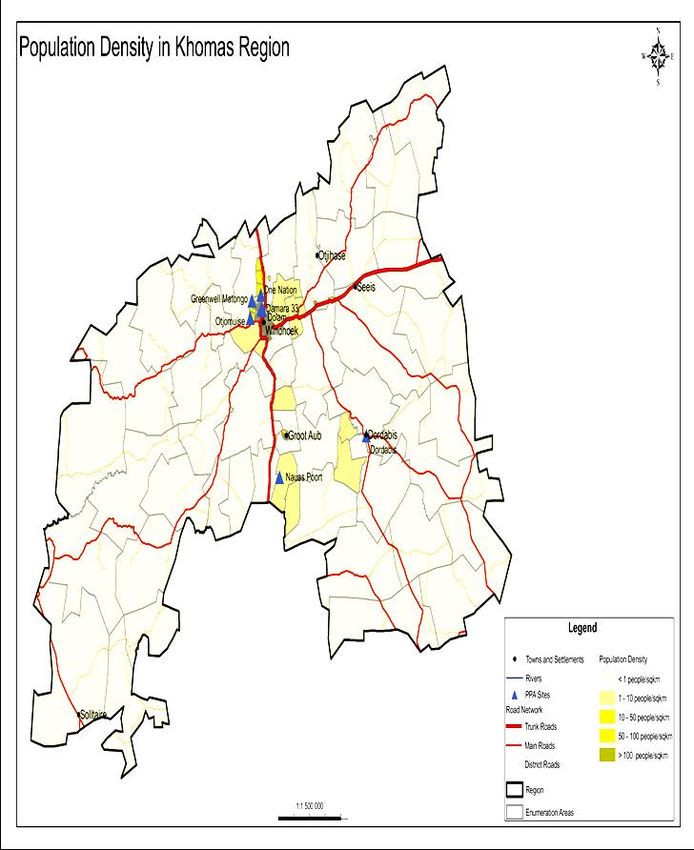
Water and Sanitation accessibility 36
Education and Training 38
3.3. Infrastructure 39
Transport 40
Roads 40
Air 40
Railway 40
Water and Sanitation Infrastructure 43
Telecommunication 44
3.4. Institutional Services 51
Financial and Banking Services 51
Shopping Malls 51
Chapter 4: Regional and Local Government
Introduction 52
Location 53
Population 53
Economic Activities 53
Potential Area of Investment 53
Chapter 5: Regional Comparative & Competitive Advantage
Natural Resources 67
Location 67
Climate 68
Population 69
Regional Development Challenges 69
Annexure
Other Vital Social Statistics 70
List of Institutions and Contact Details 72
References
KRDP 2015 – Table of Contents ii
ACRONYMS

AIDS          Acquired Immune Deficiency Syndrome
ANC           Ante Natal Care
ASEP’S        Annual Sectoral Execution Plans
AUC           African Union Commission
CCD           Control of Diarrhea Diseases
DPI System    Deep Packet inspection
EPI           Expanded Program on Immunization
Gbps          Giga bytes per second
GRN           Government
HIV           Human Immunodeficiency Virus
HPI           Human Poverty Index
HDI           Human Development Index
IMCI          Integrated Management of Childhood Illness
ISP           Internet Service Provider
IT            Information and Communication
IXP           Internet Exchange Program
KRC           Khomas Regional Council
MAWF          Ministry of Agriculture, Water and Forestry
MoEAC         Ministry of Education, Arts and Culture
MET           Ministry of Environment and Tourism
MGECW         Ministry of Gender Equality and Child Welfare
MoHSS         Ministry of Health and Social Services
MHAI          Ministry of Home Affairs and Immigration
MICT          Ministry of Information, Communications and Technology
MIS           Management Information System
MITSMED       Ministry of Industrialization, Trade and SME Development
MLIREC        Ministry of Labor, Industrial Relations and Employment Creation
MLR           Ministry of Land Reform
MTC           Mobile Telecommunications Limited
MSS           Ministry of Safety and Security
MURD          Ministry of Urban and Rural Development
MWTC          Ministry of Works, Transport and Communication
MYNSSC        Ministry of Youth and National Service
NAMCOR        Namibian Police
NamPost       Namibia Postal Services
NamPower      Namibia Power Corporation
NGO           Non-Governmental Organization
NDP           National Development Plan
NHIES         National Housing Income and Expenditure Survey
NLFS          National Labor Force Survey
NPC           National Planning Commission
NRCS          Namibia Red Cross Society
PNC           Post Natal Care
RAN           Radio Access Network

KRDP 2015 – Acronyms                                                            iii
RDP           Regional Development Plan
RDP           Regional Development Profile
RPP           Regional Poverty Profile
SADC          Southern Africa Development Committee
SEPs          Sectoral Execution Plan
SME           Small and Medium Enterprises
SME Bank      Small and Medium Enterprises Bank Limited
Tb            Terabyte
TB            Tuberculosis
VMX           Volcanic Massive Sulphide
WACS          West Africa Cable System

KRDP 2015 – Acronyms                                      iv
LIST OF CHARTS,
TABLES AND MAPS
List of Tables
1. Table 1: Khomas Region at a Glance 10
2. Table 2: Governance Structure 17
3. Table 3: Region Population size in 2001 and 2011 respectively 20
4. Table 4: Khomas region population size per constituency 21
5. Table 5: Age Composition in Khomas region for 2001 and 2011 22
6. Table 6: Population groups by tribe in 2001 and 2011 23
7. Table 10: Number of households with Access to Health facilities 26
8. Table 11: Summary of Education Statistics 39
List of Charts
1. Chart 1: Khomas Region’s Economically Active Population 24
2. Chart 2: Percentage of the population by source of toilet facility 27
3. Chart 3: Type of Housing 31
4. Chart 4: Type of Tenure 32
5. Chart 5: Access to Toilet Facility 37
6. Chart 6: Source of Energy 41
List of Maps
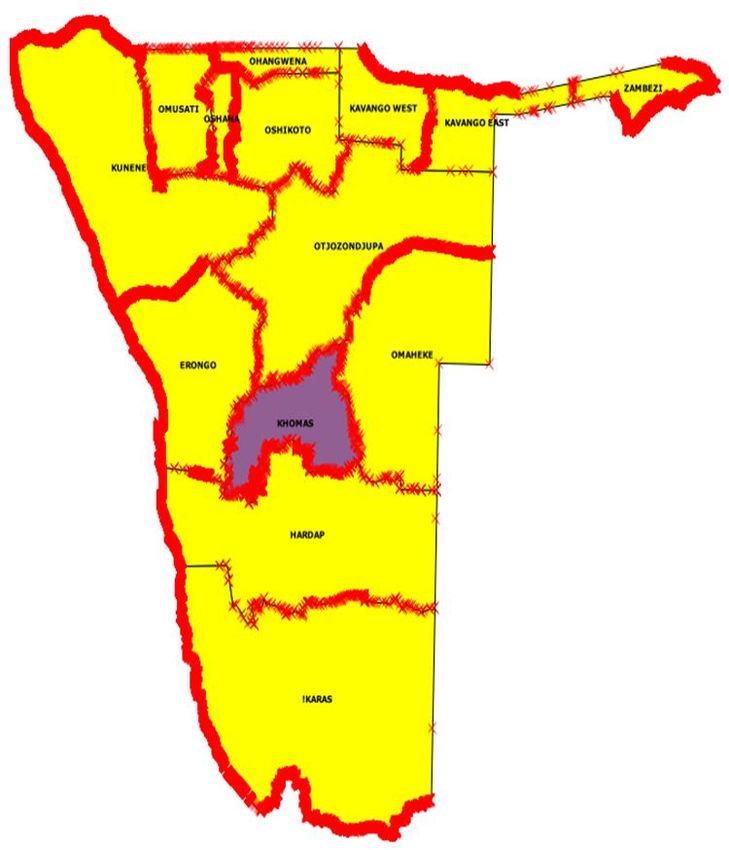
1. Map 1: Location of Khomas Region in Namibia 6
2. Map 2: Khomas Regional Map 7
3. Map 3: Population Density Map in Khomas Region 8
4. Map 4: Distance to Health Facilities in Khomas Region 33
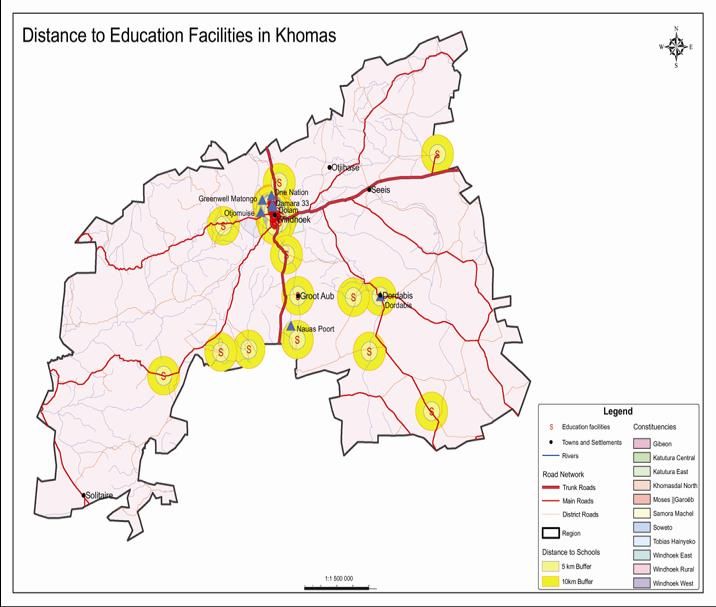
5. Map 5: Distance to Education Facilities in Khomas Region 37
KRDP 2015 – List of Tables & Maps vi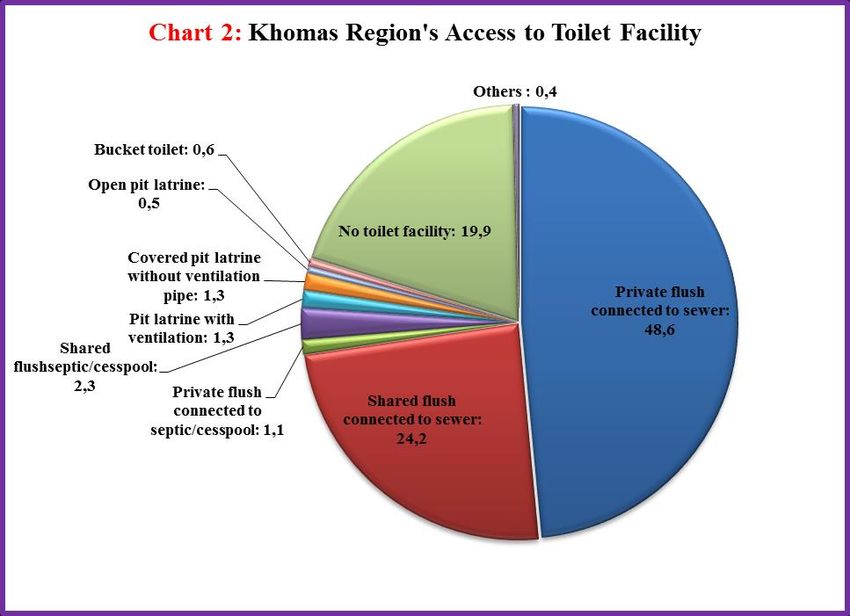
ACKNOWLEDGEMENT

The National Planning Commission (NPC) has embarked on the formulation of Regional
Development Profiles for the 14 regions. This very important exercise is in line with their
mandate, to plan and spearhead the course of national development, in terms of Article 129 (1) of
the Constitution of the Republic of Namibia and the National Planning Commission Act, 2013
(Act 3 of 2013). The development that NPC is spearheading is taking place in the country’s 14
administrative regions, which in turn are composed of 138 Constituencies. Hence, NPC has been
making regional consultations and profile each region comparative advantages in order to fully
exploit regional economic potentials through implementation of programmes and projects that
respond to the needs of the people.

Profiling the regions will improve the way various sectors carry out their development planning
as each profile will be a guiding document on potential programmes and projects that need to be
implemented in each one of the regions. As such, the Regional Development Profiles (RDPs)
will guide and enable different sectors to identify programmes and projects as per the needs of
the regions and include their Sectoral Execution Plans (SEPs) and Annual Sectoral Execution
Plans (ASEPs) that are in line with the needs of the regions as reflected in the Regional
Development Profiles and National Development Plan.

Our word of appreciation goes to all the stakeholders who worked in partnership with Khomas
Regional Council to develop this Khomas Regional Development Profile 2015.

…………………………………..….
Mr. Clement M Mafwila
Chief Regional Officer

KRDP 2015 – Acknowledgement                                                              1
FOREWORD

The Constitution of the Republic of Namibia, article 129 (1) and the National Planning
Commission Act, 2013 (Act 3 of 2013) has mandated the National Planning Commission to plan
and spearhead the course of national development in all 14 administrative regions. Hence it is
important that each region compile a regional profile in order to fully explore the insight of the
region’s possible developments and responding to economic, social and infrastructural needs of
the people.

The Khomas Regional Profile will therefore assist in improving the way in which various
developmental sectors conduct the planning and implementation of their programmes. This
Regional Profile provides our Municipality, ministries and organizations with information which
may assist in planning, budgeting and the prioritization of services. The areas covered in this
profile include information on demographics, education, agriculture, social statistics, labor force,
economy, infrastructure and institutional sectors.

The profile shall reflect the socio-economic reality of the region. As such, valuable insight can
be gained as to the developmental challenges faced by communities residing within the Khomas
region. This profile uses data primarily sourced from various surveys and censuses. The
Regional Councils Act (Act No. 22 of 1992), Local Authorities Act (Act 23 of 1992), the
Decentralization Policy, National and Regional Developments Plans, labor force survey reports,
Food Security and Nutrition Action Plan 2006-2015, Rural development Strategy and the NHIES
reports are also sources providing policy and technical direction behind this profile.

The format of the profile allows for easy readability with data being displayed in table or graph
format, with the accompanying relevant analysis. The Khomas Regional Profile provides
information to policy makers and planners in order to develop effective policies and
implementable plans, while it empowers communities and give them an opportunity to re-
evaluate their own situation with a critical eye for improvement. With the new approach of
Integrated Results-Based Management, we need to ensure that everything we plan makes an
impact on the lives of those that are poor.

I note that there are numerous root causes of poverty in the Khomas Region, such as
unemployment, alcohol abuse, HIV/AIDS and crime, among others. Now it is up to us as
residents of Khomas Region to ensure that these issues are addressed, because shaping the future
of Khomas Region depends on our ability and willingness to respond with innovation and
commitment to new challenges.

……………………………………………
Cllr. Rachel Jacob
Chairperson: Khomas Regional Council

KRDP 2015 – Foreword                                                                        2
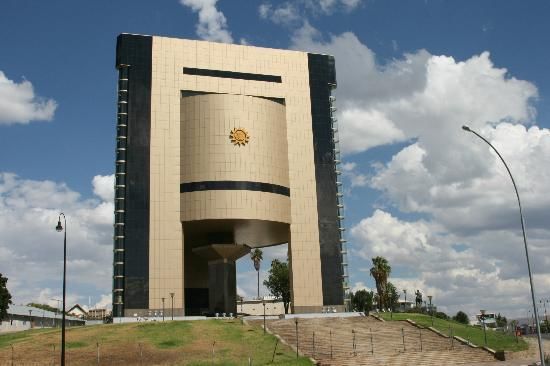
EXECUTIVE SUMMARY

The objective of this profile is to draw the attention of the potential investors, domestic and
foreign, residents and tourists to the unlimited opportunities that the Khomas Region has to offer
in all spheres of socio-economic development. Khomas Region is the right place to consider for
investment in mining, agriculture, aquaculture, tourism, manufacturing, services as well as many
other potential areas that might interest any potential investors.

The aim of this Regional Development Profile is also to provide relevant and efficient
information to policy makers, planners, stakeholders, institutions and the community at large to
enable them to understand detailed findings of the socio-economic, demographic, households
and development characteristics of the Khomas region.

The Khomas regional economy is predominantly well developed, so investment can be made in
any sector, but also in many specific others where opportunities abound. Other sectors like Agro
processing industries can further be established to add value to all kinds of agricultural products
locally, in line with te country’s “Growth at Home Strategy” under Namibia’s Industrial Policy.
Diversification of the economy can be achieved by introducing numerous other value addition
projects. Indeed, there are so any areas where the returns on investment look ever and ever very
promising.

Places of historic interest, exceptional beauty and natural attractions hold such a great potential
to continue putting the Khomas Region on the map as a major tourist destination, resulting into
boosting tourism and related service industries. Our banking, financial and infrastructure services
boost to be among the best in SADC, Africa and the world. Doubtlessly, the region boasts an
array of attractive opportunities of which the list is endless.

The Khomas Regional Council invites you to the Khomas Region. To the equation spelt above,
the only missing ingredient is you – the potential Investor, domestic or foreign entrepreneur and
tourist that will enable us to unleash the unlimited opportunities we hold.

In this Khomas Reginal Development Profile you will find in:

Chapter 1. You are given an introduction to the Khomas Region. While the capital of Khomas,
Windhoek forms the administrative, legislative and judicial centre of the country, with a
population representing over 16% of the total population, it is also the most important business,
educational and transport (rail, road, air) centre of Namibia. Most of Namibia's supply
(manufacturing) industries are based here, although it cannot be considered as an industrial
centre. Khomas region is considered as one of the fast developing and equipped region in terms
of infrastructural development, a well-developed economic, financial, and trade sectors, home to
most government ministries, institutions and other private company headquarters.

KRDP 2015 – Executive Summary                                                              3
Under this chapter, issues pertaining to location, size of the region, landscape, governance and
planning structures are also discussed.

Chapter 2. Key Statistics. The demographics of a population are referred to a selected
population with distinctiveness such as gender, age and population group. Demographic
information is important as they inform key policy decisions, ensure proper and informed
planning and allocation of resources. This section outlines the population size, age composition
and the (population groups) distribution of the Khomas Region.

Specific areas discussed are: population size; age; population groups; employment; life
expectancy; poverty, etc.

Chapter 3: Regional Development Areas. Here we are considering economic and social sectors
and their components.

Chapter 4. Regional and Local Government. Here, ad in addition to Chapter 3 above, economic
activities and potential areas in agriculture, fisheries, torurism, wildlife, trade and industry,
forestry, mining, etc are explored further.

Chapter 5: Regional Comparative and Competitive Advantage. In addition to our introduction
in this Executive Summary, here we bring out additional salient areas that hold potential for
growth and investment in the region. However, we concentrate more on the resources that the
Region has to offer.

Then there is annexure, giving a list of institutions and their contact details in the Khomas
Region.

In conclusion, and as we wish you happy and informative reading, we welcome you to the
Khomas Region!

KRDP 2015 – Executive Summary                                                            4
CHAPTER 1:
                                     INTRODUCTION

1.1.   Introduction to the Khomas Region

The name of the Region reflects the prominence of the Khomas Hochland mountain range near
Windhoek. This Region, centred on Windhoek as the capital of Namibia, is the most central
Region in the country and has a surface area of 36 805 KM squared. The Region comprised of
ten (10) constituencies: John A. Pandeni, Katatura Central, Katatura East, Khomasdal, Moses
//Garoëb, Samora Machel, Tobias Hainyeko Windhoek West, Windhoek East, and Windhoek
Rural. Despite of being situated in the municipal boundaries, these constituencies are seen to
have different characteristic (demographically, geographically, politically and economically.

While the capital forms the administrative, legislative and judicial centre of the country, with a
population representing over eleven % of the total population, it is also the most important
business, educational and transport (rail, road, air) centre of Namibia. Most of Namibia's supply
(manufacturing) industries are based here, although it cannot be considered as an industrial
centre. Khomas region is considered as one of the fast developing and equipped region in terms
of infrastructural development, a well-developed economic, financial, and trade sectors, home to
most government ministries, institutions and other private company headquarters. The potential
for further development of light industries and new settlement areas seem presently to be
unlimited.

Although the infrastructure of Windhoek is well developed, it does not extend equally to all parts
of the urban area. The majority of the Windhoek populations are regular salary earners,
predominantly in the service of the state and related agencies (e.g. parastatals, organizations) and
commerce. As the capital and the most important metropolitan area in the country, it has become
attractive to rural dwellers seeking work opportunities. There is a strong interaction between the
farming community in the hinterland of Windhoek and the city. Not only are most of the farming
products marketed in or through Windhoek but it is also the most important farming supply
centre.

KRDP 2015 – Chapter 1: Introduction 5 Location
Khomas Region is one of only three regions in the country to have neither a shoreline nor a
foreign border. To the North it is bordered by the Otjozondjupa Region, to the East by the
Omaheke Region, to the west by Erongo Region and to the South it is bordered by the Hardap
Region. The southern border of the Khomas Region includes the northern part of former
Rehoboth Gebiet. It comprises an area which is also predominantly cattle-producing with similar
agro-economic interests to the rest of the Region. It is a properly proclaimed farming area. To a
large extent, the border line forms a natural division between the predominantly cattle producing
central part of Namibia and the predominantly small stock farming area of southern Namibia.
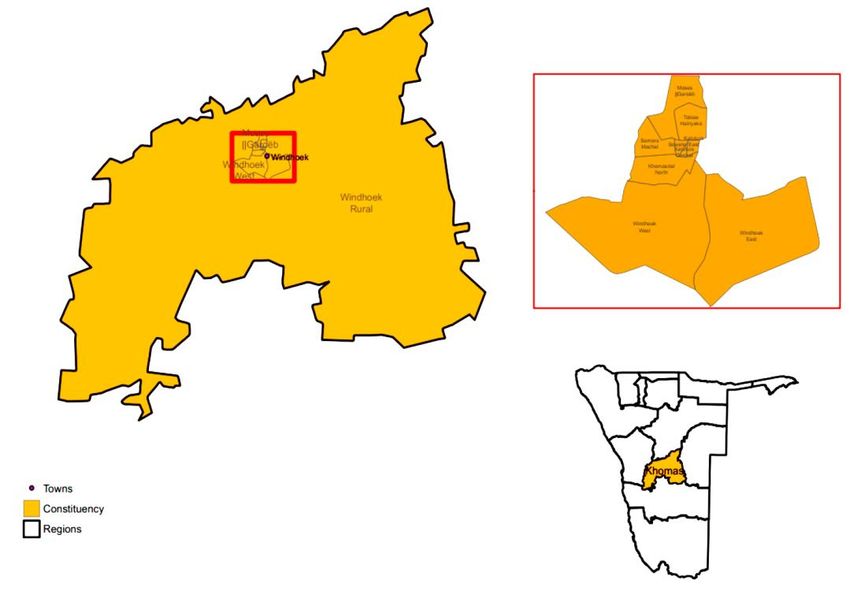
Map 1:Location of Khomas Region in Namibia
KRDP 2015 – Chapter 1: Introduction 6 Size of the Region
The Khomas region covers a total area of 36 861 km2 which is about 4.5 % of the total area of
Namibia of which private individuals and companies on freehold land control the majority (94.2
%) of the region. The rest of the land is allocated to the City of Windhoek.
Map 2:Khomas Regional & Constituency Map
Population Demography
The Namibia Population and Housing Census Basic Report indicates that Namibia’s population
in 1991 stood at 1.4 million and grew to 1.8 million in 2001. The population now stands at just
over 2.1 million as indicated by the 2011 census conducted from 26 August to 15 September
2011. This is an increase of only 282,747 people between 2001 and 2011.
Khomas region has the highest population density with over 342,141 heads counted during the
2011 census period. The regional growth rate indicates that Khomas region’s population have
rapidly increased. In the last decade, Khomas had a population of 250,262 in 2001 escalating to
342,141 by 2011.
KRDP 2015 – Chapter 1: Introduction 7Map 3: Population Density Map in Khomas Region Khomas Region’s Total Population Khomas Region 342,141 Windhoek 325,858 1. Tobias Hainyeko 45,912 2. Katutura Central 24,608 3. Katutura East 18,501 4. Khomasdal 43,921 5. John A. Pandeni 15,121 6. Samora Machel 50,110 7. Windhoek East 22,712 8. Windhoek Rural 22,254 9. Windhoek West 53,438 10. Moses //Garoëb 45,564 Landscape The Khomas Region is divided into the escarpment of the Khomas Hochland and the Inland Plateau and has three prominent mountain ranges: the Eros Mountains to the north-east of Windhoek, the Auas Mountains to the south-east of Windhoek and the Khomas Hochland mountain range to the west of Windhoek. The Khomas Region, characterized by its hilly countryside and many valleys, averages an altitude between 1,400 and 1,600 metres above sea level, with the slope gradually decreasing to the west. The Khomas Hochland mountain range is KRDP 2015 – Chapter 1: Introduction 8
an important water separator since some of Namibia’s most important ephemeral rivers, the
Swakop, Nossob, Oabob and Kuiseb, originate here, which are important for the recharging of
ground water resources and surface water supplies.

The landscape provides good sites dams, the most prominent being the Friedenau, Goreangab
and Avis Dams, while numerous smaller farms dams are constructed on private farmland.
However, large-scale industrial development in Windhoek is restricted by the availability of
water for industrial use, as the city is dependent on piped water from dams located outside the
Khomas Region, especially the Von Bach and Swakoppoort Dams, both situated within the
Otjozondjupa Region (KRC 2001). The Khomas Region is of complex geological formation.
Explorations in the central part have found Volcanogenic Massive Sulphide (VMS). The Kleine
Kuppe Formation sandstones contain SEDEX-type of deposits, while the Kamtsas Formation in
the south of the region holds copper-type minerals. However, mining in the region is not
particularly economic significant, with only the mine at Otjihase for copper, lead and zinc, being
operational at this present time. The Khomas Region has three types of rock formations, firstly,
the Damara Sequence and the Swakop Schist that limit the use of groundwater to commercial
farms, secondly, aquifers around Windhoek, which are important water reservoirs for Windhoek,
and thirdly, sand and loam in the eastern part of the region (KRC 2001). Only 0.1 % of the land
in Windhoek is used for cropping (Mendelsohn et al 2002).

The climate in the region can be described as mild sub-arid with an average annual mean rainfall
ranging from 200 to 400 mm across the region, increasing from west to east (Mendelsohn et al
2002). The evaporation potential is high, between 3,200 – 3,400 mm per year. As result of its
high altitude, Windhoek and its immediate surroundings are the only parts in Namibia
experiencing a dry steppe climate. The annual mean temperature varies from 18°C in the Central
Highlands around Windhoek to 22°C in the lowland areas. The mean maximum temperature in
the summer months varies from 28°C in the Central Highlands around Windhoek to 34°C in the
lowland areas, but this can also rise to 40°C. The mean minimum temperature in the winter
months varies from 2°C in the Central Highlands around Windhoek to 8°C in the lowland areas,
but can drop below zero. Temperatures in the Khomas Region fall within the average for the rest
of the country with other regions experiencing more extreme temperatures during the coldest and
hottest months (Mendelsohn et al 2002).

The vegetation of the Khomas Region is mainly dense shrub land and can be classified as the
Highland Savannah and the Camel Thorn Savannah. The Highland Savannah area, which covers
most of the region, consists mainly of acacia thorn trees, such as the Acacia karoo, A. mellifera,
A. erubescens and A. hereroensis. The other species which can be found in this area include
Combretum apiculatum and Ziziphus mucronata. The vegetation comprises bushes, shrubs and
good grass cover in parts. Towards the west, the vegetation becomes sparser and the trees do not
grow to a great height. The Camel Thorn Savannah consists mainly of Acacia erioloba, which

KRDP 2015 – Chapter 1: Introduction                                                       9
dominates the vegetation in the eastern and south-eastern parts of the region (Mendelsohn et al
2002 and KRC 2001).

The Khomas Region has an abundance of wildlife. The number of large herbivores in the
various areas of Khomas Region ranges from five to eight such as kudu, gemsbok (oryx),
springbok, red hartebeest and steenbok can be found. The number of bird species in the various
areas of Khomas Region ranges from 171 to more than 230, while reptile species range from 61
to 80 (Mendelsohn et al 2002 and KRC 2001. The Daan Viljoen Game Reserve, which is well
known for its bird life, is located just outside the capital of Windhoek and is the only park within
the Khomas Region (KRC 2001).

Khomas Region has the basic infrastructure necessary for transportation and telecommunication,
while water and electricity is supplied to the urban area. Windhoek forms an important railway
junction, linking the city with the rest of the country`s rail network as well as South Africa. The
major national roads connect the city with Namibia’s southern, eastern and northern neighbours.
The country’s international airport, Hosea Kutako International Airport, is located approximately
35km east of Windhoek, while the national airport, Eros, links Windhoek to the rest of Namibia
and to Botswana and South Africa via Air Namibia flights, and small private air companies
(KRC 2001).

                         Table 1:       Khomas Region at a Glance

                          Indicator                                 Khomas           Namibia
                                                                    Region           Overall
                          Land Area

Total Area (sq. km)                                                  36,861          824,116

Area of region (% of total land area)                                 4.47             100

                          Control Over Land (% of total land area)

Central Government                                                    1.4 *            19.6

Local Authorities                                                      4.4*             0.9

Private Individuals and Companies on Freehold Land                    94.2 *           43.3

Private Individuals on Communal Land                                    0               5.9

Traditional Authorities and Small-scale Farmers on                      0              30.3
Communal Land

KRDP 2015 – Chapter 1: Introduction                                                           10
Indicator Khomas Namibia
Region Overall
* These figures have been estimated from (Mendelssohn et al 2002)
Climate & Rainfall
Varies from 18 Varies from < 16 (coastal
(Central Highlands strip) to > 22 (north east and
Annual Mean Temperatures (0 C)
around WHK) to 22 north central Namibia)
(lowland areas)
Varies from 28 Varies from 20 (coastal strip)
(Central Highlands to > 36 ( central areas of
Mean Maximum in Summer (0 C) around WHK) to 34 southern Namibia)
(lowland areas )
Varies from 2 (Central Varies from < 2 (areas to the
Mean Minimum in Winter (0 C) Highlands around east of Mariental) to >10
WHK) to 8 (lowland (coastal strip)
areas)
Varies within the Varies from < 50mm (along
Mean Annual Rainfall (mm) region from 200mm the coastal strip) to > 600mm
(eastern Caprivi)
to 400mm
0.1% of the land in the Varies from one area to
Average Cropping Period Khomas Region is another within the 13 regions
used for cropping
Population
Population Size 250,262 1,830,330
Pop. Size as a %age of National Pop (%) 13.67 100
Annual Growth Rate (% per annum) 4 2.6
Urban (% of total) 93.3 33
Rural (% of total) 6.7 67
Sex Ratio: Males per 100 Females 103 94
Population Density (persons/sq km) 6.8 2.1
Age Composition (%)Indicator Khomas Namibia
Region Overall
5 - 14 Years 18 26
15 - 59 Years 67 52
60 Years & above 4 7
37.2 48.0
Main Language Spoken at Home (% of households) (Oshiwambo) (Oshiwambo)
Marital Status (age 15 yrs and above)
Never Married (%) 61 56
Married with Certificate (%) 24 19
Married Traditionally (%) 3 9
Married Consensually (%) 7 7
Divorced/Separated (%) 2 3
Widowed (%) 2 4
Lifetime migration
% of the Female 41.5 N/A
Population Born in Khomas
% of the Male Population Born in Khomas 36.9 N/A
% of the Total Population Born in Khomas 39.2 N/A
Household Characteristics
Total No. Households 58,580 346,455
Average Household Size (no. of people) 4.2 5.1
Average Household Size Urban (no. of people) 4.2 4.2
Average Household Size Rural (no. of people) 4.0 5.7
Household Headship (%)
Female 36.0 45.0
Male 64.0 55.0
Education & Literacy
No. of Schools 74 1,598
No. of Learners 55,142 553,017
KRDP 2015 – Chapter 1: Introduction 12Indicator Khomas Namibia
Region Overall
% Female 51.4 50.7
No. of Teachers 2,020 18,771
% Female 73.1 61.0
Learners per Teachers Ratio 27.3:1 29.5:1
School Enrolment Rates among 7-15 Year Olds (%)
Girls 93.6 84.0
Boys 93 80.0
Educational Attainment (%) of Population Aged >15 Khomas Namibia
years who Left School with: Region Overall
Incomplete Primary Education 17.6 33.5
Primary Education 41.7 41.5
Secondary Education 26.3 15.5
Tertiary Education (Technical/University/Teacher 14.4 5.6
Training)
Not stated 3.4 3.9
Survival Rate to Grade 7 (end of primary)
Boys & Girls 80
Boys 98.6 76
Girls 100.0 83
Literacy Rate among Individuals >15 yrs (%) 95.8 81
Disability
Disabled Population (%) 3.7 4.7
Labour Force & Economic Conditions
Labour Force Participation Rate (%) for the Population Aged
15yrs+
Males 76.8 62.0
Females 60.8 47.4
Total 68.7 54.0
Economically Active Population Aged 15yrs+ by Activity
Status (Unemployed) and Sex (%), using the broad Khomas Namibia
definition Region Overall
Unemployed Males 23.7 28.3
Unemployed Females 31.9 39.0
Total Unemployed 27.6 33.8
%age Distribution of Households by Main Sources of
Income (%)
Farming 0.8 29.3
Business (non-farming) 6.6 6.1
KRDP 2015 – Chapter 1: Introduction 13Indicator Khomas Namibia
Region Overall
Wages & Salaries 83.3 48.4
Pension 3.2 9.4
Cash Remittance 3.9 4.7
Other 0.9 1.4
Not Stated 0.7 0.7
Fertility & Mortality
Average No. of Children/Woman (Fertility Rate) 3.3 4.1
Infant Mortality Rates (deaths per 1000 live births)
Females 40 51
Males 41 54
Average 40 51
< 5 Year Old Mortality (deaths per 1000 )
Females 52 64
Males 51 78
Average 51.5 71
Life Expectancy at Birth (Years)
Females 56.2 50
Males 54.1 48
HIV/AIDS Prevalence in Pregnant Women 15 – 49 yrs ( %) 27 21.3
Nutritional Status of Children < 5 Years Old
Under-weight (%) 19 24
Orphans
%age Children Orphaned by:
Both Parents 1 1
Mother 3 4
Father 6 9
%age Households with at Least One Child Orphaned by:
One Parent 13.2 23.9
Both Parents 1.5 3.3
Poverty Indicators
HPI (2000) It is a measure of deprivation, meaning the
proportion of households deprived of certain elements of
human life considered to be pre-requisites for human 17.9 24.7
development. Consider longevity, knowledge and decent
standard of living
The Poverty Rate (2003/4) (% of people living on < US $
34.9
1.00 per day.
HDI Takes the view that life expectancy at birth is a good
0.73 0.60
indicator of longevity, while longevity considered that life is
KRDP 2015 – Chapter 1: Introduction 14Indicator Khomas Namibia
Region Overall
valuable in itself and that life expectancy is directly related to
aspects of human development such as adequate nutrition,
and health
Consumption/Income Poverty
% of Households Extremely Poor (80-100% of income spent
1.1 8.7
on food)
% of Households Poor (60-79% of income spent on food) 7.6 29.1
Access to services
Area per Fixed Health Facility (sq km)5 3,084 3,131
5
No. of Public Hospitals 2 34
5
No. of Public Health Centres 2 37
No. of Public Health Clinics 5 9 244
5
Population (%) with Access to Health Service within 10 km 90.0 80.0
5
Population/Registered Nurse 321 947
5
Population/Public Doctor 3,129 7,545
5
Population/Public Health Facility 20,938 6,000
Total Recurrent Health Expenditure per Person N$111 N$3,453
Population/Social Worker 12,036 49,622
%age of Households Living within 500m to a Safe Water 97.9 81.6
Source3
%age of Households having Access to Safe Water5 93.0 77.0
5
%age of Households having Access to Adequate Sanitation 81.0 41.0
%age of Households without Toilet 20.2 54.2
1.2. Governance and Planning Structures
The legal basis for the local government system in Namibia is laid in the country’s Constitution
of 1990. Guided by the Articles of Chapter 12 of the Constitution, the parliament of Namibia
enacted two important legislations: the Regional Councils Act No. 22 of 1992 and the Local
Authorities Act of 1992, which provide for the establishment, powers, duties, functions and other
related matters of the regional councils and local authority councils. Both of these Acts have
been amended several times. The latest amendment to the Local Authorities Act is the Local
Authorities Amendment of 2003.
The main legislative texts dealing with local government are:
Local Authorities Act 1992
Regional Councils Act 1992
KRDP 2015 – Chapter 1: Introduction 15Other important pieces of legislation, designed in part to speed up the decentralisation process, include: Decentralisation Enabling Act 2000 Trust Fund for Regional Development and Equity Provisions Act 2000 The Regional Councils Amendment Act 2000 The Local Authorities Amendment Act 2000 The Republic of Namibia is a unitary state. Administratively, it is divided into three tiers, with separate spheres of responsibility – central, regional and local. The central government consists of the President and the two Houses of Parliament: the National Assembly and the National Council. The regional sphere is made up of Regional Councils. Each of the regional councils runs one region, which are fourteen in total: Zambezi, Erongo, Hardap, Karas, Khomas, Kunene, Ohangwena, Kavango East, Kavango West, Omaheke, Omusati, Oshana, Oshikoto and Otjozondjupa. Regional Councils have powers under the Regional Councils Act of 1992, which established a regional council in each region. They can, among other things, advise the President and central government on matters relating to the region. The political head of a region is the governor, who is appointed by the President. The regions are divided into constituencies for electoral purposes. Each constituency elects one member to the regional council. The term of office of the regional council members is five years. The regional councils elect from amongst their members three persons as members of the National Council. The local authorities are established in urban areas, and the regions cover the rural areas. The regional councils are presently responsible for specified service delivery in rural areas, while the local authorities are responsible for service delivery in urban areas. There are four types of local government: 1) Municipal Councils (of two types) 2) Town Councils 3) Village Councils There is no upper or lower tier in Namibian local government. The 14 Regional Councils run the regions. Municipal, Town and Village Councils are not sub-ordinate to them. KRDP 2015 – Chapter 1: Introduction 16
Table 2: Governance Structure
CENTRAL GOVERMENT
President
Government: President, Vice-President, Prime Minister, other Ministers
Parliament:
- National Assembly
- National Council
REGIONAL GOVERMENT
14 x Regions
- Regional Governor
- Region Council
PART 1 PART 2 TOWN VILLAGE
MUNICIPALITY MUNICIPALITY - Town council - Village council
- Municipal council - Municipal council
Only chief executive officers are required by law. These are referred to as Chief Regional
Officers in the Regional Councils, town clerks in the Town Councils and village secretaries in
the villages.
1.3. High Level Statements of the Khomas Regional Council
Mandate
Our Mandate is:
Governing, planning, coordinating and implementing socio-economic development activities;
Ensuring environmental protection and sustainable natural resource utilization;
Making recommendations to Minister of Finance in relation to preparation of estimates of
expenditure; and
Advising and/or making suggestions on GRN legislation and policy.
The mandate for the Khomas Regional Council is derived from the following national legal and
planning tools, among others:
The Namibian Constitution, Chapter 12, Article 103 Section 28, and
The Regional Councils Act 22 of 1992.
Vision
Our vision is for a “Well developed, United and Prosperous Region”.
KRDP 2015 – Chapter 1: Introduction 17The Khomas Regional Council’s vision is meant to resonate with all members of the Regional
Council by making them feel proud and excited, while giving shape and direction to the future of
Khomas region.
Mission
To “To provide an effective and efficient service delivery, in order to improve living standards
of our people, by accelerating regional socio-economic development through inter-sectoral
collaboration and community participation”.
The mission of the Khomas Regional Council was developed with the intent to precisely describe
what the Regional Council does as prescribed by its formal mandate. The mission statement
embeds the regions desire to ensure that all its members verbally express its mission easily.
Core values
Accountability: Being responsible and answerable for every action we take.
Integrity: Discharging our mandate with honesty, dignity and honor, in an
uncompromising manner.
Transparency: Discharging our duties and responsibilities in an open, fair and predictable
manner.
Professionalism: Strict and non-partisan adherence to our core values and responsibilities,
embracing partnership with all stakeholders.
Responsiveness: Being proactive in addressing the needs and expectations of our people in
relation to our mandate.
1.4. Methodology
The compilation of this profile used both secondary and primary sources of information. A Desk
Review of all latest available data/information related to the region will be conducted by the IC.
Such data can be obtained from, but not limited to, the following sources:
• Namibian Constitution.
• Regional Council Act (Act 22 of 1992) as amended.
• Local Authorities Act (Act 23 of 1992) as amended.
• Decentralization Policy.
• Decentralization Enabling Act of 2000.
• Regional Development Plans 2006.
• NHIES Reports.
• Namibia Labour Force Surveys Reports.
• Namibia Population & Housing Census Reports.
• Regional Poverty Profiles 2006.
• NDPs.
• Food Security and Nutrition Action Plan 2006-2015.
• Delimitation Commission.
KRDP 2015 – Chapter 1: Introduction 18• Rural Development Policy and Strategy.
• Data from O/M/As and may use any other relevant documents from accredited source of
information.
Primary data can be obtained from the residences of the region, especially those experts working
in various fields of specialization or senior citizens with unrecorded knowledge and experiences
about the region through group discussions or face to face interviews with selected identities.
A Profile may contains both quantitative and qualitative information. A multidisciplinary
approach is recommended for writing a profile, even if one person takes the lead in writing the
profile. This approach allows people with a variety of skills and experiences to contribute to the
document. A team should include expert from OMAs/Regional Council, Local Authority, NGO
and International and Local Development Partners.
Objective
The principal aim of a Regional Development Profile is to provide relevant and efficient
information to policy makers, planners, stakeholders, institutions and the community at large to
enable them to understand detailed findings of the socio-economic, demographic, households
and development characteristics of the Khomas region.
KRDP 2015 – Chapter 1: Introduction 19CHAPTER 2: KEY
STATISTICS
2.1. Demographics
The demographics of a population are referred to a selected population with distinctiveness such
as gender, age and population group. Demographic information is important as they inform key
policy decisions, ensure proper and informed planning and allocation of resources. This section
outlines the population size, age composition and the (population groups) distribution of the
Khomas Region.
2.1.1 Population size
The Khomas region population size has increased from 250,262 in 2001 to 342,141 in 2011
which is over 16 % of the total population compared to 12 % 20 years ago. Hence the annual
growth rate is at 3.1 %. This is according to the Census results.
Table3 below shows the male and female population size of 2001 and 2011 respectively as per
the Namibia Statistics Agency Census Results of 2011.
Table 3: Khomas Region Population size in 2001 and 2011 respectively.
Khomas Population Size in Thousands
200000
180000
160000
140000
120000
No. of people
100000
80000
60000
40000
20000
0
Male Female
Population size (Census 2001) 126648 123613
Population size (Census 2011) 169672 172469
Source: Namibia Statistics Agency Census Report 2011
KRDP 2015 – Chapter 2: Key Statistics 202.1.2 Population size per constituency
Table 4: below indicates the size of the population as per each constituency. Windhoek West
Constituency is leading the population in size by 53,438 people followed by Samora Machel
Constituency with 50,110 people and Tobias Hainyeko Constituency follows in third place with
45,912 people. The fourth one is Moses //Garoëb with 45,564 people. Katutura East and John
Pandeni constituencies have the least population size of 18,501 and 15,121, respectively, both
less than 20,000 residents.
Table 4: Khomas Region population size per constituency
Khomas Population size per constituency
60000
50000 53438
50110
40000 45912 43921 45564
30000
20000 24608 22712 22254
18501
10000 15121
0
Source: NSA - 2011 Population and Housing Census Regional Profile, Khomas Region
2.1.3. Age composition
The table below presents information on the composition of the population in terms of ages,
which are important demographic parameters which provide illustrations of the demographic
characteristics of the population.
Table 5: The age composition of the Khomas region population as illustrated below by broad
age groups. Khomas region has a high youthful population of 67 and 69 % between the age
group of 15-59 years both in the year 2001 and 2011 and has a relatively small proportion of 4 %
of elderly people aged 60 years and older in the year 2001 and 2011. This indeed reflects that the
fertility and mortality rate is high.
KRDP 2015 – Chapter 2: Key Statistics 21Table 5: Age composition in Khomas Region for 2001 and 2011
Khomas Age Composition
80
70
60
Percentage
50
40 Age composition in
(2001)
30
Age composition
20 (2011)
10
0
Under 5 yrs 5-14 yrs 15-59 yrs 60+ yrs
Age groups
Source: Namibia Statistics Agency Census report 2011
2.1.4. Population groups
As is evident in Table 6 below, increases in the Khomas region’s population numbers is noted
highly amongst the Oshiwambo speaking people between 2001 and 2011 from 37 % to 41%.The
Afrikaans and Nama/Damara population group’s declined respectively from 24 % to 19 % and a
slight decrease from 13 % to 12 %. The Otjiherero population group, although relatively small in
actual size, had slightly increased from 9 % to 10 %.
KRDP 2015 – Chapter 2: Key Statistics 22Table 6: Khomas Population groups by tribe in 2001 and 2011
45
40
35
30
Language at
25 home(2001)
20 Language at
home(2011)
15
10
5
0
Oshiwambo Afrikaans Nama/Damara Otjiherero
Source: Namibia Statistics Agency Census report 2011
2.1.5. Unemployment rate
The unemployment rate is the ratio of the unemployed population in the work force for a specific
population group (for example the number of unemployed people in the labor force, divided by
the population of the labor force in the same population group). Hence the unemployment rate is
clearly understood when discussed in relation to economically active. Economically active
population are those people in the labor force aged between15 and 65 years who chose to
participate in the labor market, by demonstrating a willingness to provide their labor in exchange
for an income. Hence being defined as economically active does not depend on being employed;
as long as there is a desire, willingness and availability to work, even if that desire does not
translate into employment, you are regarded as part of the labor force.
With that understanding, the Khomas region according to the 2011 Population and Housing
Census Regional Profile, Khomas Region is said to have an economically active labor force of
181 334 person, which is about 73.6 %.
Thus, amongst the economically active population 54 368 which is 30 % of the population group
are unemployed and 126 966 (70 %) of the economically active group are employed in various
sectors. The chart below illustrates the figures of man and women who are employed and those
who are not employed.
KRDP 2015 – Chapter 2: Key Statistics 23Chart 1: Khomas Economically Active Group
80
60
40
20 Economically
active group
0
Employed men
Employed women
Unemployed men
Unemployed
women
Source: Namibia Statistics Agency Census report 2011
2.1.6 Average life expectancy
According to the Khomas Regional Poverty Profile of 2005 and 2006, the regions life
expectancy at birth amongst females was 56.2 and 54.1 for males respectively.
2.1.7 Poverty prevalence in Khomas Region
The poverty rate in Khomas was 27% in 2003/2004 and decreased to only 11% in 2009/2010.
Khomas Region is home to Windhoek, the commercial hub and capital of the country. The
region has a population of 342,141 accounting for about 16.2 % of the total population.
The region is predominantly urban. The region is a net recipient of migrants from other parts of
the country due to its strong economic pull and push factors (poverty and unemployment) in
some rural parts of the country. The reduction in the incidence of poverty with four out of the
ten constituencies having registered increases while six constituencies registered declines in the
poverty headcount rate over the 2001 – 2011 period.
Windhoek Rural and Katutura Central registered the largest declines in poverty incidence, with
poverty incidence of five % (15 738 people).
KRDP 2015 – Chapter 2: Key Statistics 24There exist wide variations between the ten constituencies of the region with those characterized
by informal settlements recording higher levels of poverty.
The relatively high incidence of poverty in Tobias Hainyeko and Moses //Garoëb constituencies
can be attributed to rapid population growth due to an inflow of migrants. While the region had a
population growth of 3 % per annum over the 2001 – 2011 period, Moses //Garoëb, Samora
Machel and Khomasdal constituencies had population growth rates of 5 % or more per annum. It
is noteworthy to mention that most of the migrants into these constituencies lack the necessary
skills and education to be easily absorbed in the job market, leading to high rates of
unemployment in these constituencies.
An estimated 74 % of the population age 15 years and above are economically active, with
unemployment estimated at 21 %. Unemployment is highest in Moses Garoëb at 30 % of the
labour force, followed by Tobias Hainyeko (29 %), Katutura Central (28 %), Katutura East (28
%) and Samora Machel (28 %).
The incidence of severe poor is estimated at an extremely low 1.6 per cent, indicating that in this
urban setting even most of the unemployed are able to avoid poverty and particularly severe
poverty. Severe poverty is found in Tobias Hainyeko, Moses //Garoëb and Windhoek Rural. It
has actually increased in both Tobias Hainyeko and Moses //Garoëb by two and three %age
points while it has declined in Windhoek Rural by about 1.6 percentage points.
Table 7: Percentage of extreme poor household
The table below illustrates that a rate of 1.1 from the 80-100 % of the extremely poor household
in the Khomas Region spent their income of food in comparison with the 60-79 percentage of
poor households that spent a rate of 7.6% of their income on food.
Khomas Rest of Namibia
% of Households Extremely Poor (80-100% of income spent on food) 1.1 8.7
% of Households Poor (60-79% of income spent on food) 7.6 29.1
Source: 2011 Population and Housing Census Regional Profile, Khomas Region
2.2 Households with access to:
Percentage of Households with access to safe/clean water
The table below indicates that 98.8 % of the households in Khomas Region had access to safe
drinking and cooking water. The table further illustrates that close to 99.3 % of the households in
urban areas had access to safe water. Whilst 7.6 % of households in rural areas have unsafe water
as they drink water from boreholes with open tanks and unprotected wells as their main source of
water for cooking/drinking.
KRDP 2015 – Chapter 2: Key Statistics 25Table 8: Illustrates the %age of the population by main source of water for cooking and drinking
in the Khomas Region.
Source of water for drinking and cooking Safe water %
Piped water inside 48.2
Piped water outside 19.0
Public pipe 29.5
Borehole with tank covered 2.0
Well protected 0.2
Borehole with open tank 0.5
Other unprotected sources 0.3
Others 0.9
Source: 2011 Population and Housing Census Regional Profile, Khomas Region
Numbers of Households with access to Health Facilities
The table below illustrates that 3084 people in Khomas region have access to health facilities in
an area per fixed health facility (sq km). The region has two public hospitals and two public
health centres, and a total population of 321 per registered nurses and 3129 population per public
doctor.
Table 9: Numbers of Households with access to Health Facilities
Access to services Khomas Namibia
Area per Fixed Health Facility (sq km) 3,084 3,131
No. of Public Hospitals 2 34
No. of Public Health Centres 2 37
No. of Public Health Clinics 9 244
Population (%) with Access to Health Service within 10 km 90.0 80.0
Population/Registered Nurse 321 947
Population/Public Doctor 3,129 7,545
Population/Public Health Facility 20,938 6,000
Total Recurrent Health Expenditure per Person N$111 N$3,453
Source: 2011 Population and Housing Census Regional Profile, Khomas Region
Percentage of Households with access to sanitation
Chart 2 Shows that a sum of 73.9 % of the households had access to a private/shared/connected
flush toilet, while 19.9 % of households had no toilet facilities at all. And the remaining %age of
KRDP 2015 – Chapter 2: Key Statistics 26the population used pit latrines whether covered/ uncovered or ventilated and unventilated. The
chart below illustrates the total %age of the population by source of toilet facility in the Khomas
Region.
Chart 2: Percentage of Households with access to sanitation
Source: 2011 Population and Housing Census Regional Profile, Khomas Region
KRDP 2015 – Chapter 2: Key Statistics 27CHAPTER 3: REGIONAL
DEVELOPMENT AREAS
3.1. Economic Sector
Agriculture
There is a strong interaction between the farming community in the hinterland of Windhoek and
the city. Not only are most of the farming products marketed in or through Windhoek but it is
also the most important farming supply centre. The southern border of the Khomas region
includes the northern part of former Rehoboth Gebiet. It comprises an area which is also
predominantly cattle-producing with similar agro-economic interests to the rest of the region. It
is a properly proclaimed farming area. To a large extent, the border line forms a natural division
between the predominantly cattle producing central part of Namibia and the predominantly
small stock farming area of southern Namibia.
Tourism and Wildlife (Facilities)
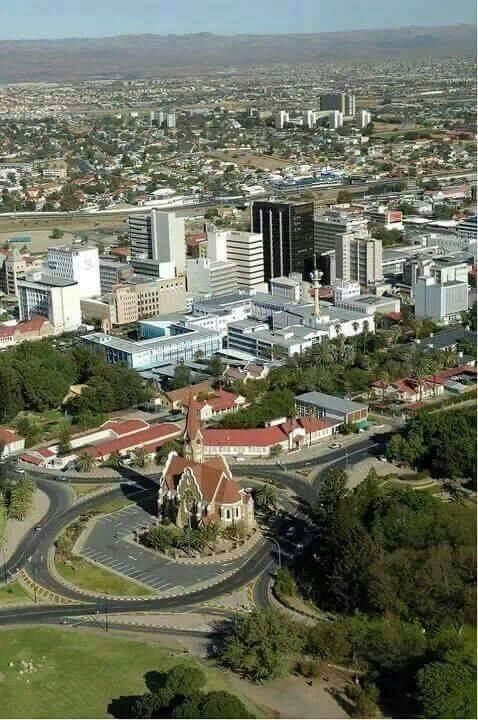
National Museum of Namibia Christuskirche National botanic garden
Popular Windhoek Attractions
NamibRand Nature Reserve
Karibu Safari
Katutura Township
Christuskirche
KRDP 2015 – Chapter 3: Regional Development Areas 28 Okapuka Ranch
Daan Viljoen Nature Reserve
Heroes Acre
Owela Museum
Cuno Hoffmeister Memorial Observatory
National Museum of Namibia
National Botanic Garden of Namibia
Pure & Simple Art Gallery
Kalahari Sands Hotel & Casino
Hotel Thule
Amani Lodge
Maison Ambre Guesthouse
Guesthouse Terra Africa
ROOISAND Desert Ranch
Chameleon Backpackers Hostel
De Vagebond Bed & Breakfast
Protea Hotel Thuringerhof
Vondelhof Guesthouse
Uzuri Guesthouse CC
Puccini House
Hartmann Suites
The Village Courtyard Suites
Vineyard Country Bed & Breakfast
Trade and Industrial Development
The population of Khomas is huge for its area, and its unemployment rate is relatively high. In
recent years, there has been an increasing number of local entrepreneurs starting medium and
small businesses and that helps revitalize the local economy in the region. As there are a lot of
SMEs that devote their managerial efforts to improving technical skills, enhancing managerial
capacity and meeting the needs of local communities with only limited management resources.
The strengths which many of those SMEs have ranges from making an effective use of unique
regional resources: endemic animals and plants, minerals, etc. producing goods using traditional
art and craft skills and producing unique products making use of original skills and designs. In
addition, there are some SMEs that have successfully capitalized on their strengths to overcome
their business challenges and become good-standing companies with the support from the
government, international organizations, private sectors and NGOs.
KRDP 2015 – Chapter 3: Regional Development Areas 29 Mining
Explorations in the central part have found Volcanogenic Massive Sulphide (VMS). The Kleine
Kuppe Formation sandstones contain SEDEX-type of deposits, while the Kamtsas Formation in
the south of the region holds copper-type minerals. However, mining in the region is not
particularly economically significant, with only the mine at Otjihase for copper, lead and zinc,
being operational at this present time.
3.2. Social Sector
Housing
The housing situation is quite a big challenge in Khomas region. The region hosts Windhoek
which is the Capital City of Namibia. With so many opportunities available in the capital city, in
terms of employment opportunities, best schools and institutions of higher learning, it prompted
citizens from other regions and neighbouring countries to come settle in Khomas Region.
According to the 2011 Population and Housing Census, Khomas Region has a population of 342
141, which makes it one of the region with the highest population in the country. With the higher
influx in the region this led to higher demand for housing surpassing the level of supply Houses
in the region.
(a) Housing Challenges
• Lack of affordable houses.
• Insufficient Serviced land.
• High population growth in Khomas.
• Rapid increase of informal settlements.
Current strategies on Housing:
• Servicing of land through GRN Programmes like TIPEEG.
• Construction of houses through Mass Housing Programme.
• With City of Windhoek – Land delivery and Servicing.
KRDP 2015 – Chapter 3: Regional Development Areas 30(b) Type of Housing
According to the 2011 Population and Housing Census, Khomas region is characterized by all
types of housing, including all structures used as dwelling units. The Census further specified
nine types of housing units found in the Khomas region: detached house; semi-
detached/townhouse; apartment/ flat; guest flat; part commercial/industrial; mobile home
(caravan, tent); single quarters; traditional dwelling and improvised housing unit (shack).
The diagram below indicates that detached houses were the most common types of dwelling
units, accounting for 42.9 % of households in the Khomas region. The diagram also shows that
31.2 % of the households in urban areas lived in improvised housing units/shacks.
Chart 3: Housing Type
Housing type
1%
Detached house
31% Semi-detached house
44% Apartment/Flat
Guest Flat
Traditional Dwelling
0% Improvised Housing Unit( Shack)
2%
Other Housing Unit
9%
13%
Source: Namibia Statistic Agency Census 2011
(c) Type of Tenure
Tenure refers to the conditions which govern the rights of individuals to occupy dwelling units.
The most common form is renting, in which a tenant pays rents paid to a landlord and owner
occupancy which can be subdivided into owner-occupier or mortgaged. In the case of tenancy,
the landlord may be a private individual, non-profit organization such as a housing association,
or a government body that provides public housing.
KRDP 2015 – Chapter 3: Regional Development Areas 31The diagram below shows that most housing units (33.2%) in the region were owned and
occupied by households without a mortgage.
Chart 4: Type of Tenure
Type of Tenure
Owner Occupied With Mortgage
Owner Occupied Without
Mortgage
Rented (Government)
Rented (Local Authority
Rented (Parastatal)
Rented (Private Firm)
Rented (Individual)
Occupied Rent Free
Others
Source: Namibia Statistic Agency Census 2011
(d) Average number of people per room
The Census collected information on the number of sleeping rooms per household. The average
number of persons per sleeping room (or room occupancy) can be used as an indicator of
crowding. This shows that on average, the number of persons per sleeping room in Khomas was
1.6. This suggests that most households are not overcrowded.
KRDP 2015 – Chapter 3: Regional Development Areas 32Table 10: Average number of people per room
Average number of persons Number of sleeping rooms Average persons per
per sleeping room by area sleeping room
207,458 1.6
(e) Materials used for construction
This section presents information on the materials used to construct roofs, walls and floors.
These are important indicators of the socio-economic conditions and welfare of households.
Most of the materials used can be broadly divided between those that are harvested with labour
from local resources (grass, stick, mud and dung, etc.) and those that are purchased with cash
(cement bricks or blocks and corrugated iron).
Table 7.4 shows that 57.9 % of the households resided in dwellings with walls made from
cement/bricks. About 60.8 % of urban households used cement/bricks for outer walls, compared
to 57.7 % of rural households. Corrugated iron/zinc was the second most commonly used
construction material in both urban (38.7%) and rural areas (29.8%). At a constituency level,
households with walls constructed from corrugated iron/zinc were predominantly found in
Moses ////Garoëb (78.7%), Tobias Hainyeko (78%) and Samora Machel (58.2%).
Table 11: Materials used for construction
% Cement Burnt Mud/ Corrugated Prefabricated Wood Sticks Tin Other
distribution Blocks/ Bricks/ Day Iron/Zinc Materials Poles/Sticks with
of Brick Face Bricks or Mud/
households Bricks Grass/Reeds Cow
by main dung
material
used for
outer walls 57.9 0.4 0.2 38.3 1.2 0.3 0.7 0.7 0.9
by area
KRDP 2015 – Chapter 3: Regional Development Areas 33You can also read