Southeast Alaska 2025 Economic Plan - DRAFT - Southeast Conference's Comprehensive Economic Development Strategy 2021-2025 - April 2021
←
→
Page content transcription
If your browser does not render page correctly, please read the page content below

Southeast Alaska 2025
          Economic Plan
       Southeast Conference’s Comprehensive
          Economic Development Strategy
                    2021-2025

     SOUTHEAST
     CONFERENCE

                                        April 2021
                                         DRAFT
                                                              Prepared by
                                                              Rain Coast Data
Southeast Alaska by the Numbers, 2017                Prepared by Rain Coast Data   Page 1
Southeast 2025 Strategic Plan Introduction

  Southeast Conference is a designated Economic               Summary Background of economic conditions in
  Development District (EDD) through the US                      the region pages 4-16;
  Economic Development Administration (EDA). As               Economic Resilience map detailing how Southeast
  the region’s EDD, Southeast Conference is                      Alaska businesses are responding to the
  responsible for developing a Comprehensive                     COVID-19 economic crisis page 19-20;
  Economic Development Strategy (CEDS) for
  Southeast Alaska that is designed to identify               Strategic Direction Action Plan incorporating
  regional priorities for economic and community                  tactics identified through planning process, other
  development. The CEDS is a strategy-driven plan                 plans, and stakeholder feedback to develop the
  developed by a diverse workgroup of local                       priority strategies for the region pages 21-39;
  representatives from private, public, and nonprofit         Strategic Direction Action Plan Part II Priority
  sectors. The following sections form the basis for the          Objective Descriptions and Evaluation
  Southeast Conference CEDS:                                      Framework to identify and monitor performance
                                                                  measures associated with the plan pages 40-46;
  One page Strategic Plan Summary page 2;
                                                              Economic Plan Steering Committee roster of
  SWOT Analysis to identify regional Strengths,                  names page 46 to 49;
    Weaknesses, Opportunities, and Threats
                                                              Appendices page 50.
    page 3;

  The CEDS process began in February 2020 to ensure maximum input from the Southeast Conference
  membership. This process engaged community leaders, leveraged the involvement of the private sector, and
  developed a strategic blueprint for regional collaboration. More than 400 people representing small
  businesses, Alaska Native organizations, municipalities, tribes, and nonprofits were involved in various
  elements of the planning process. The following timeline shows meetings that took place in developing the
  five year plan. The plan was originally released in April 2021.

    Southeast Alaska Comprehensive Economic Development Strategy Meeting Schedule
                             36 Meetings, 400 Stakeholders

                   Transportation Energy Timber     Seafood    Health Care Tourism     Mining    Other CEDS

    Winter 2020

    Spring 2020

   Summer 2020

Fall/Winter 2020

    Spring 2021

Southeast Alaska 2025 Economic Plan: Released April 2021                  Prepared by Rain Coast Data   Page 1
SOUTHEAST 2025 STRATEGIC PLAN SUMMARY
 In April 2021, Southeast Conference released the Southeast Alaska 2025 Economic Plan, a five-year strategic plan for the region. The
 membership worked together to develop an overall vision statement, more than 50 objectives, and 4 priority objectives, along with regional
 and industry specific SWOT analyses. More than 400 people representing small businesses, tribes, Native organizations, municipalities, and
 nonprofits were involved in various elements of the planning process. The Plan’s prioritized objectives are listed below.

  TRANSPORTATION                                                        TIMBER INDUSTRY
  1. Priority Sustain and support the Alaska                            1. Provide an economically viable and
        Marine Highway System                                                 dependable supply of timber from the
  2. Develop a long-term, strategic, multi-                                   Tongass National Forest to regional
        modal, regional transportation plan                                   timber operators
  3. Ensure the stability of regional passenger                         2. Revise the Tongass National Forest Land
        transportation services                                               Management Plan
  4. Move freight to and from markets more efficiently                  3. Support an integrated timber industry that includes
  5. Ports and harbors infrastructure improvements                            harvest of young growth and old growth
  6. Road Development                                                   4. Community-based timber workforce development
                                                                        5. Work with USFS to direct federal contracts and timber
  SEAFOOD & MARITIME                                                          sale opportunities toward eligible locally owned
  Seafood                                                                     businesses

                                                                        MINING INDUSTRY
  1. Priority Mariculture development
  2. Work to promote a year-round seafood
        economy                                                         1. Proactively support mining operations and mineral
  3. Further develop seafood markets                                           exploration projects
  4. Maintain a stable regulatory regime                                2. Support efforts to increase access to minerals and
  5. Research the effects of changing ocean                                    energy sources for mining on state and federal
        conditions on the marine environment                                   lands
  6. Support regional processors becoming economically                  3. Mining and exploration workforce development
        competitive                                                     4. Preserve access to reliable, year-round transportation
  7. Communicate the importance of salmon hatcheries                           for miners living in rural Southeast Alaska
  8. Seafood sector workforce development                               5. Attract mining capital
  9. Full resource utilization & ocean product development
  Maritime                                                              HEALTH CARE
  1. Increase employment & training opportunities for                   1. Plan for a post COVID-19 health care
        Southeast Alaska residents in the Marine Industrial                   system
        Support Sector                                                  2. Retain Alaska-trained health care
  2. Increase energy efficiency & reduce energy costs                         students
  3. Expand marine industrial support capacity                          3. Meet the health care needs of an aging population
                                                                        4. Increase health care training within the region and
  VISITOR INDUSTRY                                                            state

                                                                        OTHER OBJECTIVES
  1. Priority Market Southeast Alaska to attract more visitor
        spending and visitor opportunities
  2. Grow cultural and arts tourism opportunities                       1. Child Care: Increase child care capacity
  3. Increase access to public lands and                                2. Housing: Support the sustainable development of
        expand trail network                                                  housing
  4. Increase yacht and small cruise ship                               3. Communications: Improve communications access
        visitation                                                      4. Education Objective: Partner with University of
  5. Educate public on the economic value                                     Alaska Southeast and K-12 school districts to build
        of tourism                                                            career pathways and meet employer needs for a
                                                                              skilled workforce
  ENERGY SECTOR                                                         5. Natural Disaster Planning: Support disaster
  1. Priority Promote beneficial electrification                              preparation and relief efforts
  2. Continue to support rural Southeast communities with               6. Solid Waste: Support regional solid waste
        high-cost electric rates without access to lower cost                 management solutions
        hydroelectricity                                                7. Food Security: Increase supply, demand and
  3. Work with communities to create energy systems that                      equitable access and distribution of local foods and
        provide sustainable, affordable, renewable thermal                    regional food system opportunities
        energy                                                          8. Arts: Increase the recognition of Southeast Alaska’s
  4. Implement regional energy plan with a focus on                           thriving Northwest Coast arts economy
        "committed units" and deployment of renewables                  9. Cultural Wellness: Support the development of
  5. Energy workforce development                                             activities and infrastructure that promotes cultural
                                                                              wellness and multicultural wellness

Southeast Alaska 2025 Economic Plan: April 2021                                          Prepared by Rain Coast Data        Page 2
Strengths Weaknesses
       Southeast Alaska’s                                     Opportunities Threats

                        STRENGTHS
                                                                       2025 ECONOMIC PLAN DEVELOPMENT
   Beauty and recreation opportunities                     50%
                                                                      More than 400 regional leaders participated in
                          Tourism sector                 41%          the overall or sector specific strengths,
                                                                      weaknesses, opportunities, and threats analysis
                       Seafood industry                  38%          and prioritization.
Rich Alaska Native culture and heritage                 37%           Seafood
   People and Southeast Alaskan spirit                  36%           • Top Strength: High quality product
                                                                      • Top Weakness: Changing ocean conditions
      Great place to raise kids/families                34%           • Top Opportunity: Increase value added
                                                                        processing
                                                  25%   50%           • Top Threat: Ocean change or warming

                     WEAKNESSES                                       Health Care
                                                                      • Top Strength: Personalized care delivery
         Ferry transportation decline                      59%        • Top Weakness: State budget cuts reduce
                                                                        workforce development options
    Cost of living and doing business                   42%
                                                                      • Top Opportunity: Development of health care
                  Transportation costs                 34%              courses at the university
                                                                      • Top Threat: Increasing costs
  Housing: Not enough/too expensive                   32%
        Aging or lack of infrastructure              26%              Visitor Industry
                                                                      • Top Strength: Natural beauty of region
   Dependence on State oil economy                  22%               • Top Weakness: Community communications
                                                                      • Top Opportunity: Collaborate with Alaska
                                                   30%        60%
                                                                        Native entities on cultural tourism

                 OPPORTUNITIES                                        • Top Threat: Viral outbreak
                                                                      Mining
                                                                      • Top Strength: Provides high paying jobs
          Strengthen ferry connectivity                   50%         • Top Weakness: Extreme opposition by
              Mariculture development                   43%             environmental groups
                                                                      • Top Opportunity: Explore and develop new
        Seafood product development                   31%               mineral deposits and expand existing mines
         Cultural tourism development                28%              • Top Threat: Lawsuits

                      Renewable energy              23%               Timber
                                                                      • Top Strength: High quality wood
                  Improve infrastructure            22%               • Top Weakness: Frequency of litigation
                                                                      • Top Opportunity: Increased state and private
                                             0%     30%       60%       lands
                            THREATS                                   • Top Threat: Environmental litigation
         Reduction/loss of ferry service                       54%    Transportation
                                                                      • Top Strength: Strong reliable airline services
                        Fisheries decline                34%          • Top Weakness: AMHS service reductions
       Poor leadership/decision making                   34%          • Top Opportunity: Improve ferry service
                                                                      • Top Threat: Demise of AMHS
                            Cost of living              33%           Energy
       Climate change/global warming                    29%           • Top Strength: Abundant hydropower
                                                                      • Top Weakness: High costs of infrastructure
             Capital move/capital creep                 28%           • Top Opportunity: New hydro development
                                                                      • Top Threat: Economic downturn
                                             0%     30%       60%

 Southeast Alaska 2025 Economic Plan: Released April 2021            Prepared by Rain Coast Data        Page 3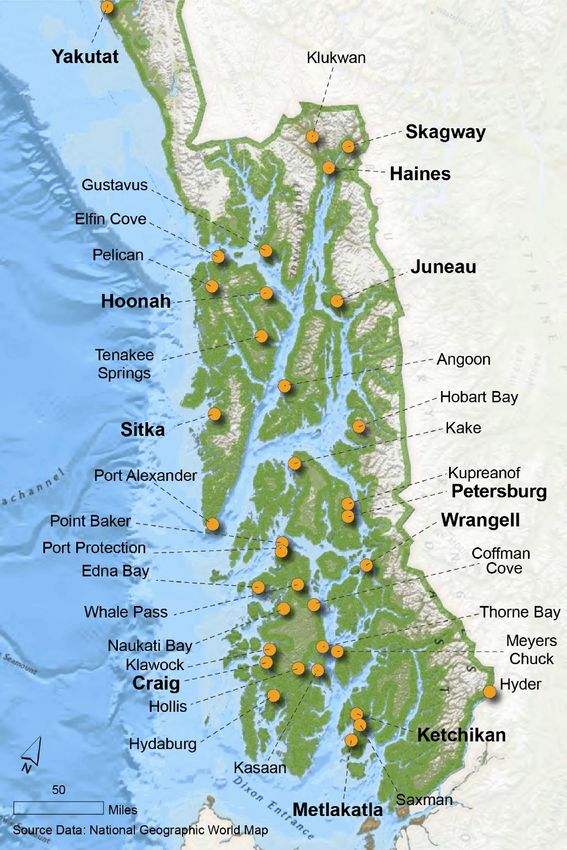
S     O      U      T        H          E           A           S   T         C      O      N      F      E      R     E      N      C      E

             SOUTHEAST ALASKA
                                                                   Summary Background

The Summary Background is updated every September and released at the Southeast Conference Annual Meeting as Southeast Alaska by the Numbers.

 CHANGES 2018 TO 2019                                          SOUTHEAST ALASKA’S ECONOMY
                                                                                     The Southeast Alaska                             On March 13th 2020,
                                                                                     summer of 2019 was                               schools across Alaska
                 REGIONAL POPULATION                                                 filled with record-high                          closed until further
                 DECREASED BY 284                            temperatures and a historic number of visitors notice, a clear signal that the COVID-19
                 PEOPLE TO 72,373                            coming to Southeast Alaska.                     epidemic had arrived in Southeast. The virus
                                                              In many ways 2019 should have marked the       would soon take the regional economy down
                                                             region’s return to a more prosperous and        with it. Canada’s prohibition of cruise ships
                 LABOR FORCE INCREASED                       growing economy. Total jobs were up, along ended the regional tourism season before it
                 BY 455 JOBS TO 46,097                       with overall wages. Tourism, seafood, mining, began in 2020, and was again extended
                 JOBS.                                       and health care jobs were all up, and timber    through the summer of 2021. In the first 11
                 TOTAL WAGES GREW BY                         jobs were up by 10%. Nearly every               months of a pandemic economy, the region
                 $63 MILLION OR 3%                           community in the region posted job gains.       lost more than 6,000 jobs across every sector,
                                                             The number of school children in the region     but tourism was particularly devastated. The
                                                             increased for just the 3rd time in 23 years.    region lost 16% of its jobs due to the
                 CRUISE PASSENGERS                                                                           pandemic. On top of COVID-19, Southeast
                 INCREASED BY 14% TO                         The number of cruise ship passengers that
                                                             visited the region in 2019 increased by 14%     Alaska experienced one of its worst fishing
                 1.33 MILLION                                                                                seasons on record in 2020. Dismal harvest
                                                             over the year before as 1.33 million
                                                             passengers sailed up the inside passage to      levels were compounded by reduced prices,
                 TOTAL GOVERNMENT                            spend their summer dollars across the region’s as the pandemic has limited global seafood
                 PAYROLL INCREASED BY                        larger port communities.                        demand. In addition to the enormous impacts
                 $4 MILLION OR 0.5%                                                                          facing businesses and workers across the
                                                             State government continued to shed jobs in
                                                                                                             region, local government experienced
                                                             2019, but the region had become more
                                                                                                             significant losses. Tourism losses alone cost
                                                             diversified. While the State remains the
                 K-12 ENROLLMENT                                                                             the region $80 million in local tax revenue,
                                                             largest wage provider in the region, the
                 INCREASED FOR THE 3RD                                                                       with communities losing up to 95% of sales
                                                             continued loss of government jobs was being
                 TIME IN 23 YEARS, BY 10                                                                     tax revenue. Federal relief funding replaced
                 STUDENTS                                    offset by increases in other sectors, allowing
                                                                                                             some lost revenue, and there is an eventual
                                                             the overall regional economy to return to a
                                                                                                             light at the end of this crisis. The resources of
                                                             positive trajectory.
                                                                                                             Southeast Alaska remain strong. It still has
                 TIMBER JOBS                                 By March of 2020, the region was still on track beautiful vistas and recreational opportunities,
                 IN THE REGION INCREASED                     to harness the gains of 2019 and continue to healthy timber stands, a productive ocean,
                 BY 10%, A GAIN OF 35                        grow. The region had added 200 jobs in the
                 JOBS                                                                                        valuable minerals, and its most important
                                                             first three months of the year and was gearing resource — the resiliency of Southeast
                                                             up for 1.5 million cruise visitors in 2021.     Alaskans themselves.
  Southeast Alaska 2025 Economic Plan: Released April 2021                                                       Prepared by Rain Coast Data           Page 4
                               Raincoast Data
                               Timber, Food Security, Energy Draft 1
SOUTHEAST ALASKA REGIONAL OVERVIEW
THE REGION
THE FEDERALLY- The Southeast Alaska panhandle extends 500 miles
MANAGED TONGASS along the coast from Metlakatla to Yakutat,
NATIONAL FOREST MAKES encompassing approximately 33,500 square miles of
UP NEARLY 4/5TH OF ALL land and water. The saltwater shoreline of Southeast
SOUTHEAST ALASKA Alaska totals approximately 18,500 miles. More than
1,000 islands make up 40 percent of the total land
area. The region is home to 34 communities. The
three largest communities—Juneau, Ketchikan, and
Sitka—together are home to 75 percent of the
78%
regional population.
CULTURE
The dominant culture in the region is indigenous. Alaska
}
Natives—the Tlingit, Haida, and Tsimshian—make up
nearly a quarter (23%) of the region’s population. The
Tlingit have resided in the region for 11,000 years. The
94%
region’s mild climate, abundant food and raw materials
supported the development of highly organized and culturally
advanced societies with extensive trade routes and rich artwork.
FEDERAL
Southeast Alaska Land Ownership
LAND OWNERSHIP
A lack of privately-owned land and land available for development is
unique to Southeast Alaska and impacts the ability of the region to
nurture the private sector. (See infographic on the left.) Southeast
Alaska’s land ownership is dominated by the federal government,
16%
Circle size = Number of Acres
which manages 94 percent of the land base. Most of this (78 percent,
OTHER FEDERAL or 16.75 million acres) is the Tongass National Forest.
HOLDINGS MAKE UP
NEARLY ALL THE REST ECONOMIC TRENDS
(MOSTLY GLACIER BAY) Starting in the 1880s, the economy of Southeast Alaska experienced
a century of growth that intensified after statehood in 1959. From
ALASKA NATIVE statehood into the 1990s, population and employment levels in
3.4% ORGANIZATIONS ARE THE
REGION’S NEXT LARGEST
LANDOWNER
Southeast more than doubled as the workforce expanded in the
areas of mining, government, fishing, tourism, and timber.
In the beginning of the 1990’s seafood and timber directly accounted
STATE OF ALASKA for a fifth of the regional economy. However, over that next decade
2.5% LANDS INCLUDE THOSE
MANAGED AS PART OF THE
pulp mills and sawmills in the region closed, laying off 3,200 workers.
During the same period, the value of salmon declined and catch
MENTAL HEALTH TRUST levels fell. The population continued to decline through 2007.
0.25 MUNICIPAL LAND
HOLDINGS
Between 2008 and 2015, the region experienced a significant
economic recovery, rebounding to record numbers of jobs, wages,
0.05% PRIVATE LANDOWNERS and residents. However, the continuing state fiscal crisis resulted in
the loss of 20% of all State of Alaska jobs across the region over an
eight year period, reversing the economic trajectory. The strength of
the visitor sector was poised to lead the regional to a stronger
economic position in 2020, but the COVID-19 pandemic wiped out
the tourism season in 2020, wreaking havoc across the regional
economy. An extremely poor 2020 salmon season exacerbated the
economic impacts of the pandemic.
In some ways, Southeast Alaska is well positioned for an economic
recovery. An average salmon season is being forecast for 2021 and
the region led the way nationally on vaccine distribution. However, a
second summer of cruise ship cancellations, combined with
Sources: State of Alaska; US Forest Service; Sealaska. Economies in transition: An continued lack of resolution to the state budget crisis leads to
assessment of trends relevant to management of the Tongass National Forest, USDA 1998.
Background image carving by Mike Dangeli.
ongoing economic uncertainty.
Southeast Alaska 2025 Economic Plan: April 2021 Prepared by Rain Coast Data Page 5
S O U T H E A S T C O N F E R E N C E
Southeast Jobs COVID-19 Impacts by Industry
Change in Southeast Jobs: First 11 Months of COVID-19 Job Losses = -6,100
Seafood Processing
COVID-19 Impacts 2020
-46% Transportation -1,409
-43% Leisure & Hospitality -1,936
-20% Retail -855
It is too early to measure the full
impacts of COVID-19 on Southeast -20% Information -100
-16% of Alaska jobs and the economy
because self-employment data, -16% Seafood Processing -209
SE jobs lost representing one-fifth of all Southeast
workers, is not yet available for this period. -13% Professional Svcs -209
However, early job numbers provide valuable
insights. -9% Health -255
Between April 2020 and February 2021, Southeast Alaska was down
6,100 average monthly jobs, or -16% of its total workforce, Mining, Logging -8% -82
compared to the same period in 2019. Jobs in Southeast have been
lost at a much higher rate than most of the rest of Alaska. Local Gov’t -7% -436
Hardest hit were those sectors that provide visitor services.
Combined, the transportation, leisure, and hospitality sectors shed State Gov’t -6% -273
3,345 jobs (average monthly employment), down nearly half due to
the decline of the visitor industry in Southeast Alaska. Retail in the Financial Activities -4% -36
region was also down significantly with a 20% overall decline (855
jobs). Tribal Gov’t -2% -18
The seafood processing sector was down by 16% (209 jobs) between
April 2020 and February 2021 compared the same months in the Construction +9 -25
jobs
previous year. These jobs losses were exacerbated by the abysmal
Federal Gov’t +27 jobs
summer salmon returns and compounded by low seafood prices. 0
The struggling state sector, which had already been cut deeply in
-0.375 -0.25
Loss of Alaska Jobs:
-0.125 0
First 12 month of
prior years, was down by 273 additional jobs (6%), with local
pandemic compared Northern
government jobs down by 436 average monthly jobs (-7%). Federal to previous year
jobs were up slightly, due to an increase of US Census workers. by region -16%
Interior How do COVID
Southeast COVID-19 Employment Losses -11% Southeast job
losses compare?
Unemployment rates are not calibrated to be an especially useful tool at this time. More Anch/ -10%
valuable is the comparison of monthly employment during COVID-19 impacted months, Mat-Su
compared to data from the previous year. Pandemic summer months were especially
hard on Southeast Alaska, when total employment fell by up to 24% in June, and by
10,000 jobs in July. Since November, employment percentages have been in the single Southwest Gulf Coast
digits, and by March the region was “only” down by six percent of normal employment -11% -10%
levels. However, 2021 summer employment is expected to be significantly
Southeast
curtailed due to the cancellation of large cruise ships to the region.
-16%
0 -5,700
April
-9,200
May
-9,800 -10,000
June July
-9,200
Aug
-7,900
Sept
-4,900
Oct
-2,600
Nov
-2,400
Dec
-2,500 -2,400 -1,900
Jan 2021 Feb 2021 Mar 2021
-6%
2020 2020 2020 2020 2020 2020 2020 -8% -7% -8% -7%
-13%
5 -16%
-19%
-21%
-23% -24% -23%
Source: Alaska Department of Labor
5 Southeast Alaska 2025 Economic Plan: Released April 2021 Prepared by Rain Coast Data Page 6
S E Q U O I A C L U B
Table tracks key Southeast indicators over the
CHANGE IN THE LAST YEAR: 2018 to 2019 past year, along with associated changes.
% CHANGE CHANGE
DEMOGRAPHICS 2018 2019 2018-2019 2018-2019
Population 1 72,657 72,373 -0.4% -284
Ages 65 and older 2 11,055 11,544 4.4% 489
Under Age Five 2 4,137 3,956 -4.4% -181
Twenty somethings 2 8,423 8,319 -1% -104
K-12 School District Enrollment 3 11,334 11,344 0.1% 10
GENERAL ECONOMIC CONDITIONS
Total Labor Force (jobs, includes self-employed & USCG)1,5,6 45,642 46,097 1% 455
Total Job Earnings1, 5, 6 $2.28 billion $2.35 billion 3% $62.9 million
Total Private Sector Payroll 1, 6 $1.51 billion $1.56 billion 4% $59.1 million
Average Annual Wage 1 $50,023 $50,873 2% 850
Annual Unemployment Rate 1 5.9% 5.9% 0.0% 0.0%
TOP ECONOMIC SECTORS 2018 2019 % CHANGE CHANGE
GOVERNMENT PUBLIC SECTOR: 33% OF ALL EMPLOYMENT EARNINGS
Total Government Employment 1, 5 13,148 12,994 -1% -154
Federal Employment 1, 5 (8% of all employment earnings) 2,111 2,032 -4% -79
State Employment 1 (14% of all job earnings) 4,771 4,705 -1% -66
City and Tribal Employment 1 (14% of all job earnings) 6,266 6,257 -0.1% -9
Total Government Payroll (includes USCG) 1, 5 $776.9 million $780.7 million 0.5% $3.77 million
Total State of Alaska Payroll $283.3 million $284 million 0.2% $702,032
VISITOR INDUSTRY KEY INDUSTRY: 11% OF ALL EMPLOYMENT EARNINGS
Total Visitor Industry Employment 1, 6 8,004 8,394 5% 390
Total Visitor Industry Wages/Earnings 1, 6 $249.3 million $271.6 million 9% $22.3 million
Total Southeast Alaska Passenger Arrivals 1,618,311 1,787,345 10% 169,034
Cruise Passengers 10 1,169,000 1,331,600 14% 162,600
Total Air Passenger Arrivals from Outside SE 11 435,476 444,217 2% 8,741
Total AMHS Passengers from Outside SE 12 13,835 11,528 -17% -2,307
COMMERCIAL FISHING & SEAFOOD INDUSTRY KEY INDUSTRY: 10% OF ALL EMPLOYMENT EARNINGS
Total Seafood Employment (includes fishermen) 1, 6 3,711 3,743 1% 32
Total Seafood Employment Earnings 1, 6 $237.4 million $238.0 million 0% $584,614
Value of Seafood Processed 7 439.7 million 422.0 million -4% -17.6 million
Pounds Landed (commercial seafood whole pounds by SE residents) 8 185.2 million 208.3 million 13% 23.2 million
Estimated Gross Earnings (ex-vessel value of pounds landed) 8 $246.9 million $217.6 million -12% -$29.3 million
HEALTH CARE INDUSTRY (PUBLIC & PRIVATE HEALTH) KEY INDUSTRY: 11% OF ALL EMPLOYMENT EARNINGS
Health Care Employment 1, 6 3,547 3,574 0.8% 27
Health Care Wages 1, 6 $216.8 million $227.4 million 5% $10.6 million
MARITIME ECONOMY (Includes employment from all industries) TOP SECTOR: 27% OF PRIVATE SECTOR EMPLOYMENT EARNINGS
Private Maritime plus USCG Employment 1,5,6 6,273 6,544 4% 271
Private Maritime plus USCG Wages 1,5,6 $396.8 million $408.9 million 3% $12.1 million
OTHER SELECTED STATISTICS 2018 2019 % CHANGE CHANGE
Construction Employment 1, 6 (6% all employment earnings) 1,909 1,903 0% -6
Mining Employment 1 (4% of all employment earnings) 889 934 5% 45
Timber Employment 1 (4% of all employment earnings) 337 372 10% 35
Price of Gold 7 $1,269 $1,392 10% 123
Total Southeast AMHS Ridership12 179,312 135,388 -24% -43,924
Cost of Living: Consumer Price Index1 225.5 228.7 1% 3
Housing Starts: Housing Permitted /Completed 4,1 188 294 56% 106
Avg. Daily Volume ANS Oil Production (mbbls/day)14 508,601 489,771 -4% -18,830
Annual Avg. Domestic Crude WTI Oil Prices (in $/Barrel)14 $71.71 $65.49 -9% -$6.22
Sources: 1Alaska Department of Labor (ADOL); 2ADOL Southeast Alaska Population by Age; 3Alaska Department of Education and Early Development; 4Based on the quarterly
Alaska Housing Unit Survey, a survey of local governments and housing agencies; 5 US Coast Guard; 6 US Census Nonemployer (self-employment) Statistics; 7Kitco Metals Inc.;
8ADF&G Southeast Alaska Commercial Seafood Industry Harvest and Ex-Vessel Value Information; 10Cruise Line Agencies of Alaska; 11US Bureau of Transportation Statistics (RITA);
12Alaska Marine Highway System data; 14Alaska Department of Revenue Crude Oil and Natural Gas Prices.
Nullam arcu leo, facilisis ut 7
S O U T H E A S T C O N F E R E N C E
The Whole Southeast Alaska Economy 2019
In 2019, Southeast Alaska gained 455 year-round equivalent jobs and $63 million in workforce earnings over 2018. Approximately a
quarter (26.1%) of regional workers are non-residents.
Annual Average Jobs Employment Earnings
46,097 Jobs $2.3 Billion Workforce Earnings
UP 455 JOBS IN 2019 +1% UP $63 MILLION +3%
Visitor
Visitor Industry Local Gov't
Local Gov't Industry
18% 13% 12%
14%
Seafood
Seafood State Gov't 10%
State Gov't 8% 12%
10%
Private Health Care Private Health Care
7% 8%
Fed Gov't
s,
s,
Fed Gov't
Pro
tie
ie
Profession
t
Fi
i
ili
til
4%
Ut
8%
Fin
na ional S
U
fess
g,
g,
nc
sin
Trade
sin
3%
anc
%
Other
ou
ial
ou
Trade
s2
Constru
Other
h
h
Construction 6%
6%
cia 4% are
cia 5% are
ial
es
Ac
6%
ice
,W
,W
10%
c
tiv
4%
al Services
Ac
rvi
or er
or er
rv
sp mb
iti
sp mb
Min
Min
erv
tiv
Se
Se
an Ti
t
es
an Ti
t
ction 4
Tr fo,
Tr fo,
itie
l
ices
5%
l
In
ing
in
In
g2
s4
So
So
4
5%
%
%
%
%
6%
2019 Southeast Alaska Employment Earnings
EMPLOYMENT RELATED EARNINGS EMPLOYMENT NUMBERS
Annual Average Self-
Self-Employment Employment Employed Total
Wages (2019) Earnings (2018) Total Earnings (2019) (2018) Employment
Government (includes Coast Guard) $720,119,719 $60,582,082* $780,701,802 12,354 640* 12,994
Visitor Industry $235,179,580 $36,429,000 $271,608,580 7,344 1,050 8,394
Seafood Industry $69,711,072 $168,316,000 $238,027,072 1,497 2,246 3,743
Trade: Retail and Wholesale $123,764,467 $24,031,000 $147,795,467 3,905 567 4,472
Health Care Industry (private only) $171,156,119 $14,417,000 $185,573,119 2,762 263 3,025
Construction Industry $92,347,611 $38,999,000 $131,346,611 1,332 571 1,903
Financial Activities $54,349,824 $74,373,000 $128,722,824 1,072 761 1,833
Professional and Business Services $78,474,062 $43,487,000 $121,961,062 1,622 1,319 2,941
Mining Industry $94,460,451 $307,000 $94,767,451 927 7 934
Social Services $40,307,321 $3,977,000 $44,284,321 1,227 187 1,414
Information (publishing, broadcasting, telecomm.) $22,941,315 $1,358,000 $24,299,315 475 60 535
Timber Industry $20,478,427 $2,038,000 $22,516,427 315 57 372
Warehousing, Utilities, & Non-Visitor Transport $53,270,575 $14,500,000 $67,770,575 815 162 977
Other $60,615,872 $25,120,000 $85,735,872 1,657 903 2,560
Total $1,837,176,415 $507,934,083 $2,345,110,498 37,304 8,793 46,097
Sources: Alaska Department of Labor 2019 Employment & Wage data; 2018 (latest available) US Census Nonemployer (self-employment) Statistics; Active Duty Military Population by
2019, ADOL.*These cells in Government refer to 2019 active duty Coast Guard personnel employment and wages, and not self-employment data.
Notes: Seafood Industry includes animal aquaculture, fishing & seafood product preparation, and Southeast Alaska resident commercial fishermen (nonresident fishermen & crew who
did not report income are excluded). Visitor Industry includes leisure & hospitality, and visitor transportation (air, water, scenic). Timber includes forestry and logging support activities
for forestry, and wood product manufacturing.
Southeast Alaska 2025 Economic Plan: April 2021 Prepared by Rain Coast Data Page 8
31
CHART: SOUTHEAST ALASKA 1,580,000
CRUISE PASSENGERS
1.58 million projected
THE VISITOR
2009-2022
month
gap
1,331,600
INDUSTRY
1.33 million
48 passengers
1,169,000
Unknown
1,089,700
1,018,700 1,025,900
999,600 994,000
967,500
937,000
875,593 883,000
+ 3% + 6% + 7% +14%
2009 2010 2011 2012 2013 2014 2015 2016 2017 2018 2019 2020 2021 2022
Visitor Industry passengers came to Southeast Alaska from
outside the region. Airline passenger traffic
In a typical year, Southeast Alaska would have
been the most visited part of the state, with
8,350 Annualized Jobs from outside the region grew 2%, and cruise
passenger traffic to the region increased by
two-thirds of all tourists coming to the region.
In 2020, tourists had been expected to spend
$272 Million in Wages 14%. Only one indicator trended downwards. nearly $800 million across Southeast Alaska
Ferry passengers from outside the region fell communities.
U P 3 90 J O B S I N 2 0 1 9 + 5 % by 17% due to the continued dramatic In addition to lost revenue for the private
WAGES UP 9% decreases in AMHS funding and service. sector, municipalities are also facing
In 2020 the economic significant losses due to the loss of tourism.
The 2019 visitor
trajectory of the In 2020, local governments lost an estimated
season in Southeast
visitor industry $40 million in sales tax, $36 million in lost
Alaska was record
abruptly changed. The impact of COVID-19 head tax, and $5 million in lost bed and
breaking by nearly every measure: passenger
on the tourism sector has been nothing short moorage tax. Hardest hit was the
arrivals increased by 10%, industry wages by
of devastating. Municipality of Skagway, which lost 91% of its
9%, and jobs grew by 5%. In 2019 the visitor
expected sales tax dollars, mostly due to the
industry was the largest jobs provider for the CRUISE SHIP SEASON CANCELLED loss of cruise ships.
region, accounting for 18% of all annualized Tourists in Southeast Alaska are
employment in Southeast Alaska. The visitor ALL MODES OF PASSENGER
predominantly cruise ship visitors. Cruise
sector paid out more wages than any other passengers had been expected to make up TRANSPORTATION DOWN
private sector industry and had been set to 90% all of tourists in 2020 and 2021. In 2020 The COVID-19 economy also wreaked havoc
surpass the state and municipal sectors to the Canadian government prohibited cruise on other aspects of passenger transportation
become the largest wage provider in the ships carrying more than 100 people ships sector. In 2020 airline passenger arrivals were
region overall in 2020. from sailing through Canadian waters. This down by 58% across the region. Ferry
ban was instead extended through the end of passenger traffic was down by 71%.
The gains in 2019 followed a meteoric rise.
Since 2011, tourism added 2,400 year-round February 2022. Additionally, the Centers for PLANNING FOR 2022
equivalent jobs to the Southeast economy, Disease Control extended their “conditional Several small cruise ship lines are exempt
growing to 8,350 annualized jobs, while sail order” through November 2021. from Canada’s ban, and will be operating in
tourism workforce earnings grew by 66%. Southeast Alaska tourism-focused businesses 2021. However, with uncertainty regarding
Those working in the visitor industry earned are subsequently facing 31 months between any large cruise ship sailings, the region is
$272 million in 2019—or 12 percent of all cruise ship visits—many with little to no gearing up for potentially 1.58 million cruise
regional employment income. The average revenue opportunities. In 2020, 43 cruise passengers in 2022. Maintaining the capacity
annualized wage in the visitor industry was ships had been scheduled to visit the region, to respond to demand and opportunities in
$32,360, lower than the average regional carrying 1.41 million passengers on 606 2022 will require a high level of support for
wage of $50,870, but that figure had also voyages. All cruises but two were cancelled. small business owners. COVID relief funding
been steadily increasing over time. Two small cruise ships attempted trips with provided a much needed cash infusion.
48 combined passengers, but one of those Tourism organizations the region received
In 2019, 1.8 million air, ferry, and cruise
trips was aborted. $52 million in federal support so far.
Sources: Combination of ADOL Employment and Wage data and US Census Nonemployer (self-employment) Statistics; McDowell Group; US Bureau of Transportation Statistics (RITA);
Alaska Marine Highway System; Cruise Line Agencies of Alaska; Cruise Market Watch; Cruise Critic; Juneau International Airport Passenger Statistics; Economic Impact of Alaska's Visitor
Industry. Forecast 2020 U.S. Department of Commerce, US Office of Travel and Tourism Industries. OMB budgets. Cruise Lines International Association Alaska.
Note: In this analysis, the visitor industry includes leisure and hospitality businesses, along with air, water & scenic transportation companies.
Photo: Saxman Totem Park.
Southeast Alaska 2025 Economic Plan: April 2021 Prepared by Rain Coast Data Page 9GOVERNMENT
2%
Municipal
l
Triba
Co
12%
as al 5
State
Fe th
tG %
(o
de er)
12%
r
ua
rd
3%
Government wages as a Government Jobs 2019
percentage of all Southeast Local 5,252 Jobs -9
employment earnings 2019
State 4,705 Jobs -66
Federal 2,032 Jobs -79
Tribal 1,000 Jobs +1
Southeast State Jobs health spending are Alaska's largest
Government State jobs in the region are down for the 8th year operating expenses, accounting for 48% of
12,994 Jobs
in a row, for a total of 1,130 jobs lost since 2012,
a decline of 20% UGF expenditures, while Permanent Fund
5,700
Dividend (PFD) payments comprised 18%.
D OWN 153 J OBS IN 2019 -1% Alaska has no state sales tax, no state
-1,130 jobs
Government wages property tax, and no income tax.
made up one-third of all 4,950 The pandemic is
regional employment exacerbating an
earnings ($781 million) and 28% of the already difficult
region’s jobs (12,994) in 2019. situation. Even without PFD payments, the
4,200
state will not have enough cash in its primary
2012
2013
2014
2015
2016
2017
2018
2019
2020
STATE GOVERNMENT LOSSES
savings account to cover the budget deficit.
For the past eight years, the region has
struggled with the impacts of decreased FEDERAL GOVERNMENT The saving grace is that $546 million in
State government employment and Federal government employment losses have COVID-19 relief funds made its way to the
spending. The state remains the region’s compounded state job cuts. Since 2005, region. Alaska as a whole received $3.4
most important economic sector, providing federal employment in the region has fallen billion so far. Relief funding is critical in
12% of all regional wages. From 2012 to by 680 jobs in Southeast Alaska. supporting regional households, businesses,
mid-2020, state jobs have fallen by 20%, a service providers, local governments, and
decline of 1,130 annualized workers. Outside LOCAL GOVERNMENT communities during COVID-19.
Southeast, 13% of state jobs have been cut. Local entities across the region are
SE COVID-19 RELIEF
Historically, oil accounted for up to 90% of scrambling to provide new programs and
Borough Name COVID Relief $
the state Unrestricted General Fund (UGF); services to replace those cut by the state,
resulting in financial stress as municipalities Juneau Borough $191,855,825
today, oil covers about 30 percent. Ketchikan Borough $121,613,864
try to do more programming with reduced
Sitka Borough $76,166,463
funding.
Skagway Municipality $27,913,551
Avg. Daily Volume of the Trans Alaska Pipeline System
and Inflation Adjusted Price Per Barrel, 1978-2020 STATE BUDGET CRISIS Prince of Wales-Hyder $28,977,047
00 Oil revenues accounted for up to 90 percent of the
state’s unrestricted revenues
Even before COVID-19, Alaska’s budget was
in a state of crisis due to declining oil
Petersburg Borough
Haines Borough
$36,201,167
$20,734,853
Wrangell Borough $14,806,666
120
How we got here production and prices. The state has
00 90
Average Daily Average Price
per Barrel
operated in deficit mode for the past seven
Hoonah-Angoon Census Area
Yakutat Borough
$14,566,737
$6,489,639
Volume years, using $17 billion in savings to cover
Non-specific $7,209,943
00 60
budget gaps. What was once an almost
inexhaustible savings reserve is set to be
Southeast Total $546.5 mill
Notes: Includes PPP, EIDL, AK CARES, local grants, and
00 30
depleted by 2021, reducing the resiliency of
the state's financial position. Education and
direct payments to tribes. Source: Alaska Small Business
Development Center and usaspending.gov.
Sources: ADOL 2019 Employment and Wage data; Alaska Department of Revenue Crude Oil Prices. Fitch Ratings.
0 0
1977 1981 1985 1989 1993 1997 2001
1978 1982 1986 1990 1994 1998 2002 2006 2010 2014 2020
2005 2009 2015 2017
Alaska Office of Management Budget.
Southeast Alaska 2025 Economic Plan: April 2021 Prepared by Rain Coast Data Page 10THE SEAFOOD INDUSTRY Inflation Adjusted
value to Fishermen (millions)
Value
VALUE & POUNDS OF SEAFOOD LANDED Landed Pounds (millions)
SOUTHEAST ALASKA 2008 TO 2019
$405
480
$387
$354
$316 $321 $315
360
$294
$259 $250 $248 $250
$218
240
120
231 283 278 396 267 480 301 301 223 304 185 208
2008 2009 2010 2011 2012 2013 2014 2015 2016 2017 2018 2019
Southeast Seafood SEAFOOD LANDED IN SE ALASKA BY SPECIES, 2019
Outer ring = % of harvest by DOLLAR value: $218 million
Industry 3,743 Jobs Inner pie = % of harvest by POUNDS landed: 208 million
Twenty-twenty is
19%
UP 32 JOBS IN 2019 Other Salmon currently on track to
2%
The Southeast Alaska go down as one of the
seafood harvest in worst seafood seasons in Southeast Alaska
2019 was 208 history. Reduced seafood prices — due to
11% on 15% the shutdown of the global restaurant
million pounds with an ex-vessel value of Pink Salmon 9%
alm
Pink Black
sector, as well as trade war tariffs —
$218 million. The regional 2019 fishing
37% 4% Cod
rS
i n g
season was significantly below the ten- rr coincided devastatingly with one of the
He d 5%
he
o worst salmon catches on record.
year average, with lower pink salmon
ck C
Ot
returns and harvest returns primarily to BlaHal ibut 4% Processors spent millions on mitigation
blame. Crab 3 measures,
Halibut further impacting ex-vessel
%
Ot prices and workforce levels. In ASMI’s
The overall catch was 31% below the 10- he
r6 August 29th, 2020 update, the salmon
year seafood average in terms of pounds 18% Chum %
catch is significantly below where it was
landed. Fishermen caught 53 million Chum 36% 17%
a year ago in terms of total fish caught:
fewer pounds of pink salmon than they did,
on average, between 2009 and 2018 (-41%);
and 26 million fewer pounds of herring SE Salmon Catch: 2020 vs.. 2019
(-93%). Still, the total catch was a slight Other Year over year: week 35
9% Crab 9% Sockeye -67%
increase over 2018 by volume.
Pink -22%
The 2019 catch was 29% below the inflation- Keta/Chum -74%
adjusted10-year average value of $308 83% of the regional seafood catch by volume, Coho -48%
million. The impacts of the US-China trade and just under half of total ex-vessel value Chinook -3%
war, resulting in lower seafood prices, led to ($104 million). Halibut and black cod, at 8% of -80% -40% 0%
an unusually low overall catch value in 2019. the total catch, accounted for one-third of “For context” one sockeye fisherman
total catch value in 2019. The majority of the explains, “in a good year we catch 4-5 times
KEY ECONOMIC DRIVER statewide catch of Chinook, coho, keta this year’s catch, and our best year is more
The regional seafood industry (including (chum), shrimp, Dungeness crab, and the dive than 6 times higher than 2020.”
commercial fishing and seafood processing) fisheries occurs in Southeast Alaska.
generated 3,743 annual regional jobs and Seafood remains critical to the regional
$238 million in earnings in 2019, making up In 2019, shore-based seafood facilities in economy and way of life. However, the sector
8% of jobs in the region and 10% of all Southeast Alaska processed 153 million faces growing uncertainty regarding changing
earnings. While this represents 32 more pounds of seafood, with a wholesale value of ocean conditions, tariffs, state budget cuts,
annualized jobs over 2018, it is a loss of 650 $422 million. This represented a 15% increase regulatory decision-making, and global
seafood sector jobs since 2015. in seafood pounds processed compared to farmed seafood competition. Meanwhile, the
2018, but an $18 million decline in the value fledgling mariculture industry continues to
In 2019, the five salmon species represented of processed product. grow.
Sources: Combination of ADOL 2019 Employment and Wage data; 2018 US Census Nonemployer (self-employment) Statistics; ADF&G Seafood Production of Shorebased Plants in
Southeast Alaska; ADF&G Southeast Alaska Commercial Seafood Industry Harvest and Ex-Vessel Value Information; Alaska Commercial Salmon Harvests and Ex-vessel Values, ADF&G.
Weekly Alaska Salmon Harvest Updates are produced for ASMI by The McDowell Group. Seafood Industry includes animal aquaculture, fishing, & seafood product preparation and
Southeast Alaska resident commercial fishermen (nonresident fishermen & crew who did not report income are excluded). Photo: Helen Decker.
Southeast Alaska 2025 Economic Plan: April 2021 Prepared by Rain Coast Data Page 11Southeast Timber Southeast Mining
Industry 372 Jobs Industry 934 Jobs
UP 35 JOBS IN 2019 +10% UP 45 JOBS IN 2019 +5%
In a rare reversal of Mining industry employment in the region was up
fortune, regional in 2019, growing by 5%. There were 934 annual
timber jobs increased average mining jobs in Southeast Alaska, with a
by 10% in 2019, while timber wages grew by 20%. The workforce payroll of $95 million. The average annual mining wage was $101,500
increase was small however; growing by just 35 annualized jobs to 372 in 2019, double the overall regional wage of $51,900. Two large
in 2019, with total workforce earnings of $22.5 million. Most of the mines operating in the region account for most mining employment.
region's timber jobs are concentrated on Prince of Wales Island, which Hecla Greens Creek is one of the largest silver mines in the world,
is home to Viking Lumber, the last remaining mid-sized sawmill in while Coeur Alaska’s Kensington Mine is exclusively a gold mine. In
Southeast Alaska. Southeast timber jobs peaked at 3,543 annual 2019 Greens Creek milled its highest tonnage in 30 years of operation
average jobs in the 1990s. Regional timber job increases were mostly as well as its highest silver production and Silver production was up
due to increased timber processing activity, rather than harvesting. 24% to 9.9 million ounces. Kensington achieved record gold
Total timber harvest actually decreased in 2019. A land exchange production of 127,914 ounces, an increase of 12% over the prior year.
between the Mental Health Trust and the US Forest Service opened Active mining exploration is occurring around the region, most
up limited areas for timber, keeping the industry viable. notably in Juneau, Haines, and Prince of Wales.
Despite a successful 2019, regional timber In August 2020, Hecla Greens Creek had 440
supplies are worrisomely low in 2020. The full-time permanent employees (+4 from 2019),
Forest Service has not provided the industry and Coeur Alaska Kensington had a staff of 386
with acreage commitments put forth in the 2016 Tongass Land and (the same as 2019). While shift change protocols had to be
Resource Management Plan, meaning operators still do not have a reimagined in response to COVID-19 mandates and safety
predictable timber supply upon which to build longer-term business precautions, mining is the only sector in which jobs and revenue did
plans. Moreover, the industry — currently comprised of a handful of not decrease during the pandemic, providing much needed economic
small operators across the region — continues to face constant stability for the region.
litigation, along with a coordinated national campaign intended to Metal prices, which tend to rise in response to economic turmoil, have
sow public disapproval of the regional industry. Sealaska's transition been surging. The price of gold reached an all-time high of $2,067 in
out of timber harvest on Prince of Wales is another economic blow to August, while silver has reached its highest levels since 2013. As
the community and industry. global productivity outside the US has returned, Zinc prices increased
While there are continued opportunities for timber sales in Asia, the by 25% between March and August. The resurgence in precious
trade war includes regional timber, making it difficult to negotiate metals prices provides optimism but mining leaders in the region are
agreements. Spruce remains the subject of higher Chinese import watching global economic factors carefully as they plan for the future.
Gold Silver
tariffs, especially impacting northern Southeast, where the forests are per Average Gold and Silver Prices 2008 to Aug.2020 per
ounce ounce
primarily spruce. U.S. lumber exports to China fell by 57% in 2019. $2,000 $35
Gold Silver
The adoption of the Alaska Roadless Rule may improve the Forest
$1,600 $25
Service's ability to offer economically feasible sales that meet the
needs of the industry. $1,200 $15
Sources: ADOL 2019 Employment and Wage data; Kitco Metals Inc; Coeur Mining Inc.
$800 $5
2019 Annual Report; Hecla Mining Company 2019 Annual Report. U.S. International
Aug.
2008
2009
2010
2011
2012
2013
2014
2015
2016
2017
2018
2019
2020
Trade Commission. Photo credits: Tessa Axelson and Kensington Mine.
Southeast Alaska 2025 Economic Plan: April 2021 Prepared by Rain Coast Data Page 12Construction Industry Southeast Health Care
1,903 Jobs Industry 3,574 Jobs
DOWN 6 JOBS IN 2019 -0.3% UP 27 JOBS IN 2019 +0.7%
For the sixth year in a row construction Southeast Alaska’s 3,574 healthcare workers
employment is down, bringing employment to comprised 8% of the regional workforce in
its lowest level since the early 1990’s, although 2019, earning 11% ($227 million) of all wages.
the decline had stabilized. Jobs fell by just 6 last year to 1,903, a Regional health care employment continued to increase, albeit
combined loss of 356 jobs, or 16% decline, since 2013. incrementally, as the sector added 27 more annualized jobs in
Construction workers in the region earned $131 million in 2019 — 2019. Wages for the industry have been rising more quickly in an
or 4% of all Southeast Alaska employment earnings. effort to attract workers, growing by $53 million since 2014. The
region was already facing a shortage of health care workers due to
One positive indicator for the sector was that housing construction
an aging populace and growing patient volumes. With the advent
was up in 2019, as 106 more housing units were permitted or
of COVID-19, the demand for health care workers has intensified
completed than in the year prior. A total of 294 new homes were
nationally and globally, making it even more difficult for the region
permitted in 2019, an increase of 56%. The regional residential
to attract and compete for workers.
housing market has not experienced decline.
Health care jobs have been moving from the public sector to the
Construction work during 2020 remained private sector. Southeast Alaska Regional Health Consortium
steady as planned projects to support the (SEARHC) has been collaborating with struggling municipal
tourism sector moved forward. These hospitals to provide services. In the past two years, SEARHC took
projects had the unexpected benefit of being able to occur without over operations of the Sitka and Wrangell hospitals.
having to simultaneously manage large visitor traffic volumes.
Health care became the nation’s top priority
However, there is a great deal of uncertainty moving forward in the
in 2020, as well as the region’s. Southeast
construction/engineering sector. Generally, firms are busy at the
health care institutions showed a high level
moment, but there are few future projects in the pipeline to
of readiness in the face of the COVID-19 crisis. Despite significant
provide longer-term security. Cuts in state spending led to the
job cuts across most other sectors, health care employment levels
reduction of large-scale construction projects across the region.
have remained relatively constant, as workers were redeployed to
While new projects related to the visitor industry were filling that
high demand roles, such as virus testers and screeners. Still,
gap, projects that were not completed this summer have been
providers understand that there are vulnerabilities within the health
delayed until the tourism industry gets back on track. Communities
care system that are likely to be exacerbated following the
have developing proposals to create some level of construction
COVID-19 crisis, such as Medicaid cuts and reduced access to
activity by focusing on deferred maintenance projects in order to
health care insurance. Concerns regarding the longer-term health
stimulate the economy during COVID-19, but the volume of such
impacts of COVID-19 are expected to increase overall healthcare
potential investments remains relatively small, and material costs
service demands moving forward.
continue to escalate. Federal construction projects appear to be
Southeast Alaska Health Care Employment Wages
the most promising moving into 2021.
$216.8 $227.6
230 $196.7
Sources: Combination of Alaska Department of Labor 2019 Employment and Wage data
and 2018 US Census Nonemployer (self-employment) Statistics; State of Alaska. Note: Last
$174.5 $183.7 $189.3
year’s SEBTN included State Pioneer Home health care provider numbers. This year those
165
numbers were not available and were excluded. Photography credits: SEARHC and +5% +3% +4% +10% +5%
Robert Sharclane.
100
2014 2015 2016 2017 2018 2019
Southeast Alaska 2025 Economic Plan: April 2021 Prepared by Rain Coast Data Page 13DEMOGRAPHICS Population 71,946
Ot
Alaska Native
he
A
r2
23%
si
1%
an
%
ck
Bla
8%
White
66%
74,500
74,354
74,133
74,313
73,825
73,599
73,082
73,047
72,805
72,571
72,214
72,250
POPULATION CHANGE
71,946
71,853
71,664
71,546
71,712
2018 TO 2020
71,141
71,399
70,504
Community 2018 2020 Change
70,219
Juneau Borough 32,231 31,773 -458
Ketchikan Borough 13,843 13,677 -166
Sitka Borough 8,621 8,523 -98
2000
2001
2002
2003
2004
2005
2006
2007
2008
2009
2010
2011
2012
2013
2014
2015
2016
2017
2018
2019
2020
Petersburg Borough 3,195 3,189 -6
Haines Borough 2,476 2,520 44
Wrangell Borough 2,423 2,379 -44
2020 marked the Angoon census area, and Wrangell, where
Metlakatla 1,396 1,321 -75
6th consecutive median ages are 48.6, 47.7, and 47.5
Skagway Borough 1,087 1,147 60
year of population respectively, it is one-third. The median
decline in Southeast Alaska. The region age of Southeast as a whole is now 40, Craig 1,093 1,065 -28
lost an additional 625 people, for a six- four and a half years older than the state Hoonah 788 769 -19
year decline of 2,550 residents, a as a whole. Klawock 776 761 -15
population loss of three percent. In 2020, Kake 600 578 -22
SCHOOL ENROLLMENT DOWN
births exceeded deaths by 170, and 795 Thorne Bay 523 511 -12
While K-12 enrollment increased regionally
more people moved away than moved into for the 3rd time in 23 years in 2019, the Yakutat Borough 522 574 52
the region. mostly online 2020 pandemic school year Gustavus 553 551 -2
Most of the communities in the region lost reduced public school population by 700 Angoon 410 382 -28
population in 2020. Juneau bore the brunt students, as parents chose homeschooling Hydaburg 398 380 -18
of the overall losses — a result of recent programs, many of which did not direct Coffman Cove 168 183 15
dramatic state employment reductions, funds to local school districts. In 2020, Tenakee Springs 144 118 -26
with cuts especially focused in the capital enrollment was down by 6% across the Naukati Bay 124 137 13
city. Juneau has lost 1,400 residents since region. Wrangell saw a 41% decline (the Hollis 124 131 7
2015, including nearly 300 in 2020. highest) while districts like Craig with Klukwan 94 86 -8
preexisting online services increased Kasaan 81 104 23
After being hit hard with population losses,
student enrollment by 55%. A loss of
Yakutat is bouncing back, regaining 10% of Hyder 80 67 -13
funding allocation could significantly
its population over the past two years. Pelican 67 69 2
impact the financial position of regional
Port Alexander 55 68 13
THE MEDIAN AGE IS NOW 40 schools, unless the legislature institutes a
solution. Whale Pass 57 52 -5
Southeast has the state’s oldest residents.
Since 2010, the most pronounced Edna Bay 43 41 -2
The elements that created population Port Protection 31 31 0
demographic shift has been aging of the
losses in recent years, most notably the Game Creek 18 17 -1
population. During that period, the 60-plus
reduction of state jobs and services, have Point Baker 13 12 -1
population grew by 5,300 people, a 45%
been exacerbated by the 2020 COVID
increase over 2010 due to aging in place. Elfin Cove 16 9 -7
economy. Pandemic conditions will
A quarter of people in the region are now Remainder 755 721 -34
inevitably lead to further population
age 60 or older. In Haines, the Hoonah-
decline. Total 72,805 71,946 -859
Sources: Alaska Department of Labor (ADOL); ADOL Southeast Alaska Population by Age, Sex and Borough/Census Area, 2018, 2020; Alaska Population Projections.
Photography credit: Heather Holt
Southeast Alaska 2025 Economic Plan: April 2021 Prepared by Rain Coast Data Page 14ANNUAL EMPLOYMENT CHANGE BY SE COMMUNITY
Increasing Regional Jobs 2018 TO 2019 (Self-employment excluded)
2018 Annual 2019 Annual 2019 Employment
Jobs were generally up across the region in 2019, Community Average Average Wages in Change
growing by 445 jobs overall, for a gain of 1%. The Employment Employment millions 2018-2019
Alaska Department of Labor and Workforce Juneau Borough 17,732 17,952 $947.7 1.2%
Development, Research and Analysis Section tracks
wage and labor employment by community.
Ketchikan Borough 7,427 7,404 $359.8 -0.3%
According to these figures, just four communities in Sitka Borough 4,242 4,312 $208.6 1.7%
the region (Ketchikan, Wrangell, Metlakatla, and Prince of Wales 1,427 1,497 $63.9 4.9%
Gustavus) lost jobs in 2019, while all the rest
experienced gains. Metlakatla lost 11% of its
Petersburg Borough 1,246 1,282 $55.0 2.9%
workforce in 2019 over the previous year. Jobs in Skagway Borough 1,078 1,083 $46.5 0.5%
Klukwan increased by 24%. Haines Borough 1,006 1,029 $41.7 2.3%
This analysis excludes self-employment data, which is Wrangell Borough 850 824 $35.2 -3.1%
not made available below the borough/census area Metlakatla 568 505 $23.5 -11.1%
level. Still, tracking change in labor figures is a great
way to track overall workforce changes in a Hoonah SSA 385 431 $16.0 11.9%
community. Yakutat Borough 272 280 $13.2 2.9%
As demonstrated on page 6, while the detailed full Gustavus SSA 223 204 $9.1 -8.5%
community datasets for 2020 are not yet available, Kake 161 170 $5.4 5.6%
early data for the region as a whole project that Angoon SSA 148 154 $4.1 4.1%
Southeast lost 16% of all jobs in 2020.
Hyder 52 52 $2.9 0.0%
Klukwan 41 51 $0.9 24.4%
Source: Alaska Department of Labor and Workforce Development, Research and Analysis Section. Notes: The Hoonah sub-subarea (SSA) includes Pelican and
Elfin Cove. The Angoon SSA includes Tenakee Springs. Prince of Wales includes the Hollis SSA, Thorne Bay SSA and Hydaburg. An SSA is the smallest unit for
which the Quarterly Census of Employment and Wages is analyzed. Photo: John Hyde.
AMHS Ridership in Southeast Declining Ferry Service
One of the great tragedies of the COVID-19 pandemic
-49% for the regional economy, is that it came on top of the
State fiscal crisis, throughout which Southeast Alaska
268,335
262,931
253,554
254,437
2012 to
251,503
received a disproportionate level of jobs and service cuts.
249,310
240,666
237,965
242,940
Transportation connectivity, which has long been
242,648
2019
233,667
identified as the most vulnerable element of the regional
223,000
economy, had already been significantly reduced pre-
pandemic. The Alaska Marine Highway System (AMHS)
186,892
193,121
ferried 262,931 individuals in the region in 2012. By 2019,
179,312
that figure had dropped by 49%. Deferred and reduced
maintenance led to ships being removed from service. In
135,388
February 2020, the system shut down all but one ferry,
leaving some communities without access to groceries.
COVID-19 travel challenges came on top of these already
38,596
existing limitations, further reducing the number of
sailings and travelers. In 2020 as a whole, less than
39,000 passengers were able to travel on AMHS ferries in
the region.
2004
2005
2006
2007
2008
2009
2010
2011
2012
2013
2014
2015
2016
2017
2018
2019
2020
A strong ferry system is essential to regional economic
development, quality of life, and community well-being in
Southeast Alaska. The AMHS provides access to health
care, shuttles workers to their jobs, carries visitors,
connects markets and customers, and allows fishermen to
move seafood to markets. It moves freight, building
materials, and machinery to support local development. It
supports social and cultural connections, and is relied
upon for food security.
Source: AMHS
Southeast
Southeast Alaska
Alaska 2025
2025 Economic
Economic Plan:Plan: Released
Released April 2021
April 2021 Prepared by Rain
Prepared Coast
by Rain DataDataPage
Coast 15 15
PageYou can also read