Measuring Employment Generated by the Nuclear Power Sector - A Joint Report by the Nuclear Energy Agency and the International Atomic Energy Agency
←
→
Page content transcription
If your browser does not render page correctly, please read the page content below
A Joint Report by the Nuclear Energy Agency
and the International Atomic Energy Agency

                           Measuring Employment
                           Generated by the Nuclear
                           Power Sector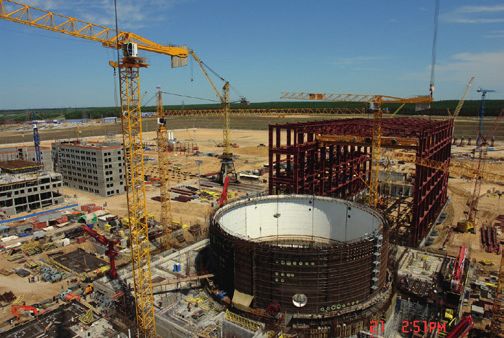
A Joint Report by the OECD Nuclear Energy Agency
and the International Atomic Energy Agency

            Measuring Employment Generated
              by the Nuclear Power Sector

                                 © OECD 2018
                                 NEA No. 7204

                       NUCLEAR ENERGY AGENCY
      ORGANISATION FOR ECONOMIC CO-OPERATION AND DEVELOPMENT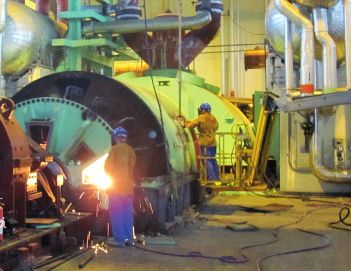
ORGANISATION FOR ECONOMIC CO-OPERATION AND DEVELOPMENT
The OECD is a unique forum where the governments of 36 democracies work together to address the
economic, social and environmental challenges of globalisation. The OECD is also at the forefront of efforts to
understand and to help governments respond to new developments and concerns, such as corporate
governance, the information economy and the challenges of an ageing population. The Organisation provides
a setting where governments can compare policy experiences, seek answers to common problems, identify
good practice and work to co-ordinate domestic and international policies.
The OECD member countries are: Australia, Austria, Belgium, Canada, Chile, the Czech Republic,
Denmark, Estonia, Finland, France, Germany, Greece, Hungary, Iceland, Ireland, Israel, Italy, Japan, Korea,
Latvia, Lithuania, Luxembourg, Mexico, the Netherlands, New Zealand, Norway, Poland, Portugal, the
Slovak Republic, Slovenia, Spain, Sweden, Switzerland, Turkey, the United Kingdom and the United States.
The European Commission takes part in the work of the OECD.
OECD Publishing disseminates widely the results of the Organisation’s statistics gathering and research
on economic, social and environmental issues, as well as the conventions, guidelines and standards agreed
by its members.
This Report has been prepared jointly by the OECD/NEA and the IAEA and its content does not necessarily reflect the views of the IAEA or
OECD respective Member States, or NEA Member Countries.
Extracts from the Report may be freely used elsewhere, provided that acknowledgement of the source is made. If any attribution in this
publication indicates that the information (including photographs and graphics) is from a source or site external to the OECD/NEA or the
IAEA permission for reuse must be sought from the originating source.
The use of particular designations of countries or territories does not imply any judgment by the OECD/NEA or the IAEA as to the legal
status of such countries or territories, or of the delimitation of their boundaries, or of their authorities and institutions. The Report, as well
as any data and map included herein, are without prejudice to the status or name of or sovereignty over any territory, city or area.
The mentioning of names of specific companies or products, whether or not indicated as registered, does not imply any intention to infringe
proprietary rights, nor should it be construed as an endorsement or recommendation on the part of the OECD/NEA or the IAEA.
The OECD/NEA and the IAEA assume no responsibility for the accuracy or continuing existence of URLs for external or third party Internet
websites referred to in this Report and do not guarantee that any content on such websites is, or will remain, accurate or appropriate.
NUCLEAR ENERGY AGENCY
The OECD Nuclear Energy Agency (NEA) was established on 1 February 1958. Current NEA membership
consists of 33 countries: Argentina, Australia, Austria, Belgium, Canada, the Czech Republic, Denmark,
Finland, France, Germany, Greece, Hungary, Iceland, Ireland, Italy, Japan, Korea, Luxembourg, Mexico, the
Netherlands, Norway, Poland, Portugal, Romania, Russia, the Slovak Republic, Slovenia, Spain, Sweden,
Switzerland, Turkey, the United Kingdom and the United States. The European Commission and the
International Atomic Energy Agency also take part in the work of the Agency.
The mission of the NEA is:
– to assist its member countries in maintaining and further developing, through international
co-operation, the scientific, technological and legal bases required for a safe, environmentally sound
and economical use of nuclear energy for peaceful purposes;
– to provide authoritative assessments and to forge common understandings on key issues as input to
government decisions on nuclear energy policy and to broader OECD analyses in areas such as
energy and the sustainable development of low-carbon economies.
Specific areas of competence of the NEA include the safety and regulation of nuclear activities,
radioactive waste management, radiological protection, nuclear science, economic and technical analyses of
the nuclear fuel cycle, nuclear law and liability, and public information. The NEA Data Bank provides nuclear
data and computer program services for participating countries.
This document, as well as any data and map included herein, are without prejudice to the status of or sovereignty over any territory,
to the delimitation of international frontiers and boundaries and to the name of any territory, city or area.
Corrigenda to OECD publications may be found online at: www.oecd.org/publishing/corrigenda.
© OECD 2018
You can copy, download or print OECD content for your own use, and you can include excerpts from OECD publications, databases and
multimedia products in your own documents, presentations, blogs, websites and teaching materials, provided that suitable
acknowledgement of the OECD as source and copyright owner is given. All requests for public or commercial use and translation rights
should be submitted to neapub@oecd-nea.org. Requests for permission to photocopy portions of this material for public or commercial use
shall be addressed directly to the Copyright Clearance Center (CCC) at info@copyright.com or the Centre français d'exploitation du droit de
copie (CFC) contact@cfcopies.com.
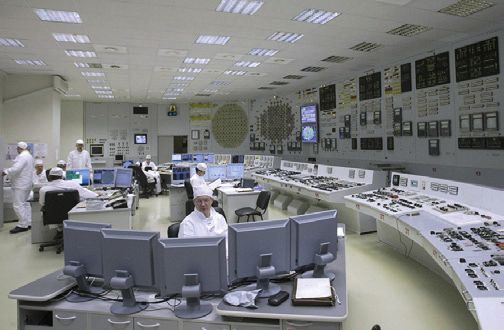
Cover photos: Unit 1 of the Novovoronezh nuclear power plant II (Hullernuc); Leningrad nuclear power plant (RIA Novosti); Dismantling of the
turbine at the Jose Cabrera nuclear power plant (Enresa).FOREWORD
Foreword
The contributions of the nuclear power sector in relation to employment have been studied
for many years by both the OECD Nuclear Energy Agency (NEA) and the International
Atomic Energy Agency (IAEA). The present publication has grown out of the activities
undertaken by these agencies. The NEA Division of Nuclear Technology Development and
Economics’ (NTE) 2013-2014 Programme of Work, for example, included work on the social
and economic impacts of nuclear power. The NEA Committee for Technical and Economic
Studies on Nuclear Energy Development and the Fuel Cycle (NDC) agreed that the NTE
would focus on the employment implications of nuclear new build, which had not been
examined in recent years although a related report, Nuclear Education and Training: From
Concern to Capability, was published in 2012 (NEA, 2012a).
In addition, from 2004 to 2009, the IAEA, in co-operation with Korean Hydro and
Nuclear Power (KHNP) and a team of experts from five Korean institutes, including the
Korean Atomic Energy Research Institute (KAERI), organised a series of studies to quantify
the benefits of nuclear technology for the Korean economy. This collaboration led to the
IAEA publication, Nuclear Technology and Economic Development in the Republic of Korea (IAEA,
2009a). The IAEA continued work on social and economic impacts in two consultancy
meetings entitled “Roadmap for Development of PESS Tools* and Methods for Economic
Impact Assessment of an NPP Programme” (17-19 December 2012) and “Macroeconomic
Impacts of a Nuclear Power Programme in Southeast Asia” (2-6 December 2013)
respectively. Following an increasing number of requests from member states in this
regard, the IAEA launched a co-ordinated research project “Assessing the National and
Regional Economic and Social Effects of Nuclear Programmes” (2014-2017). This latter
activity is intended to provide useful guidance to participating member countries on how to
develop and to apply quantitative tools for assessing economy-wide impacts of nuclear
programmes. The IAEA Milestones Approach – which was developed to assist countries
that are considering or planning their first nuclear power plant – suggests that
macroeconomic analyses should be conducted in addition to energy demand and energy
alternatives studies. An evaluation of the impacts of nuclear power on the national
economy, in particular on gross domestic product and employment, is explicitly
recommended in Milestones in the Development of a National Infrastructure for Nuclear Power
(IAEA, 2015).
To complete this task, economists from the NEA, the IAEA, the Nuclear Energy
Institute (NEI), KAERI, the Energy Policy Institute (Boise State University) and the Institute
of Energy Economics and the Rational Use of Energy (IER) prepared this report to aid
member countries in determining the employment impacts of the nuclear power sector
in their respective countries.
* PESS is the Planning and Economics Studies Section of the Department of Nuclear Energy at the
IAEA.
MEASURING EMPLOYMENT GENERATED BY THE NUCLEAR POWER SECTOR, NEA No. 7204, © OECD 2018 3ACKNOWLEDGEMENTS
Acknowledgements
The Nuclear Energy Agency (NEA) and the International Atomic Energy Agency (IAEA)
gratefully acknowledge the co-operation of the following organisations and individuals
for contributing to this report.
Victoria Alexeeva*+ IAEA, Vienna, Austria
Robert Beestermöller*+ University of Stuttgart, Germany
Geoffrey Black*+ Boise State University, Idaho, United States
David Bradish*+ Nuclear Energy Institute (NEI), United States
Ron Cameron+ NEA, Boulogne-Billancourt, France (to July 2014)
Irmak Colakoglu Ministry of Energy and Natural Resources, Turkey
Jannet Emeric+ AREVA, France
Man-ki Lee* Korean Atomic Energy Research Institute, Korea
Fedor Karmanov Rosatom Central Institute, Russia
Jan Horst Keppler+ NEA, Boulogne-Billancourt, France
PricewaterhouseCoopers Strategy Group (to December 2013)
Jeanne Lubek+ NERA Economic Consulting, Paris, France (from January
2014)
Brian Molloy+ IAEA, Vienna, Austria
Steven Peterson+ University of Idaho, United States
Geoffrey Rothwell*+ NEA, Boulogne-Billancourt, France
Maria Elena Urso NEA, Boulogne-Billancourt, France (to November 2014)
* contributors; + presenters.
4 MEASURING EMPLOYMENT GENERATED BY THE NUCLEAR POWER SECTOR, NEA No. 7204, © OECD 2018TABLE OF CONTENTS
Table of contents
List of abbreviations and acronyms ............................................................................................7
Executive summary ........................................................................................................................9
Chapter 1. Introduction to macroeconomic assessments of the nuclear
power sector ..............................................................................................................15
1.1. Macroeconomic modelling ................................................................................................16
1.2. “Input/output” and “computable general equilibrium” models ..................................18
1.3. Industrial classification systems ......................................................................................24
Chapter 2. Methodology: Input flows to the nuclear power sector .....................................27
2.1. Nuclear power plant construction (for example, years 0-9) .........................................27
2.2. Nuclear power plant operation (for example, years 10-60) ..........................................30
2.3. Nuclear power plant decommissioning (for example, years 61-70) ............................34
2.4. Spent nuclear fuel and waste management (for example, years 61-100) ...................34
2.5. Direct employment generated by a twin-unit nuclear power plant ...........................34
Chapter 3. Implementation: Estimated nuclear sector employment .................................37
3.1. Measuring nuclear power sector employment in the United States...........................37
3.2. Measuring nuclear power sector employment in Korea ...............................................38
3.3. Measuring nuclear power sector employment in France .............................................42
Chapter 4. Conclusions: Summary of recommendations .....................................................45
List of annexes
A. UN International Standard Industrial Classification (ISIC, Revision 4) ...........................47
B. Translating industrial classification systems .....................................................................51
C. Generation IV International Forum (GIF) Code of Accounts .............................................53
D. Nuclear power plant construction cost allocation to the North American
Industrial Classification System (NAICS) and to International Standard
Industrial Classification (ISIC) industries ............................................................................59
E. Independent spent fuel storage installation: organisational chart .................................79
F. References ................................................................................................................................85
List of figures
1.1. An input/output model ..........................................................................................................21
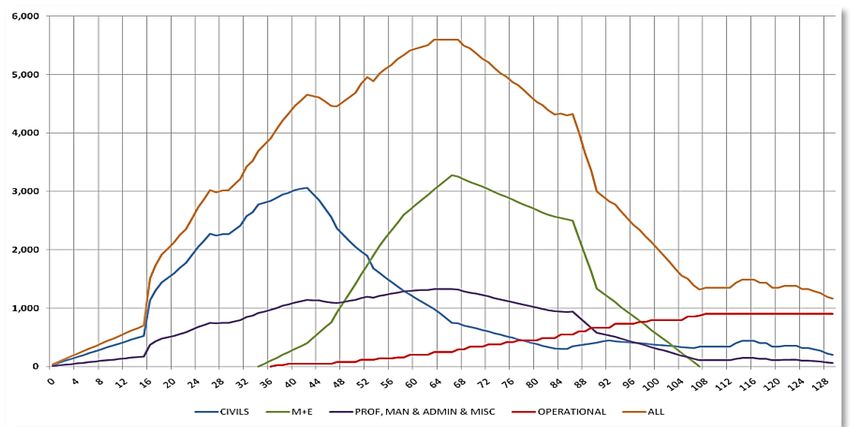
2.1. FTE labour force requirements at Hinkley Point C (twin EPRs) by quarter .....................29
3.1. Sectorial backward linkages in NPP construction (KRW 100 million, 2009) ...................40
3.2. Sectorial backward linkages in NPP operation (KRW 100 million, 2009) .........................40
3.3. Labour coefficients (employee/billion won) ........................................................................41
3.4. Korean employment from NPP construction in 2009 ........................................................42
3.5. Korean employment from NPP operation ...........................................................................42
E.1. Implicit organisational chart for a centralised spent nuclear fuel storage facility .......79
MEASURING EMPLOYMENT GENERATED BY THE NUCLEAR POWER SECTOR, NEA No. 7204, © OECD 2018 5TABLE OF CONTENTS
List of tables
1.1. Studies with an explicit assessment of a nuclear sector based on an I/O
framework (non-exhaustive) .................................................................................................17
1.2. CGE studies with an explicit assessment of the energy sector with nuclear
power (non-exhaustive) .........................................................................................................18
2.1. Decomposition of total construction investment costs (for an ABWR) ..........................28
2.2. PWR-12 (1 147 MWe) direct and first-order indirect labour in construction ..................30
2.3. US NPP employment during operation ................................................................................31
2.4. Largest annual operating expenditures for an average US nuclear plant ......................32
2.5. Fuel sector expenditures per year in USD2013.......................................................................32
2.6. Employment related to uranium production ......................................................................33
3.1. Thirty-eight sectors in the Korean nuclear power sector and national economy.........39
3.2. Korean direct, indirect and induced employment from the nuclear power sector ......41
D.1. PWR-12 cost breakdown using the GIF/EMWG COA .........................................................59
D.2. Translating PWR-12 GIF/EMWG COA cost breakdown into NAICS codes ......................70
D.3. PWR-12 cost breakdown into NAICS industries.................................................................76
D.4. PWR-12 cost breakdown into high-level NAICS industries ..............................................77
6 MEASURING EMPLOYMENT GENERATED BY THE NUCLEAR POWER SECTOR, NEA No. 7204, © OECD 2018LIST OF ABBREVIATIONS AND ACRONYMS
List of abbreviations and acronyms
AP1000 Westinghouse Advanced Passive PWR of approximately 1 100 MWe (net)
CES Constant elasticity of substitution
CGE Computable general equilibrium (models)
COA Code of Accounts
CRS Constant returns to scale
EMWG Economic Modeling Working Group (GIF)
FTE Full-time equivalent (annual)
GIF Generation IV International Forum
GM General manager
HVAC Heating, ventilation and air conditioning
IAEA International Atomic Energy Agency
I&C Instrumentation and controls
IMPLAN Impact Analysis for Planning (model)
I/O Input/output
ISIC International Standard Industrial Classification
M+E Mechanical and electrical
MWe Megawatts, electric
MWh Megawatt-hours
MTHM Metric tonnes of heavy metal
NAICS North American Industrial Classification System
NEA Nuclear Energy Agency
NEI Nuclear Energy Institute
NEWAGE National European Worldwide Applied General Equilibrium (model)
NPP Nuclear power plant
NSSS Nuclear steam supply system
MEASURING EMPLOYMENT GENERATED BY THE NUCLEAR POWER SECTOR, NEA No. 7204, © OECD 2018 7LIST OF ABBREVIATIONS AND ACRONYMS
OECD Organisation for Economic Co-operation and Development
PACE Policy Analysis based on Computable Equilibrium (model)
PESS IAEA Planning and Economic Studies Section
PWR Pressurised water reactor
QA Quality assurance
REMI Regional Economic Models, Inc.
SAM Social accounting matrix
SNF Spent (or used) nuclear fuel
T&D Transmission and distribution
TVA Tennessee Valley Authority
TMI Three Mile Island
US NRC US Nuclear Regulatory Commission
8 MEASURING EMPLOYMENT GENERATED BY THE NUCLEAR POWER SECTOR, NEA No. 7204, © OECD 2018EXECUTIVE SUMMARY
Executive summary
The nuclear energy sector employs a considerable workforce around the world, and with
nuclear power projected to grow in countries with increasing electricity demand,
corresponding jobs in the nuclear power sector will also grow (NEA/IAEA, 2016). The
Nuclear Energy Agency (NEA) and the International Atomic Energy Agency (IAEA) have
been collaborating on activities in relation to employment implications in the nuclear
power sector for many years, and the present publication has grown out of such activities.
The NEA Committee for Technical and Economic Studies on Nuclear Energy
Development and the Fuel Cycle (NDC), for example, agreed that the NEA Division of
Nuclear Technology Development and Economics (NTE) should focus on employment
implications of nuclear new build, a subject that had not been examined extensively in
recent years. From 2004 to 2009, the IAEA, in co-operation with the Korean Hydro and
Nuclear Power (KHNP) and with a team of experts from five Korean institutes, including
the Korean Atomic Energy Research Institute (KAERI), organised a series of studies to
quantify the benefits of nuclear technology for the Korean economy. This collaboration
led to the publication of Nuclear Technology and Economic Development in the Republic of Korea
(IAEA, 2009a). The IAEA continued its work on the social and economic impacts of nuclear
power, and following an increasing number of requests from member states, it launched
a co-ordinated research project “Assessing the National and Regional Economic and
Social Effects of Nuclear Programmes” (2014-2017). The latter activity is intended to
provide useful guidance to participating member states on how to develop and apply
quantitative tools for assessing the economy-wide impacts of nuclear programmes. The
IAEA Milestones Approach – which was developed to assist countries that are considering
or planning their first nuclear power plant – suggests conducting a macroeconomic
analysis in addition to energy demand and energy alternatives studies. An evaluation of
the impacts of nuclear power on a national economy, in particular on gross domestic
product and employment, is explicitly recommended in Milestones in the Development of a
National Infrastructure for Nuclear Power (IAEA, 2015).
This report generalises and simplifies the modelling efforts of the OECD member
countries (where macroeconomic models are generally available) to make them more
applicable to other economies, in particular, those of IAEA member states (where
macroeconomic models might be less developed). It reviews and compares macroeconomic
models that can be used to quantify employment effects generated by the nuclear sector
(Chapter 1). The discussion is largely based on publicly available quantitative country
studies. Though this report aims to provide an international view, the existing literature
exhibits bias in terms of country coverage (for example, many of the studies are from the
United States). After a detailed literature review, the report focuses on how to collect,
compile and prepare data needed for a macroeconomic analysis of employment generated
by the nuclear power sector (Chapter 2). Finally, it reviews and discusses case studies that
have been based on the application of the methodology (Chapter 3) recommended in
Chapter 4.
While it is hoped that this methodology can be used in modelling employment in
other forms of electricity generation, it does nonetheless focus on modelling employment
in the nuclear power sector where direct employment is defined as employment at
nuclear power plants under construction, or in the operation, decommissioning and
waste management phases; indirect employment is employment supplying products and
MEASURING EMPLOYMENT GENERATED BY THE NUCLEAR POWER SECTOR, NEA No. 7204, © OECD 2018 9EXECUTIVE SUMMARY
services to these activities at nuclear power plants; and induced employment in an
economy associated with direct and indirect plant and labour expenditures. Indirect and
induced employment must be calculated with a macroeconomic model of a particular
region or country. For policy analysis, total gross employment can then be compared to
the total gross employment of the “next best” alternative for generating electricity. The
difference yields the total net employment of investing in nuclear power capacity.
Given the deterministic nature of the parameters in most macroeconomic models,
error bands surrounding employment estimates do exist. Given that most direct
employment estimates are done with surveys, the error bands around direct employment
estimates are quite tight, for example, about ±10%. Because indirect employment is based
on the direct employment estimation, the error bands are necessarily larger, for example
about ±20%. Because induced employment is based on direct and indirect employment
estimates (or the associated parameters used to calculate these values), the error bands
related to induced employment are necessarily larger, for example about ±30%. Finally,
because most investments in electricity generation could be used for competing
technologies, net employment calculations (the difference between total direct plus indirect
plus induced employment for two electricity generating technologies) could have error
bands as high as ±50%. Decision makers should thus keep these error bands in mind
when evaluating employment estimates using macroeconomic models.
Several macroeconomic models are available. However, the most universally
available one has been the input/output (I/O) model based on I/O tables, as described by
the OECD Statistics Directorate. I/O models capture input (demand) and output (supply)
interrelationships between economic sectors in a geographic region. They also capture
the consumption of goods and services for final demand by these sectors and by the
household sector. The basic geographic region is a country, but model results can be
developed at regional levels. These results are particularly useful in examining the total
effects of an economic activity or of a change in the level of that activity. Typical
applications of these models, discussed in Chapter 3 for the United States, Korea and
France, include facility openings and closings and other public infrastructure
investments.
Because of these linkages, the influence of an economic activity in any sector or
geographic area on other sectors and areas can be modelled. These influences can extend
well beyond the sector and area in which the original economic activity is located. They
include not only the direct, or initial, effects of the economic activity, but also the
secondary, or “ripple” effects that flow from this activity. These ripple effects can be
categorised as first-order impacts (those effects on the immediate supply chain), second-
order impacts (those effects on the supply chains to the primary supply chain), etc. The
sum of the ripple effects beyond the first-order effects are referred to as “Nth-order”
impacts. Direct effects are analogous to the initial “impact” made by the economic
activity, and ripple effects are analogous to the subsequent “waves” of economic activity
(new employment, income, production and spending). A full accounting of the impact
should include all ripple effects. The sum of the direct and ripple (indirect and induced)
effects is called the total effect. Multipliers can be developed for any of the model outputs,
such as earned income, employment, industry output and total income.
Multipliers can also be developed for any industrial sector or geographic area
included in the model. Multipliers for a locality are smaller than for a larger area, such as
the region in which the locality is located, because some spending associated with an
economic activity flows from the smaller area into the larger area. At the local level,
multipliers are larger if the local area tends to produce the types of goods and services
that the nuclear power industry requires. Secondary effects include indirect and induced
effects, modelled separately within I/O models. Indirect effects are those influencing the
supply chain that feeds into the sector in which the economic activity is located. Induced
effects arise from purchases generated by revenues outside the supply chains, for
example in the housing sector.
10 MEASURING EMPLOYMENT GENERATED BY THE NUCLEAR POWER SECTOR, NEA No. 7204, © OECD 2018EXECUTIVE SUMMARY
While the purpose of this report is to help member country experts determine the
levels of inputs (particularly labour) flowing into the nuclear power sector, these inputs
depend on the state of development of the nuclear power sector in a particular economy.
This report recommends as a compromise between completeness and simplicity that the life
of a nuclear power plant be divided into four periods: i) construction, ii) operation,
iii) decommissioning, and iv) waste and spent nuclear fuel management. Direct employment
follows the logic of the levelised cost methodology. Because an I/O model assumes static
relationships between inputs and outputs, these relationships should be updated at least
every five years. I/O models should not be used for projections beyond the short term.
During construction, although flows to other industries in an economy change each
month and different types of labour with different levels of training change throughout
the construction period, expenditures are discounted to the end of construction (assumed
to be simultaneous with the start of operation and the output flow of electricity). These
expenditures are spread uniformly over the construction period, considered for simplicity
reasons to involve five years of site preparation and advanced procurement, and five
years from the pouring of base-mat concrete to commercial operation, meaning that
expenditures, (for example on labour, equal to hours times salaries or wages plus benefits)
are discounted and divided by ten years.
Further, while there are periods of refuelling and periods of refurbishment during
operation, expenditures on labour, maintenance supplies, equipment replacement,
insurance, taxes and capital are discounted to the start of operation and spread
uniformly over the operating life of the nuclear power plant, assumed to be 50 years
(again for simplicity reasons, even though this might involve the replacement of major
pieces of equipment for the plant to operate for a duration of 50 years).
In addition, after retirement of the nuclear power plant, there is a period of five years
of decommissioning planning and preparation, and five years of active decontamination,
dismantling and site restoration. There could also be 40 years of active waste
management starting with the retirement of the plant. At the end of this period, all
remaining long-lived radioactive waste is placed in geological repositories. However,
because repositories are so geologically site specific, they are not modelled here.
The first step in the modelling process is to map the expenditure data from a nuclear
power plant to the applicable codes used in the selected I/O model. This involves
converting expenditures, labour, profits and taxes into the applicable codes. For regional
analysis, the total spending in each category and the percentage of that spending in each
region are required. Different I/O tables have various definitions of industrial sectors. The
OECD tables use the International Standard Industrial Classification (ISIC) codes,
available from the United Nations (see Annex A). An alternative to the ISIC is the North
American Industrial Classification System, NAICS, following the implementation of the
North American Free Trade Agreement (NAFTA; see Annex B). In I/O tables based on ISIC
or NAICS, nuclear power generation is combined with all other forms of electricity
generation, transmission and distribution. This implies that the relevant I/O coefficients
describe the monetary amounts of all other industries that are expended in the entire
electricity sector, and the coefficient describes how much output of every other industry
is consumed as intermediate inputs in the production and consumption of electricity.
To analyse the flows between the nuclear power industry and all other industries,
this report recommends: i) that the nuclear power sector be separated as a distinct
industry; ii) that the nuclear power sector consist only of constructing, operating and
decommissioning nuclear power plants and the management of all waste forms, this
does not include supply chain industries; iii) that the homogeneous output (electricity) of the
nuclear power sector (other outputs, such as heat or medical radioisotopes are not
considered here) be sold as intermediate inputs either to the electricity or utility sector,
which transmits and distributes electricity to the remaining sectors or to all other sectors
in proportion to the amount of electricity consumed annually by each sector.
MEASURING EMPLOYMENT GENERATED BY THE NUCLEAR POWER SECTOR, NEA No. 7204, © OECD 2018 11EXECUTIVE SUMMARY
Total construction cost is equal to total overnight construction cost plus contingency
and financing costs. To measure these consistently, a set of standard definitions of
construction accounts, structures, equipment and personnel is presented in a Code of
Accounts (COA) system. This is an industry-standard cost-accounting framework for
allocating the direct and indirect costs of nuclear power plants, as well as for
comparisons of costs of these plants with fossil fuel plants. (In most COAs “indirect costs”
refer to costs that cannot be attributed to a specific direct cost category; these are not the
same as “indirect” costs in I/O models.) The cost estimates provided in the COA system
detail expenditures on materials and services for virtually all aspects of nuclear power
plant construction. As such, they can enter input-output models by assigning the
appropriate industry codes in the I/O model used. Annex C discusses the Generation IV
International Forum (GIF) Economic Modelling Working Group’s 2007 COA from the Cost
Estimating Guidelines for Generation IV Nuclear Energy Systems. Annex D provides an
example of the GIF-COA estimates for a four-loop pressurised water reactor (similar to
TVA’s Watts Bar units) allocated to NAICS industries. The analysis finds approximately
the same number of full-time equivalent jobs for this power reactor as reported for the
Westinghouse AP1000.
The results in Chapter 2 demonstrate that direct employment during site preparation
and construction of a single 1 000 MWe (net) advanced light water unit use about
12 000 labour-years during construction. For 50 years of operation, annually there are
approximately 600 administrative, operation and maintenance, and permanently
contracted staff, or about 30 000 direct labour-years during operation. For 10 years during
decommissioning, there are approximately 500 employees annually, or about 5 000 direct
labour-years. Finally, for 40 years, there are about 80 employees managing nuclear waste,
or about 3 000 direct labour-years; hence, about 50 000 direct labour-years. This does not
include labour expenditures in the supply chain. Direct expenditures on equipment from
the supply chain generate approximately the same number of indirect employment, or
about 50 000 indirect labour-years. Direct and indirect expenditures generate approximately
the same number of induced employment, or about 100 000 labour-years. Total lifetime
employment is about 200 000 labour-years, or about 400 million labour-hours (assuming
2 000 hours per employee per year).
Modelling total numbers of direct, indirect and induced employment for the
United States is discussed in Chapter 2, and in Chapter 3 for Korea and France. For
example, in Korea, the number of full-time equivalent jobs directly created by the nuclear
industry was estimated to be around 29 400 persons in 2009, which is divided between
i) 9 000 for the construction of four nuclear power units and ii) 20 400 for the operation of
20 units. Indirect employment (created through linkages) is about 36 700, equal to
9 400 attributable to the construction of nuclear power units and 27 300 attributable to
the operation of nuclear power plants. The number of jobs created through the induced
effects was estimated to be around 27 400, including 9 000 attributable to the nuclear
power plant construction supply chain and 18 400 attributable to nuclear power plant
operations. The (indirect/direct) multiplier was 1.25, yielding 36 700 indirect employees. The
([direct + indirect]/induced) multiplier was 0.41, yielding 27 400 indirect employees. Taking
into account these values, the total employment associated with the nuclear industry as
a whole was about 93 500 persons in 2009.
In comparison, in France direct employment has been estimated at 125 000 employees.
In 2009, there were 58 units in operation and 4 under construction (1 in France, 1 in Finland
and 2 in China). Indirect and induced employment was estimated by using multipliers
calculated (in February 2011) by the National Institute of Statistics and Economic Studies
(INSEE) using an I/O model. The (indirect/direct) multiplier was 0.912, yielding 114 000 indirect
employees. The [(direct)/induced] multiplier was 1.368, yielding 171 000 induced employees.
The total number of employees generated by the nuclear sector was estimated to be
410 000 persons.
12 MEASURING EMPLOYMENT GENERATED BY THE NUCLEAR POWER SECTOR, NEA No. 7204, © OECD 2018EXECUTIVE SUMMARY
Recommendations for measuring employment generated by the nuclear power sector
in specific countries are as follows:
• When attempting to estimate the employment impacts of existing or anticipated
nuclear power plants (in the construction, operation, decommissioning and waste
management sectors), identify the most transparent input/output model of the
country and work to adapt the model by creating a separate nuclear power sector,
as described in this report. One should be aware of the potential limitations of tools
and methods used in modelling. Consider to what extent, for example, the impacts
of stable electricity prices are included and evaluated. The results should be
interpreted in the context of model features and assumptions. Whenever possible,
estimate nuclear industry impacts at both national and regional (local) levels.
• Direct employment in the operation of commercial nuclear power plants consists
of those employees working at nuclear power plants, including permanent
subcontractors, such as security personnel and full-time equivalent outage
personnel. Indirect employment includes full-time equivalent personnel in the
nuclear supply chain (first-order indirect employees) and industries supplying
products and services to this supply chain (Nth-order indirect employees). Induced
employment is composed of all employment in the relevant economy generated by
direct and indirect expenditures.
• While direct employees can be determined through surveys of existing nuclear
power plants, estimates of (total) indirect and induced employees require the
specification of a macroeconomic model. Further, for policy analysis, total gross
employment should be compared to the total gross employment of the “next best”
alternative for generating electricity. The difference yields the total net
employment of investing in nuclear power. The “next best” alternative varies and
will usually be determined through the application of a multi-attribute analysis,
taking into account economics, energy security issues, and employment and
environmental impacts.
• When attempting to estimate the employment generated by the nuclear power
sector, one should pay particular attention to the consistency of the data used for
the modelling exercise. Generally, modelling requires the use of data from
different sources. Potential sources of inconsistency between I/O tables and
nuclear programme data should be eliminated, if possible; for example, by using
only annual data. Depending on data availability, uniform or actual distributions of
costs can be used. A uniform distribution provides an estimate of the average
impact over time; an actual distribution allows an assessment of differences in
economic impacts over time. The model should be tested by varying key
parameters to determine the sensitivity of the results with respect to changes in
assumed values. At the end of the exercise, modelling participants should suggest
additional techniques and data for future modelling efforts.
• Consistency should be verified across assumptions, for example, the consistency
between the financing structure and the level of local content. External financing
from the vendor or the vendor’s government will most likely be restricted to
financing imports from the vendor; the local content will more likely be financed
with funds from local sources. It is also probable that the greater the anticipated
local content, the lower the external financing available.
MEASURING EMPLOYMENT GENERATED BY THE NUCLEAR POWER SECTOR, NEA No. 7204, © OECD 2018 13INTRODUCTION TO MACROECONOMIC ASSESSMENTS OF THE NUCLEAR POWER SECTOR
Chapter 1. Introduction to macroeconomic assessments
of the nuclear power sector
The investments in a country’s energy system depend on macroeconomic aggregates, such
as real economic activity and costs of capital. Further, in small economies, in terms of gross
domestic product, nuclear investment and fuel costs can be large when compared to
macroeconomic aggregates. At the same time, energy investments tend to trickle down
into other sectors in the economy such as construction, manufacturing and services, thus
generating economic growth and creating new employment. Labour market effects are
known to be at the core of the impetus for local and regional economic growth. These
effects work primarily through the inter-sectoral linkages associated with construction,
operation and maintenance of power plants, and typically differ among technologies. In
this respect, it might be worth considering to what extent potential impacts from energy
policy strategies and investments on a country’s overall goals for macroeconomic
development, including employment creation, might support or discourage the adoption of
a particular technology.
The Nuclear Energy Agency (NEA) has been assisting its member countries, and the
International Atomic Energy Agency (IAEA) has been assisting its member states in
evaluating alternative strategies for the development of the electricity sector and the role
that nuclear power might potentially play in meeting future electricity demand.
Quantitative methods can assist policy makers in analysing those impacts and in making
informed decisions in the choice of the most appropriate electricity technologies. For this
purpose, the IAEA and NEA have developed a set of models and guidelines to provide
systematic frameworks for analysing various issues in the context of the electricity
capacity expansion decision-making process, for example IAEA (2009b) and NEA (2012b).
The existing IAEA modelling tools belong to the class of partial equilibrium models
that are characterised by a detailed representation of the energy (electricity) sector.
Partial equilibrium modelling is a widely used tool to provide an assessment of
alternative paths for the development of the electricity sector to meet the future demand
in a given country. As a common practice, however, interrelationships with other sectors
in the economy are disregarded in partial equilibrium models. Potentially important
benefits or detriments are not captured in models when comparing costs only. To fill this
gap, the current document provides an overview of methods for assessing the
employment creation potential of a nuclear power plant (NPP) programme in the national
economy beyond the electricity sector.
The current report reviews and compares macroeconomic models that can be used to
quantify employment effects generated by the nuclear sector (Chapter 1). This discussion
is largely based on publicly available quantitative country studies. Though the report
aims to provide an international view, the existing literature exhibits bias in terms of
country-coverage (for example, many of the studies are from the United States). After a
detailed literature review, the report focuses on how to collect, compile and prepare data
needed for a macroeconomic analysis of employment generated by the nuclear power
sector (Chapter 2). Finally, the report reviews and discusses case studies that have been
based on the application of the methodology (Chapter 3) recommended in Chapter 4.
MEASURING EMPLOYMENT GENERATED BY THE NUCLEAR POWER SECTOR, NEA No. 7204, © OECD 2018 15INTRODUCTION TO MACROECONOMIC ASSESSMENTS OF THE NUCLEAR POWER SECTOR
1.1. Macroeconomic modelling
The model archetypes analysed in this section encompass traditional input/output (I/O)
models, computable general equilibrium (CGE) models, and integrated econometric I/O –
see NEI (2014b) that used the Regional Economic Models, Inc. Policy Insight Plus, and
Section 3.1. The main virtue of these quantitative tools is to simulate consistently the
linkages within an economy and the ability to measure the impacts of policy options and
investment decisions.
The outcome of the literature review from publicly available sources is summarised
in Tables 1.1 and 1.2. (For a literature review of employment generation in renewables
and energy efficiency, see UKERC, 2014). This section focuses explicitly on the application
of different models related to the assessment of economic activities and sub-activities in
the nuclear sector such as NPP construction, operation, decommissioning and waste
management. In this narrow context, three model types have been identified: I/O models,
CGE models and integrated econometric I/O models. However, the CGE models mainly
focus on nuclear phase-out, whereas I/O models deal with all economic activities and
sub-activities except the nuclear phase-out. Integrated econometric I/O models appear to
be less common, an outcome that might be partly explained by the large amount of data
required for such a model.
The great popularity of I/O models is reflected in many papers dealing with an
economic impact assessment in the nuclear sector. This section focuses explicitly on
application of the I/O models related to the assessment of economic activities and sub-
activities in the nuclear sector such as uranium mining and milling, construction,
operation and others. The literature review summarised in Table 1.1 gives a non-
exhaustive list of examples for I/O model application in this context rather than defining
its limits. Major observations from the literature review can be summarised as such:
• Most of the reviewed studies provide an ex-post analysis of introducing NPPs (IAEA,
2009a; NEI, 2003, 2004a, 2014a). Only a small fraction deals with an ex-ante analysis
(future introduction of economic activities in a nuclear sector). For example,
Anindita (2007) and WorleyParsons (2011) undertake an ex-ante assessment of an
NPP for Indonesia and Jordan, respectively.
• In terms of coverage of economic activities within the nuclear power sector, the
common practice is to calculate sectorial and aggregate output, value added and
employment effects from plant construction, operation, or from both phases.
Other related economic activities are typically not included. Timilsina et al. (2008)
is an exception. It focuses on four sub-activities: i) uranium mining and milling,
ii) construction, iii) operation and maintenance, and iv) exports of uranium. ERA
(2014) considers uranium mining only.
• In most studies, households are assumed endogenous components of the
economy, with an I/O matrix being extended to include a household sector. Such
model extensions allow accounting not only for direct and indirect changes in
industry production levels as a result of an initial stimulus to final demand, but
also for the related income changes (IAEA, 2009a; Timilsina et al., 2008; Solan et
al., 2010).
• In some cases, a sequence of I/O tables is employed to study both local and
economy-wide impacts, with local implications being approximated by additional
calculations. A few studies build upon the regionally disaggregated data that
allows for the analysis of both local and economy-wide impacts within a
consistent framework (NEI, 2004b, 2006a, 2006b, 2013).
16 MEASURING EMPLOYMENT GENERATED BY THE NUCLEAR POWER SECTOR, NEA No. 7204, © OECD 2018INTRODUCTION TO MACROECONOMIC ASSESSMENTS OF THE NUCLEAR POWER SECTOR
Table 1.1. Studies with an explicit assessment of a nuclear sector
based on an I/O framework (non-exhaustive)
Economic activities
and related sub-activities
Exports of nuclear
enrichment plants
Uranium mining
Region
Recycling and
Operation and
Construction
maintenance
Study (year) Model*
technology
Exports of
(sorted by)
uranium
Anindita (2007) x Not identified Indonesia
Applied Economics (2010) x x IMPLAN United States
ERA (2014) x Not identified Australia
IAEA (2009a) x x Not identified Korea
Lesser (2011) x IMPLAN United States
Mayeda and Riener (2013) x IMPLAN United States
NEI (2003) x IMPLAN United States
NEI (2004a) x IMPLAN United States
NEI (2004b) x IMPLAN United States
NEI (2006a) x IMPLAN United States
NEI (2006b) x IMPLAN United States
NEI (2014a) x IMPLAN United States
Oxford Economics (2008) x x x Not identified United States
Oxford Economics (2013) x Not identified United Kingdom
PWC (2011)** x x Not identified France
PWC (2012)** x Not identified Belgium
Solan et al. (2010) x x IMPLAN United States
Timilsina et al. (2008) x x x x x Not identified Canada
WorleyParsons (2011) x x Not identified Jordan
* IMPLAN = Impact Analysis for Planning.
** Both studies consider additional sectors not covered here (e.g. medical, industrial applications).
MEASURING EMPLOYMENT GENERATED BY THE NUCLEAR POWER SECTOR, NEA No. 7204, © OECD 2018 17INTRODUCTION TO MACROECONOMIC ASSESSMENTS OF THE NUCLEAR POWER SECTOR
Table 1.2. CGE studies with an explicit assessment of the energy sector
with nuclear power (non-exhaustive)
Study (year) Topic of a study Model Regions
Aydın (2011) Nuclear and hydro Not identified Turkey
Nuclear breakthrough (decrease specific
Biesl, Ellerdorfer and Fahl (2006) NEWAGE-W Global
investment costs) and nuclear phase-out
Böhringer, Wickart and Mueller (2003) Nuclear phase-out Not Identified Switzerland
Bretschger, Ramer and Zhang (2012) Nuclear phase-out CITE Switzerland
Galinis and van Leeuwen (2000) Nuclear investments and phase-out Not Identified Lithuania
Itakura (2011) Nuclear phase-out GTAP Japan
Kobayashi, Ochiai and Tachi (2011) Nuclear phase-out JCER Japan
Konovalchuk (2006) Chernobyl accident Not identified Ukraine
OECD, China
Magné, Chateau and Dellink (2014) Nuclear phase-out ENVLinkages
and Russia
Mukaida, Shiotani, Ono, and Namba (2013) Fast reactor and related fuel cycle system STAP-E, DN21 Japan
Okuno, Fujii and Komiyama (2012) Nuclear phase-out GTAP Japan
Yamazaki and Takeda (2013) Nuclear phase-out Not identified Japan
Models: ENVLinkages – an OECD dynamic CGE model with environmental linkages; GTAP – Global Trade Analysis
Project; GTAP-E – an energy-environmental version of the GTAP; DNE21 – Dynamic New Earth 21; JCER – Japan
Center for Economic Research; LEAN-TCM – a CGE model of Germany and much of the rest of the EU, from
German; NEWAGE-W – National European Worldwide Applied General Equilibrium with a dynamic multi-regional,
multi-sectoral world; PACE – Policy Analysis based on Computable Equilibrium, CITE – Computable Induced
Technical Change and Energy.
1.2. “Input/output” and “computable general equilibrium” models
From 2004 to 2009, the IAEA co-operated with a Korean team of experts from five Korean
institutes: the Korean Atomic Energy Research Institute, the Korea Institute of Nuclear
Safety, Kyungbuk National University, Korean Energy Economics Institute and Daegu-
Gyeongbuk Development Institute. This collaboration led to the publication of Nuclear
Technology and Economic Development in the Republic of Korea (IAEA, 2009a).
This document generalises and simplifies this modelling effort to make it more
applicable to other economies, in particular, those of the OECD member countries (where
macroeconomic models are generally available) and IAEA member states (where
macroeconomic models might be less developed). While it is hoped that this methodology
can be used in modelling employment in other forms of electricity generation, it
nonetheless focuses on modelling the nuclear power sector where direct employment is
defined as employment at NPPs in construction, operation, decommissioning and waste
management; indirect employment is employment supplying products and services to these
activities at NPPs; and induced employment in an economy associated with direct and
indirect plant and labour expenditures. Indirect and induced employment must be calculated
with a macroeconomic model of a particular region or country. For policy analysis, total
gross employment can then be compared to the total gross employment of the “next best”
alternative for generating electricity. The difference yields the total net employment of
investing in nuclear power capacity. On definitions of direct, indirect and induced
employment in the literature, see IAEA (2009a).
18 MEASURING EMPLOYMENT GENERATED BY THE NUCLEAR POWER SECTOR, NEA No. 7204, © OECD 2018INTRODUCTION TO MACROECONOMIC ASSESSMENTS OF THE NUCLEAR POWER SECTOR
Given the deterministic nature of the parameters in most macroeconomic models,
there are error bands surrounding employment estimates. Given that most direct
employment estimates are done with surveys, the error bands around direct employment
estimates are quite tight, for example, about ±10%. Because indirect employment, as
estimated by the model, is based on the direct employment estimation, the error bands are
necessarily larger, for example about ±20%. Because induced employment, as estimated by
the model, is based on direct and indirect employment estimates (or the associated
parameters used to calculate these values), the error bands on induced employment are
necessarily larger, for example about ±30%. Finally, because most investments in electricity
generation could be used for competing technologies, net employment calculations (the
difference between total direct plus indirect plus induced employment for two electricity
generating technologies) could have error bands as high as ±50%. Decision makers should
keep these error bands in mind when evaluating employment estimates using
macroeconomic models. (On these error bands, see Cameron and van der Zwaan, 2015.)
There are several available macroeconomic models (including computable general
equilibrium, CGE, models). However, the most universally available one has been the
I/O model based on I/O tables, as described by the Statistics Directorate of the OECD
(www.oecd.org/trade/input-outputtables.htm) – see Figure 1.1. Although various currencies
could be used in I/O models, this document uses (real) 2013 US dollars (USD2013). Note for
more information on I/O models and solving them, see Annex I in IAEA (2009a).
I/O models capture input (demand) and output (supply) interrelationships between
economic sectors in a geographic region. They also capture the consumption of goods
and services for final demand by these sectors and by the household sector. The basic
geographic region is a country, but model results can be developed at regional levels.
These results are particularly useful in examining the total effects of an economic activity
or of a change in the level of that activity. I/O models are typically used to answer the
following questions: i) How much spending does an economic activity (such as at an
electricity generating plant) bring to a local, regional or national area? ii) How much
income is generated for businesses and households? iii) How many jobs does this activity
support? iv) How much tax revenue is generated by this activity? These models also are
useful in addressing related questions, such as the geographic and industry distribution
of economic and fiscal impacts. Typical applications of these models include facility
openings and closings, and transport or other public infrastructure investments.
Because of these linkages, the influence of an economic activity in any sector or
geographic area on other sectors and areas can be modelled. These influences can extend
well beyond the sector and area in which the original economic activity is located. They
include not only the direct, or initial, effects of the economic activity, but also the
secondary, or “ripple” effects that flow from this activity. These ripple effects can be
categorised as first-order impacts (those effects on the immediate supply chain), second-
order impacts (those effects on the supply chains to the primary supply chain), etc. The
sum of the ripple effects beyond the first-order effects are referred to as “Nth-order”
impacts. Direct effects are analogous to the initial “impact” made by the economic
activity, and ripple effects are analogous to the subsequent “waves” of economic activity
(new employment, income, production and spending). A full accounting of the impact
should include all the ripple effects. The sum of the direct and ripple (indirect and induced)
effects is called the total effect. Multipliers can be developed for any of the model outputs,
such as earned income, employment, industry output and total income.
Multipliers can also be developed for any industrial sector or geographic area
included in the model. Multipliers for a locality are smaller than for a larger area, such as
the region in which the locality is located, because some spending associated with an
economic activity flows from the smaller area into the larger area. At the local level,
multipliers are larger if the local area tends to produce the types of goods and services
that the nuclear power industry requires. Secondary effects include indirect and induced
effects, modelled separately within I/O models. Indirect effects are those influencing the
MEASURING EMPLOYMENT GENERATED BY THE NUCLEAR POWER SECTOR, NEA No. 7204, © OECD 2018 19INTRODUCTION TO MACROECONOMIC ASSESSMENTS OF THE NUCLEAR POWER SECTOR
supply chain that feeds into the sector in which the economic activity is located. Induced
effects arise from purchases generated by revenues outside the supply chains, for
example in the housing sector.
I/O tables (see, for example, the Xij matrix in the third column and third row of
Figure 1.1) describe the sale and purchase relationships between producers and
consumers within an economy. They can be produced by illustrating flows between the
sales and (final and intermediate) purchases of industry outputs, as reflected in the OECD
I/O database. This approach reflects the collection mechanisms for many other data
sources such as employment statistics, which are primarily collected by employers. The
latest set of OECD I/O tables includes matrices of inter-industrial flows of transactions of
goods and services (domestically produced and imported) in current prices, for all OECD
countries (except Iceland) and 15 non-member countries, covering the years 1995, 2000,
2005 and later years for some countries. Using a standard industry list based on the
International Standard Industrial Classification (ISIC), comparisons can be made across
countries, see Annex A. Further information for each country and the estimation
methodology is available in Yamano and Ahmad (2006). In many cases, national
statistical offices compile national I/O tables. Other sources of recent I/O tables can be
found in the World Input-Output Database (WIOD), a database covering 27 EU member
states and 13 other major countries for 1995 to 2011 (www.wiod.org/database/wiots13).
In the I/O table each row placed in the transactions among producers represents an
industry from which inputs are sold to industries listed in each column. This creates a
matrix in which each cell defines the monetary amount of each industry’s input that is
consumed by the industry itself and all other industries. I/O models assume there is a
fixed relation between intermediate inputs and gross output (=gross input), say, aij = Xij/Xj.
In Figure 1.1, the I/O table is represented by the matrix of Xij (=aij Xj) where the index i in aij
represents the intermediate input produced by industry i to produce one unit of
commodity j. For example, if industry μ is the uranium sector and if industry η is the
nuclear power generating industry, then aμ,η is the dollar amount of uranium required to
produce a dollar of electricity by an NPP, and a η, μ is the dollar amount of electricity (from
the nuclear power sector, although it could be from the power sector more generally) to
produce a dollar of uranium. In Figure 1.1, sum of the Xij over j is equal to Wi, which is
consumed by other industries. The remaining gross output of industry i, which is not
consumed by industries, is consumed in final demand, Fi, including the household sector,
Ci, the investment sector Ii, the export sector, Ei. As imported commodities, Mi, are
included in Wi and Fi, an equation is hold as follows: Wi + Fi – Mi = Xi. At the same time,
the sum of the Xij over i is equal to Uj, that is, total intermediate inputs to industry j, to
which the value added sectors of employees, Rj, businesses including capital, Sj,
depreciation, Dj, and indirect taxes, Tj are added finally arriving at an equation as follows:
Uj + Vj = Xj.
Further, because this document is associated with measuring employment in the
nuclear power sector, if the I/O table does not include a “household” sector, this sector
must be added. For example, in the regional study in IAEA (2009a) to calculate the
economic and social impacts of Ulchin NPP (see www.nti.org/facilities/6) in the
surrounding region a household sector was added; see Annex III, “Calculation of Location
Coefficients,” in IAEA (2009a). This yields a closed model: “Closing the model with respect
to households moves the household sector from the final demand column and places it
inside the technically interrelated table of productive sectors” (IAEA, 2009a: 111). In
particular, Annex II explains:
The household employment effect translates the impacts of final demand
spending changes into changes in employment in physical terms. Although this
study does not address or calculate this induced household employment effect for
an NPP, it may be of interest subsequently or to others and so is explained here.
This effect can be calculated by converting the output effects into the number of
employees hired, by using physical labour input coefficients (IAEA, 2009a: 118)
20 MEASURING EMPLOYMENT GENERATED BY THE NUCLEAR POWER SECTOR, NEA No. 7204, © OECD 2018You can also read


