PENNSYLVANIA ELECTRIC VEHICLE ROADMAP - Prepared for the Pennsylvania Department of Environmental Protection - PA DEP
←
→
Page content transcription
If your browser does not render page correctly, please read the page content below
PENNSYLVANIA
ELECTRIC VEHICLE
   ROADMAP

Prepared for the Pennsylvania Department of
         Environmental Protection
                 February 2019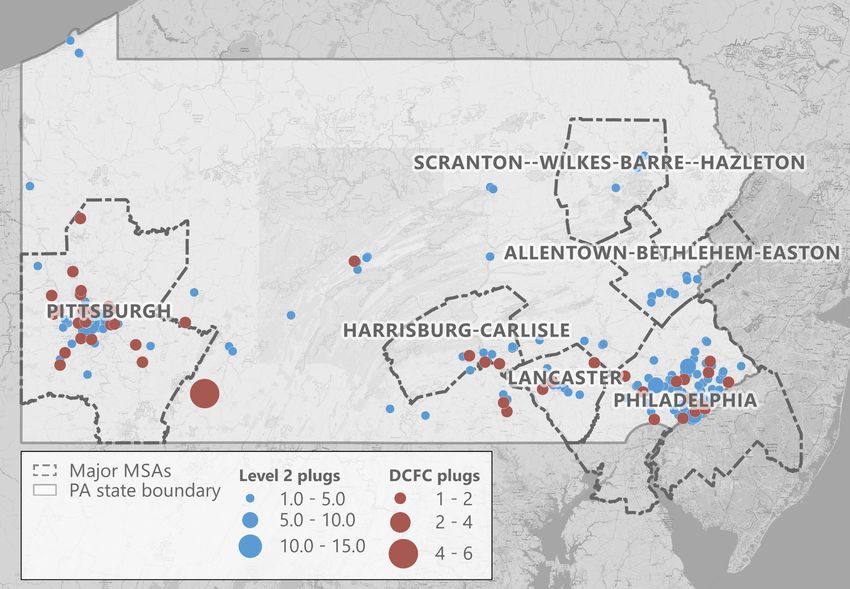
PENNSYLVANIA
        ELECTRIC VEHICLE
           ROADMAP

Technical support from:

    Meister Consultants Group | A Cadmus Company

    Yborra and Associates

    Volpe National Transportation Systems Center
ACKNOWLEDGEMENTS
This material is based upon work supported by the Department of Energy, Office of Energy Efficiency and Renewable
Energy (EERE), under the State Energy Program Award Number DE-EE0006994 through contract from the
Pennsylvania Department of Environmental Protection. Disclaimer: This report was prepared as an account of work
sponsored by an agency of the United States Government. Neither the United States Government nor any agency
thereof, nor any of their employees, makes any warranty, express or implied, or assumes any legal liability or
responsibility for the accuracy, completeness, or usefulness of any information, apparatus, product, or process
disclosed, or represents that its use would not infringe privately owned rights. Reference herein to any specific
commercial product, process, or service by trade name, trademark, manufacturer, or otherwise does not necessarily
constitute or imply its endorsement, recommendation, or favoring by the United States Government or any agency
thereof. The views and opinions of authors expressed herein do not necessarily state or reflect those of the United
States Government or any agency thereof.

SUPERVISION AND COORDINATION
Mark Hand, Pennsylvania Department of Environmental Protection

LEAD AUTHORS
Kelly Blynn, Meister Consultants Group, A Cadmus Company
Erin Camp, Meister Consultants Group, A Cadmus Company

CONTRIBUTING AUTHORS
Neil Veilleux, Meister Consultants Group, A Cadmus Company
Ryan Cook, Meister Consultants Group, A Cadmus Company
Philip Kreycik, Meister Consultants Group, A Cadmus Company
Stephe Yborra, Yborra & Associates
Coralie Cooper, Volpe National Transportation Systems Center, U.S. Department of Transportation
Alexander Epstein, Volpe National Transportation Systems Center, U.S. Department of Transportation

                                                                                                         P a g e | ii
DRIVE ELECTRIC PENNSYLVANIA COALITION MEMBER
 ORGANIZATIONS
Borough of Bellefonte                          PECO
BMW                                            PA Dept. of Community and Economic Development
Chapman Auto Group                             PA Dept. of Conservation and Natural Resources
ChargEVC                                       PA Dept. of Environmental Protection
Charge Forward, LLC                            PA Dept. of Transportation
ChargePoint                                    PA Dept. of General Services
City of Philadelphia                           Pennsylvania Environmental Council
City of Pittsburgh                             Pennsylvania Governor’s Office
Clean Air Board                                Pennsylvania Public Utility Commission
Delaware Valley Regional Planning Commission   Pennsylvania Office of Small Business Administration
Duquesne Light Company                         Pennsylvania Sierra Club
Eastern PA Advanced Clean Transportation       Pennsylvania Turnpike Commission
Envision Solar                                 Philadelphia Parking Authority
First Energy                                   Pittsburgh Region Clean Cities
First Priority Global                          Plug In America
Ford                                           Plug Share
General Motors                                 PPL
Georgetown Climate Center                      REACH Strategies
Greenlots                                      Seedling LLC
Lion Electric Company                          SEPTA
National Drive Electric Week                   Tesla
Natural Resources Defense Council              University of Pennsylvania
Nissan                                         University of Pittsburgh
Park to Spark                                  US Department of Energy
Partnerships One                               Vermont Energy Investment Corp

                                                                                         P a g e | iii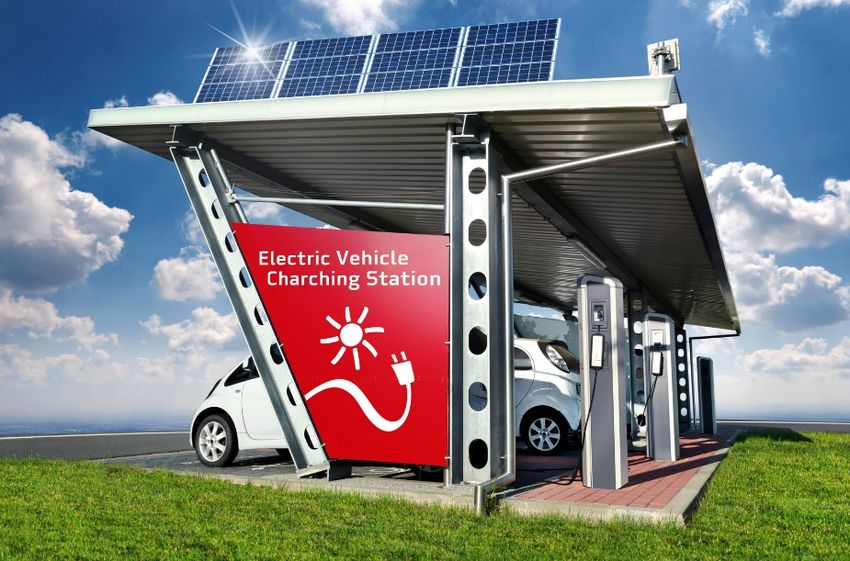
CONTENTS
Executive Summary ..................................................................................................................................................................... x
Roadmap Glossary .................................................................................................................................................................... xiii
SECTION 1               Introduction .........................................................................................................................................................1
    1.1         The Need for Electric Vehicle Deployment Nationwide and in Pennsylvania .........................................1
    1.2         Roadmap Overview and Purpose ......................................................................................................................... 6
SECTION 2               State of the EV Market in Pennsylvania..................................................................................................... 8
    2.1         EV and EVSE Deployment in Pennsylvania ........................................................................................................ 8
    2.2         Barriers to EV Deployment in Pennsylvania .................................................................................................... 21
SECTION 3               Next Generation EV Strategies .................................................................................................................. 24
    3.1         EV Deployment Strategy Categories ................................................................................................................ 24
    3.2         Near-term Strategies for EV Deployment in PennsylvaniA (0-2 yrs) ..................................................... 29
    3.3         Medium-term Strategies for EV Deployment in Pennsylvania (2-5 yrs) ................................................37
    3.4         Long-term Strategies for EV Deployment in Pennsylvania (5+ yrs)........................................................ 41
    3.5         Summary.................................................................................................................................................................... 43
SECTION 4               Pennsylvania EV Market Penetration Scenario Modeling ................................................................ 46
    4.1         Motivation and Methods of Scenario Modeling .......................................................................................... 46
    4.2         Scenario Modeling Results .................................................................................................................................. 54
SECTION 5               Conclusions and Next Steps ...................................................................................................................... 64
    5.1         Summary of the Benefits of Proactive EV Policy Action for Pennsylvania ........................................... 64
    5.2         Priority Actions for Pennsylvania’s EV Market ............................................................................................... 64

                                                                                                                                                                             P a g e | iv
FIGURES
Figure 1: Scenario modeling of projected EV sales shares, 2017-2035 ..................................................................... xii
Figure 2: 2013 Pennsylvania Gross Greenhouse Gas Emissions by Sector ................................................................ 2
Figure 3: Historical and projected electricity grid mix in PA (Source: EIA) ................................................................ 3
Figure 4: PA Greenhouse gas and criteria pollutant electricity emissions intensity, 1990-2016 ......................... 4
Figure 5: Registered vehicles in PA by vehicle type .......................................................................................................... 8
Figure 6: Market share of Zero Emission Vehicles in Pennsylvania, 2013-2017 (left) and Annual
sales of Zero Emission Vehicles in Pennsylvania, 2011-2017 (right) .......................................................... 9
Figure 7: EV sales share by state in 2017 ............................................................................................................................ 10
Figure 8: Registered EVs in Pennsylvania (2018 PennDOT data processed by DVRPC) ..................................... 12
Figure 9: PA EV fleet deployments, 2011-2017 .................................................................................................................. 14
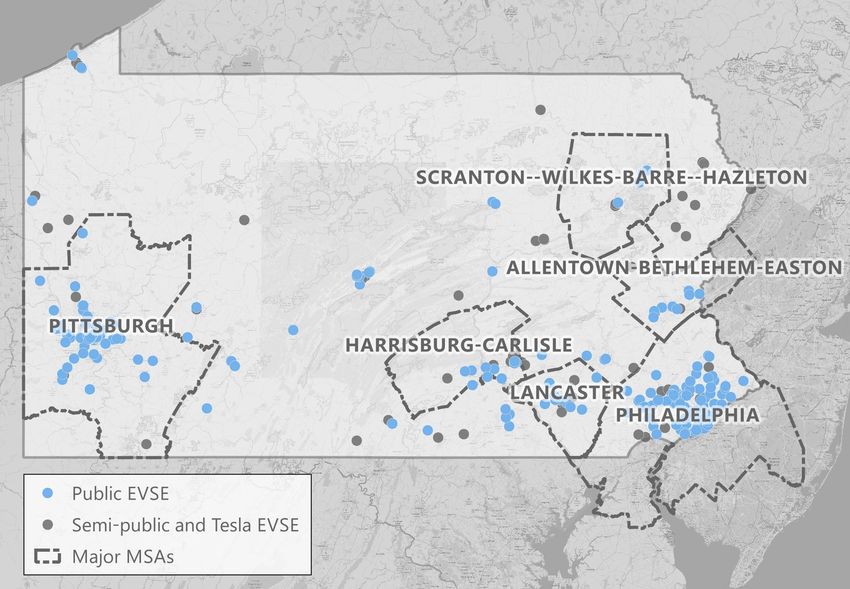
Figure 10: Map of public EV charging stations in Pennsylvania, as of 2/21/2018 (Source: AFDC.gov) ........... 18
Figure 11: Map of public, semi-public, and Tesla EVSE in Pennsylvania, as of 2/21/2018 ................................... 19
Figure 12: Scenario modeling of projected EV sales shares, 2017-2035 ..................................................................54
Figure 13: Illustration of fleet penetration lagging sales – Scenario 4: High policy, high technology ........... 55
Figure 14: Groupings of vehicles in the fleet model ....................................................................................................... 71
TABLES
Table 1: Timeline of recommended strategies to support EV adoption in Pennsylvania .................................... xi
Table 2: Vehicle types and available BEV and PHEV models ......................................................................................... 9
Table 3: 2017 Regional distribution of registered EVs in Pennsylvania (Source: DVRPC and
PennDOT) ................................................................................................................................................................... 11
Table 4: Fleet vehicle electrification potential in Pennsylvania (Source: PennDOT)............................................. 13
Table 5: Pennsylvania electric fleet vehicle deployment highlights to date ........................................................... 15
Table 6: Publicly listed EVSE in Pennsylvania, as of 2/21/18 (Source: AFDC.gov) .................................................. 17
Table 7: Regional distribution of public EVSE plugs in Pennsylvania (Source: AFDC.gov)................................. 17
Table 8: Benchmarking EVSE per capita and per BEV (Sources: AFDC, PennDOT) .............................................. 20
Table 9: Estimated charge plugs needed by vehicle type and location per 1,000 EVs ....................................... 21
Table 10: Summary of EV market barriers .......................................................................................................................... 23
Table 11: AFIG rebates July 1, 2016-June 30, 2017 ............................................................................................................ 25
Table 12: Summary of Pennsylvania initiatives to support EVs to date .................................................................... 28
Table 13: Summary of Pennsylvania EV roadmap strategies by policy category ..................................................45
Table 14: EV deployment scenarios modeled ................................................................................................................... 47
Table 15: Low- and high-technology scenario summary ..............................................................................................49
Table 16: Low and high policy scenario summary ........................................................................................................... 50
Table 17: EVSE per 1,000 EV ratios used in BCA modeling analysis ........................................................................... 51
Table 18: Percent EV of total light duty sales by scenario and horizon year .......................................................... 55
Table 19: EV percent of total light duty fleet by scenario and horizon year ........................................................... 56
Page | v
Table 20: Projected EVs on the road in Pennsylvania by scenario and horizon year .......................................... 56
Table 21: Electric vehicle miles traveled as a share of total fleet vehicle miles traveled by scenario
           and horizon year ..................................................................................................................................................... 56
Table 22: Energy impacts by scenario and horizon year .............................................................................................. 57
Table 23: Electricity consumption from EVs as share of 2016 Pennsylvania electricity consumption ............ 57
Table 24: Light-duty vehicle greenhouse gas emissions by scenario and horizon year (well-to-
           wheels, million metric tons) ................................................................................................................................. 58
Table 25: Criteria pollutant emissions by scenario and horizon year (vehicle operation only,
           million lbs.) ................................................................................................................................................................ 59
Table 26: Social and environmental impacts costs by scenario and horizon year ............................................... 60
Table 27: Benefit-cost analysis ratio results for each scenario in each horizon year* ......................................... 62
Table 28: Benefit-cost analysis results: absolute costs, absolute benefits, and net benefits for each
           scenario in 2033 (listed in Million $) ................................................................................................................. 63
Table 29: Timeline of recommended strategies to support EV adoption in Pennsylvania. ............................... 65
Table 30: Highlights from other state EV roadmaps ...................................................................................................... 67
Table 31: Summary of Utility Cost Tests for EV Benefit-Cost Analysis ...................................................................... 72
Table 32: EVSE plugs per 1,000 EV ratios used in BCA modeling analysis .............................................................. 76
Table 33: Projected EVs deployed in Pennsylvania major MSAs by scenario in 2033 ........................................ 78
Table 34: Energy impacts for Pennsylvania major MSAs by scenario in 2033 ....................................................... 78
Table 35: Light duty vehicle greenhouse gas emissions in Pennsylvania major MSAs by scenario in
           2033 (well-to-wheels, million metric tons) ..................................................................................................... 79
Table 36: Light duty vehicle criteria pollutant emissions in Pennsylvania major MSAs by scenario in
           2033 (vehicle operation, million lbs.) ............................................................................................................... 79

                                                                           APPENDICES
Appendix A: Roadmap Process and Review...................................................................................................................... 67
Appendix B: National EV Deployment Strategy Examples ........................................................................................... 69
Appendix C: Scenario Modeling Methods and Assumptions ...................................................................................... 71
Appendix D: Modeling Results for Major Metropolitan Statistical Areas in Pennsylvania ................................. 78

                                                                                                                                                                          P a g e | vi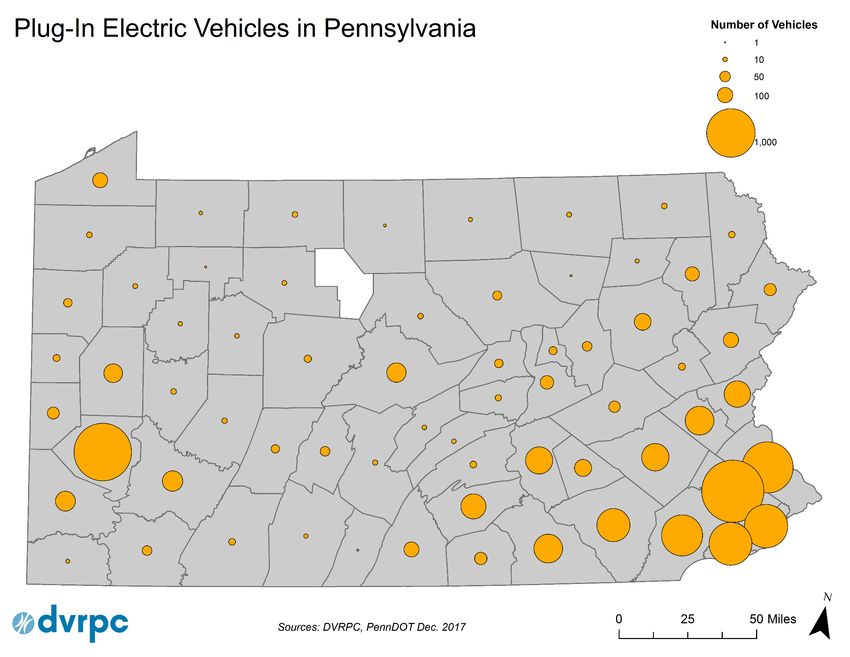
Message from Governor Tom Wolf

Climate change is the most critical environmental threat confronting the world. In
Pennsylvania, greenhouse gas emissions are creating significant challenges
ranging from devastating floods in our homes and towns to costly crop losses and
air pollution that exceeds federal standards and is linked to respiratory diseases.
Left unchecked, these emissions would create a high risk of severe, irreversible
impacts.

In January 2019, I signed an Executive Order establishing the first statewide goal to
reduce carbon pollution in Pennsylvania. The commonwealth will work to
permanently reduce greenhouse gas emissions 26 percent by 2025 and 80 percent by 2050, compared
with 2005 levels. The Executive Order also established the Green Government Council to achieve
quantitative state agency performance goals in energy conservation, renewable energy procurement, and
clean transportation.

This includes replacing 25 percent of the state government passenger car fleet with electric cars and electric
hybrid cars by 2025. As their battery costs fall and mileage range increases, these zero-emission vehicles
have the potential to provide significant benefits for our health, economy, and environment.

Commonwealth agencies must lead by example, demonstrating commitment to environmental and fiscal
stewardship. I commend the Departments of Environmental Protection, General Services, and Conservation
and Natural Resources; PennDOT; and the Public Utility and Turnpike Commissions for partnering with
other statewide experts to develop Pennsylvania’s Electric Vehicle Roadmap—a set of strategies to increase
electric vehicle use within two years, within five years, and beyond.

Pennsylvanians’ quality of life depends on the careful stewardship of resources and development of
technologies to enable economic growth while protecting the environment. If implemented, strategies in
the Roadmap will help ensure that we begin soon to leverage the benefits of electric transportation for all
Pennsylvanians, while advancing toward a vibrant future for the commonwealth.

                                               Tom Wolf
                                               Governor

                                                                                                   P a g e | vii
Message from Secretary Patrick McDonnell

As the source of 20 percent of greenhouse gas emissions in Pennsylvania, the
gasoline- and diesel-powered transportation sector is a key area for clean energy
innovations. If more Pennsylvanians chose electric vehicles (EVs), which generate
zero emissions, we could make great strides in reducing greenhouse gases
statewide. By 2023, in fact, each mile driven by a new EV would emit 50 percent less
greenhouse gas than a new gasoline-powered car.

Increased EV use would bring other significant benefits: reduced asthma and other
respiratory disease, jobs in EV manufacturing and infrastructure installation,
consumer cost savings from greater fuel efficiency and lower maintenance, and lower costs for ratepayers
through improved efficiency in the electricity grid (for example, adding new load at night, when grid use is
lower).

Pittsburgh, Philadelphia, and a few other parts of the state are avidly pursuing EV initiatives. We know from
applications to the Driving PA Forward and Alternative Fuel Incentive grant programs that some businesses,
schools, hospitals, and municipalities are interested in EV use and charging stations. Still, EV use lags in
Pennsylvania.

The Department of Environmental Protection formed the Drive Electric PA Coalition—a statewide
partnership of state agencies and industry, community, and academic leaders—in 2016 to conduct a
research-grounded analysis of the best ways to overcome barriers to great EV use in Pennsylvania. The
result is Pennsylvania’s Electric Vehicle Roadmap, which lays out 13 strategies to tap the great potential of
EVs, from increased public education to EV-ready building code amendments and financing programs.

To reap the benefits of electric transportation, Pennsylvania will require more intensive leadership,
investment, and recognition of the long-range economic and environmental benefits. I’m proud of the
leadership DEP and our partners are providing on this important aspect of Pennsylvania’s transportation
mix. If you’d like to join us on the road to a cleaner, healthier Pennsylvania, I invite you to turn the page.
Further, I encourage you to consider how this valuable work might inform your transportation decisions.

                                            Patrick McDonnell
                                                 Secretary
                                   Department of Environmental Protection

                                                                                                  P a g e | viii
P a g e | ix
EXECUTIVE SUMMARY
This roadmap was developed on behalf of the Pennsylvania Department of Environmental Protection
(DEP) and in collaboration with the Drive Electric Pennsylvania Coalition. The purpose of this roadmap is
to review the state of the electric vehicle (EV) market in Pennsylvania, define a set of proposed strategies
to support the expansion of the EV market, and provide estimates of the potential benefits and impacts
to the state from an increased EV market.
EVs have the potential to transform Pennsylvania’s transportation system and provide significant benefits
for the environment, economy, and society. Some of the primary potential benefits include greenhouse
gas reduction, air pollutant reduction, consumer cost savings, benefits to the electricity grid, and economic
development benefits. Though many areas in Pennsylvania’s transportation system could benefit from
increased electrification, this roadmap focuses solely on the light-duty vehicle market, currently the most
cost-effective market for EVs. Furthermore, though other alternative fuel technologies, such as fuel cell
electric vehicles are in the early phases of market commercialization, this roadmap focuses solely on battery
electric and plug-in hybrid electric vehicles.
In 2017, Pennsylvania ranked 24th nationwide for total sales of EVs. Major metropolitan regions have seen
a slightly higher share of EV registrations than other parts of the state, with Philadelphia experiencing
two times the share of EV registrations compared to smaller metropolitan regions and rural parts of the
state. Pennsylvania has over 395 publicly listed electric vehicle supply equipment (EVSE), or charging
stations, and 910 total plugs, most of which are Level 2 chargers.
Pennsylvania currently has a breadth of local, regional, and state initiatives designed to support
EV deployment. The 13 strategies laid out in this roadmap expand or augment those preexisting initiatives
in the state and are intended to be implemented in the near-, medium-, or long-term (0-2 years, 2-5 years,
or more than 5 years in the future). The strategies cover goals and targets, pricing-based policies, public
planning and investment actions, education and outreach initiatives, enabling regulations, and financing
models. Together, the proposed strategies address barriers facing EV drivers, single family home residents,
multi-family home residents, workplaces, fleets, utilities, dealers, and other key stakeholders. The strategies
proposed in this roadmap are intended to increase consumer and dealer confidence in EVs, encourage
utility participation in expanding the EV charging infrastructure, improve consumer economics, and
expedite processes for installing and expanding EV infrastructure across the state. Within each strategy,
suggestions for implementation pathways are provided. The implementation pathway for each strategy
can be adapted to lower or higher levels of effort as EV technologies, costs, and the commonwealth’s
policy and political context change over time.
The strategies recommended for Pennsylvania are illustrated in Table 1.

                                                                                                     Page | x
Table 1: Timeline of recommended strategies to support EV adoption in Pennsylvania
Near-term Mid-term Long-term
actions actions actions
Strategy (0-2 years) (2-5 years) (5+ years)
Establish utility transportation electrification directive
Establish statewide EV sales goals
Expand and improve AFIG rebate program
Strengthen statewide EVSE network planning, investment,
and communications
Establish fleet education, cooperative purchase, and
technical assistance program
Create EV marketing and education campaign targeted at
consumers
Establish dealer outreach and support program
Encourage residential and commercial EV rate designs
Advance public and residential EVSE investment
Develop municipal support, technical assistance, and grant
program
Establish workplace and multifamily EVSE education and
outreach programs
Adopt EV-ready building code amendments
Explore development of financing for EVs/EVSE
To provide an understanding of the range of potential energy, environmental, and economic impacts of
increased EV and EVSE adoption in Pennsylvania, four EV adoption scenarios were modeled. These
four scenarios represent the intersection of low- or high-policy support and low- or high-technology
advancement. For each scenario, the following assessments were conducted: energy impacts; greenhouse
gas and criteria pollutant emissions impacts; and economic impacts on future EV consumers, non-EV
consumers, and on society with and without environmental benefits. Figure 1 illustrates the EV sales
adoption curve for each of the four scenarios.
P a g e | xiFigure 1: Scenario modeling of projected EV sales shares, 2017-2035
90%
80%
70%
60%
50%
40%
30%
20%
10%
0%
2016 2018 2020 2022 2024 2026 2028 2030 2032 2034 2036
Scenario 1: Low policy, Low technology Scenario 2: Low policy, High technology
Scenario 3: High policy, Low technology Scenario 4: High policy, High technology
The EV sales scenarios in Figure 1 show a range of EV adoption over time. In Scenario 1 (low policy, low
technology), EVs represent 10 percent of total sales by 2033, whereas Scenario 4 (high policy, high
technology) has EV’s representing 79 percent of total sales by the same year.
Those EV sales scenarios manifest into fleet penetration in different ways. In Scenario 1 (low policy, low
technology), EVs represent 7 percent of the total light-duty fleet by 2033, whereas Scenario 4 (high policy,
high technology) forecasts that EVs will represent 31 percent of the light-duty fleet. As the scenarios
become more aggressive, they result in greater reductions in gasoline consumption, greenhouse gas
emissions, air pollution, and future social and environmental costs. Based on the data and assumptions
adopted for this analysis, it is estimated that all four scenarios may be cost-effective to society and to the
future EV consumer by 2033. However, Scenario 3 (high policy, low technology) is not anticipated to be
cost effective for society if environmental benefits are not considered or for non-EV consumers (see
SECTION 4 for greater detail). The results of these four scenario models can be utilized by the
commonwealth to understand the range of potential impacts of the various policy options in the roadmap
and of an increased EV market in the state.
As entities in Pennsylvania work together with the commonwealth or the Drive Electric Pennsylvania
Coalition to implement the strategies laid out in this roadmap, conducting pilot tests and evaluating the
impact of these policies as they are implemented will be important to ensure the strategies are having the
desired impact of increasing EV adoption. Furthermore, it is recommended that these strategies be revisited
periodically to adjust to the changing and growing EV market in Pennsylvania.
P a g e | xiiROADMAP GLOSSARY
AEO – Annual Energy Outlook published by the Energy Information Agency used for several projections in
this roadmap.
AFIG – Alternative Fuel Incentive Grant program that funds a variety of alternative fuel vehicle programs.
AFDC – Alternative Fuels Data Center, a resource of the U.S. DOE’s Vehicle Technologies Office.
AFLEET – Alternative Fuel Life-Cycle Environmental and Economic Transportation tool created by Argonne
National Labs and used for emissions modeling and cost inputs for benefit-cost analysis in this roadmap.
AFV – Alternative fuel vehicle
BCA – Benefit-cost analysis
BEV – Battery electric vehicle (e.g., Nissan Leaf)
CD mode – Charge depleting mode, or when a plug-in hybrid electric vehicle is dependent on the energy
in its battery pack.
CO – Carbon monoxide
CS mode – Charge sustaining mode, or when a plug-in hybrid electric vehicle is running primarily on its
gasoline engine.
DEP – Pennsylvania Department of Environmental Protection
DOE – United States Department of Energy
DVRPC – Delaware Valley Regional Planning Commission
EIA – Energy Information Agency
EREV – Extended range electric vehicle
EV – Electric vehicle, meaning a vehicle powered, at least in part, by electricity. Unless otherwise noted, EV
refers to all plug-in vehicles in this report.
ESCO – Energy Services Company
eVMT – Electric vehicle miles traveled
EVSE – Electric Vehicle Supply Equipment, or electric vehicle charging infrastructure.
GVWR – Gross vehicle weight rating
HDV – Heavy-duty vehicle, which refers to vehicles that weigh over 26,000 lbs. GVWR. Examples include
transit buses, refuse trucks, and long-haul tractor trailers.
HOA – Home Owners’ Association
ICEV – Internal combustion engine vehicle
kWh – Kilowatt-hour
P a g e | xiiiLDV – Light-duty vehicle, which generally refers to vehicles that weigh less than 10,000 lbs. GVWR. LDVs
are the primary focus of this report, which is further broken down to light-duty cars and trucks.
Light-duty car – Includes subcompact, compact, midsize, and large cars. Also referred to as passenger cars.
Light-duty truck – Includes SUVs, vans, and pick-up trucks. Also referred to as passenger trucks.
Level 1 EVSE – AC Level 1 EVSE (often referred to simply as Level 1) provides charging through a 120-volt
(120V) AC plug. 8 hours of charging at 120V can replenish about 40 miles of electric range for a mid-size
PEV. 1
Level 2 EVSE – AC Level 2 EVSE offers charging through 240V (typical in residential applications) or 208V
(typical in commercial applications) electrical service. For every 1 hour of charging, Level 2 EVSE can provide
10-20 miles of range.
DCFC – Direct-current (DC) fast charging equipment, sometimes called DC Level 2 (typically 208/480V AC
three-phase input), enables rapid charging. For every 20 minutes of charging, DCFC can provide
60-80 miles of range.
MDV – Medium duty vehicle, which generally refers to vehicles that weigh 10,000-26,000 lbs. GVWR and
include vehicles like cargo vans and delivery trucks).
MPGe – Miles per gallon equivalent, often used to communicate the equivalent fuel economy of an EV.
MPO – Metropolitan Planning Organzation
MSA – Metropolitan Statistical Area. When MSAs referenced include jurisdictions from multiple states, the
analysis only includes areas within Pennsylvania.
NESCAUM – Northeast States for Coordinated Air Use Management, a nonprofit association of air quality
agencies in the Northeast.
NHTSA – National Highway Traffic Safety Administration
NOx – Oxides of Nitrogen
NREL – The National Renewable Energy Laboratory
OEM – Original Equipment Manufacturer
PCT – Participant Cost Test, a standard cost-effectiveness test for utility energy efficiency programs
measuring the costs and benefits of participants in a program.
PEV – Plug-in electric vehicles
PHEV – Plug-in hybrid electric vehicle (e.g., Chevrolet Volt)
PJM – The regional transmission organization (RTO) that coordinates the movement of wholesale electricity
in all or parts of 13 states and the District of Columbia, including Pennsylvania.
1
EVSE definitions adapted from AFDC.gov: https://www.afdc.energy.gov/fuels/electricity_infrastructure.html#dc
P a g e | xivPM2.5 – Fine particulate matter
PM10 – Large particulate matter
PSC – Public Service Commission
PUC – Public Utility Commission
RIM – Ratepayer Impact Measure, a standard cost-effectiveness test for utility energy efficiency programs
measuring the costs and benefits of non-participants in a program.
SCT – Societal Cost Test, a standard cost-effectiveness test for utility energy efficiency programs measuring
the total societal costs and benefits of a program, typically including the estimated monetary costs of
environmental and social impacts.
SOx – Sulfur oxides
TCI – Transportation and Climate Initiative, an initiative of the Georgetown Climate Center working with
Northeastern states and stakeholders to address carbon emissions from the transportation sector.
TCO – Total cost of ownership, comprising vehicle purchase cost, infrastructure costs, and operations and
maintenance costs, less any residual value recovered at the time of sale.
TRC – Total Resource Cost test, a standard cost-effectiveness test for utility energy efficiency programs
measuring the total societal costs and benefits of administering a program.
The Coalition – The Drive Electric Pennsylvania Coalition
TOU rates – Time of Use electricity rates that typically trade higher on-peak rates for lower off-peak rates.
They can be designed for residential customers in general, or specifically for EV charging.
V2G – Vehicle to grid, which describes the potential for electric vehicles to provide value to the electric grid
through selling power from their batteries back to the grid, or by participating in demand response
programs.
VMT – Vehicle miles traveled
VOC – Volatile organic compounds
VW – Volkswagen
Well-to-wheels – A complete vehicle fuel-cycle analysis that includes the emissions associated with fuel
mining, transport, and production (well-to-tank), as well as vehicle operation (tank-to-wheels).
ZEV – Zero emissions vehicle
P a g e | xvSECTION 1 INTRODUCTION
1.1 THE NEED FOR ELECTRIC VEHICLE DEPLOYMENT
NATIONWIDE AND IN PENNSYLVANIA
Electric vehicles (EV) have the potential to transform Pennsylvania’s transportation system and provide
significant benefits for the environment, economy, and society. As battery costs continue to fall and vehicle
range increases, EVs are becoming a cost-effective and viable option for consumers and fleets alike. Still,
EV deployment continues to lag market forecasts due to a range of barriers. To unlock the potential
benefits of EVs for Pennsylvania, policymakers and key stakeholders have begun to work together to
identify policies and programs designed to overcome these barriers and increase EV adoption rates. Some
of the primary potential benefits of EVs for Pennsylvania include:
Greenhouse gas reductions: Governor Wolf recently signed a new executive order establishing the
first statewide goal to reduce carbon pollution in Pennsylvania, which is contributing to climate
change. The goal states that the commonwealth will work to achieve a 26 percent reduction of
greenhouse gas emissions by 2025 and an 80 percent reduction by 2050, from 2005 levels.
Additionally, the state monitors the impacts and economic opportunities associated with climate
change. 2 In 2013, transportation made up 23 percent of Pennsylvania’s net greenhouse gas
emissions (20 percent of gross emissions, see Figure 2), 65 percent of which were from gasoline-
powered vehicles and 26 percent of which were from diesel-powered vehicles. 3 By 2023, each mile
driven by an EV passenger car compared to a gasoline-powered vehicle would emit 50 percent less
greenhouse gases based on the anticipated regional electricity mix. These emissions reductions are
anticipated to grow over time as Pennsylvania’s electricity sector becomes cleaner.
Air pollutant reduction: As of 2018, several counties in Pennsylvania consistently exceed EPA
human-health and environmentally based standards for 8-hour ozone and for fine particulate
matter (PM2.5), which both have significant negative human health impacts. 4 The burning of higher
carbon fossil fuels, including gasoline and diesel, in high traffic intensity areas is a substantial source
of air pollution. According to the 2014 National Emissions Inventory, 53 percent of statewide NOx
emissions and 10 percent of PM2.5 emissions are from mobile sources. 5 With zero tailpipe emissions,
2
Pennsylvania Department of Environmental Protection. (2016, August). 2015 Climate Change Action Plan Update.
Retrieved from http://www.depgreenport.state.pa.us/elibrary/GetDocument?docId=5342&DocName=FINAL
2015 Climate Change Action Plan Update.pdf
3
Pennsylvania Greenhouse Gas Inventory 2016. (2017, January). Retrieved from
http://files.dep.state.pa.us/Air/AirQuality/AQPortalFiles/Advisory%20Committees/CCAC/Docs/Inventory-2016_1-18-
17_(final).pdf
4
The counties out of attainment for 8-hour ozone are Lancaster, Pittsburgh-Beaver Valley, Reading, Allentown-
Bethlehem-Easton, and Philadelphia; and for PM2.5 are Lebanon County, Allegheny County, and Delaware County.
https://www3.epa.gov/airquality/greenbook/ancl2.html
5
EPA. (2018, March). Air Emissions Inventories. 2014 National Emissions Inventory (NEI) Data. Retrieved from
https://www.epa.gov/air-emissions-inventories/2014-national-emissions-inventory-nei-data
Page | 1EVs have the potential to reduce the burden on communities near highways, ports, and other high
traffic zones, and improve quality of life and public health outcomes.
Figure 2: 2013 Pennsylvania Gross Greenhouse Gas Emissions by Sector
Agriculture
2% Waste
4%
Diesel
Electricity 5%
34% Jet fuel, kerosene
1%
Transportation
20% Motor gasoline
13%
Industrial
30%
Residential Natural gas
7% 1%
Commercial
3%
(Source: DEP 2016 GHG inventory)
Consumer cost savings: Due to the greater fuel efficiency and lower maintenance requirements of
EVs, it is anticipated that consumers and fleets that switch to EVs from gasoline-powered vehicles
will save on maintenance and fuel costs over the lifetime of their vehicle. Maintenance costs for EVs
have been found to be lower than conventional vehicles due to less wear on brakes and fewer
moving parts. 6 While most EVs have greater upfront costs compared to their gasoline-powered
counterparts, ongoing reductions to battery costs suggest the cost premium will decline over time
and savings will grow.
Benefits to the electricity grid: Widespread electrification of vehicles could improve the load factor
of the grid, i.e., increase the overall efficiency or utilization rate of the grid. Because the electric grid
typically operates below peak capacity, by strategically adding new electric load at the right times
(e.g., at night when grid use is lowest), EV adoption in Pennsylvania can help drive down costs for
ratepayers, support increased renewable energy integration, and improve reliability to consumers.
In addition, with managed EV charging and bidirectional vehicle-to-grid (V2G) charging, EVs could
potentially support increased renewable energy generation and integration as well as grid stability
through frequency regulation, reduced curtailment, and by providing reserve capacity during peak
demand periods. Bidirectional charging gives EVs the potential to balance variable electricity
6
Palmer, K., Tate, J., Wadud, Z., Nellthorp, J. (2017, November 4). Total cost of ownership and market share for
hybrid and electric vehicles in the UK, US and Japan. Applied Energy, 209). Retrieved from
https://www.sciencedirect.com/science/article/pii/S030626191731526X
Page | 2production from intermittent renewable sources and store excess energy, thus reducing curtailment
of renewable sources. 7
Economic development benefits: By beginning to transition its transportation system to run on
electricity, Pennsylvania can decrease its reliance on foreign oil and increase its reliance on domestic
fuels and an electricity sector that brings greater economic impacts to the local economy. 8
Additionally, Pennsylvania could benefit from job growth in EVSE installation, EV parts or vehicle
manufacturing, as well as related EV/EVSE services including education and training of EV
mechanics. 9
Some of these benefits—air pollution reduction,
greenhouse gas emissions reductions, and consumer Figure 3: Historical and projected electricity grid
cost savings—are anticipated to grow over time. mix in PA (Source: EIA)
Increasingly, Pennsylvania is powering its electricity grid
100%
with cleaner sources, meaning each mile converted to
electric mobility will yield greater greenhouse gas and air 80%
quality benefits. 60%
40%
For example, as illustrated in Figure 3, between 1990 and
2016, the share of electricity generated by coal in the 20%
state fell from 61 percent to 25 percent and is expected 0%
1990 2016 2023 2028 2033
to fall further to 19 percent by 2033. Over the same
period, total annual statewide electricity sector emissions Coal Nuclear power Oil
decreased 22 percent and emissions intensity Natural gas Biomass Renewables
(greenhouse gas emissions per unit of electricity
produced) fell 37 percent (see Figure 4). 10
7
IRENA. (2017, February). Electric Vehicles Technology Brief. Retrieved from http://www.irena.org/-
/media/Files/IRENA/Agency/Publication/2017/IRENA_Electric_Vehicles_2017.pdf
8
National Renewable Energy Laboratory. (2017, April 20). Connecting Electric Vehicles to the Grid for Greater
Infrastructure Resilience. Retrieved from https://www.nrel.gov/news/program/2017/connecting-electric-vehicles-to-
the-grid-for-greater-infrastructure-resilience.html
9
Todd, J., Chen, J., Clogston, F. (2013). Creating the Clean Energy Economy: Analysis of the Electric Vehicle Industry.
Retrieved from https://www.iedconline.org/clientuploads/Downloads/edrp/IEDC_Electric_Vehicle_Industry.pdf
10
U.S. Energy Information Administration. (2018, January 25). Electricity. Pennsylvania State Electricity Profile 2016.
Retrieved from https://www.eia.gov/electricity/state/pennsylvania/
Page | 3Figure 4: PA Greenhouse gas and criteria pollutant electricity emissions intensity, 1990-2016
18.0 1,600
Lbs./MWh (Sulfur dioxide, nitrogen
16.0 1,400
Lbs./MWh (Carbon dioxide)
14.0 1,200
12.0
1,000
10.0
oxide)
800
8.0
600
6.0
4.0 400
2.0 200
0.0 0
1990
1991
1992
1993
1994
1995
1996
1997
1998
1999
2000
2001
2002
2003
2004
2005
2006
2007
2008
2009
2010
2011
2012
2013
2014
2015
2016
Sulfur dioxide Nitrogen oxide Carbon dioxide
(Source: EIA)
Moreover, advances in battery technology have resulted in battery costs declining by 73 percent between
2010 and 2016, which has driven subsequent reductions in upfront costs for EVs. 11 As a result, EVs are
anticipated to become increasingly cost-effective for consumers on a total cost of ownership (TCO) basis
as costs for batteries and other EV components continue to fall.
Importantly, while not an issue at low levels of EV deployment, increased levels of EV adoption could impact
gas tax revenues that fund road and bridge maintenance. Transportation experts agree a new revenue
solution for transportation infrastructure is needed regardless of EV uptake, as increasing fuel economy
fleetwide and other factors erode gas tax revenues. As EV deployment increases, it will be important to
determine revenue replacement options for gas taxes, and to determine how EVs contribute to that system.
While EVs have the potential to positively transform Pennsylvania’s transportation system, widespread
deployment is unlikely to happen—and the potential benefits are unlikely to be maximized—without
policymakers and other key stakeholders implementing a range of enabling policies, programs, and market
interventions. To date, EV deployment in Pennsylvania has represented a small share of the overall vehicle
market (0.56 percent in 2017 for both battery electric vehicles [BEVs] and plug-in electric vehicles [PHEVs]),
and market growth has been slower than many peer states. This roadmap is designed to jumpstart the EV
market in Pennsylvania and to help residents, fleet owners, and businesses realize the benefits of
transportation electrification for the state.
11
Curry, C. (2017, July 5). Lithium-Ion Battery Costs and Market. Retrieved from
https://data.bloomberglp.com/bnef/sites/14/2017/07/BNEF-Lithium-ion-battery-costs-andmarket.pdf
Page | 41.1.1 NOTABLE NATIONAL AND REGIONAL EV INITIATIVES
Notable national and regional initiatives designed to increase EV adoption that have also informed the
development of this roadmap include:
Zero Emission Vehicle states: California has unique authority under the Clean Air Act to adopt stricter
vehicle emission regulations than federal government standards, and other states are also eligible to adopt
California’s standards. California’s Zero Emission Vehicle (ZEV) legislation requires that 14 percent of the
vehicles auto manufacturers deliver and sell to the state of California must be zero emission vehicles
(electric or hydrogen), rising to 22 percent by 2025. Nine other states—Connecticut, Maine, Maryland,
Massachusetts, New Jersey, New York, Oregon, Rhode Island, and Vermont—have adopted California’s
ZEV program. In addition to the ZEV sales mandate for manufacturers, participating states in the ZEV
Memorandum of Understanding have also agreed to coordinate on several actions to support ZEV
deployment, such as adoption of EV-friendly building codes and laws, setting EV purchase targets for
government fleets, and implementing incentives for EV drivers. The program is considered one of the
strongest policies driving EV adoption in the United States.
Drive Change. Drive Electric: 12 The Northeast States for Coordinated Air Use Management (NESCAUM) has
collaborated with the Association of Global Automakers and the Alliance of Automobile Manufacturers to
launch the ‘Drive Change. Drive Electric’ Campaign, a joint effort of major automakers and states, including
New York, Connecticut, Massachusetts, New Hampshire, Rhode Island, Vermont, and New Jersey. The goal
of the campaign is to raise consumer awareness and understanding of zero emission vehicle technologies
by developing a website, social media outreach, advertising materials, and events.
Northeast Electric Vehicle Network: The Northeast Electric Vehicle Network, run by Georgetown Climate
Center’s Transportation and Climate Initiative, is “an effort to coordinate electric vehicle infrastructure
planning and deployment throughout the Northeast and Mid-Atlantic regions. The Network refers to more
than just physical infrastructure; it includes partnerships and connections necessary for a successful
transition to cleaner and more efficient electric transportation.” 13 The Network is a partnership of state
governments, utilities, charging infrastructure providers, private companies, nonprofits, universities, and
local governments.
Northeast Corridor Strategy: NESCAUM's recently released Northeast Corridor Strategy is a collaborative
effort of Northeast states from D.C. to Maine aimed to facilitate EV travel through the highly connected
region. The strategy includes a joint vision and recommendations for funding and building a regional
charging network, and ensuring investments are aligned with regional goals.
12
Drive Change Drive Electric. About ‘Drive Change. Drive Electric.’. Retrieved from
https://driveelectricus.com/about-us/
13
Transportation & Climate Initiative of the Northeast and Mid-Atlantic States. Northeast Electric Vehicle Network.
Retrieved from http://www.transportationandclimate.org/content/northeast-electric-vehicle-network
Page | 51.2 ROADMAP OVERVIEW AND PURPOSE
1.2.1 DRIVE ELECTRIC PENNSYLVANIA COALITION
In 2016, the Pennsylvania Department of Environmental Protection (DEP) Energy Programs Office began
collaborating with a broad range of stakeholders with the goal of increasing EV adoption in Pennsylvania.
These stakeholders now form the Drive Electric Pennsylvania Coalition (the Coalition), which includes state
and municipal government officials, U.S. Department of Energy's (DOE) Clean Cities Coalitions, EV
businesses and consultants, transportation organizations, electric utilities, environmental groups, auto
companies, and other interested stakeholders. The Coalition meets quarterly and participation is open to
the public. The Coalition seeks to increase the acceptance and adoption of EVs by state government
agencies, local governments, businesses, industry, and the public in Pennsylvania. The Coalition has formed
the following three subcommittees to further define plans, goals, and activities related to these important
areas:
The Education and Outreach Committee is focused on developing and implementing a statewide
education and communications strategy that increases awareness and understanding of EVs for all
Pennsylvania citizens, businesses, and governmental entities.
The Infrastructure Committee is focused on helping to increase demand for EVs by supporting
cost-effective and robust planning and investment in EVSE to promote consistent access and
charging experiences for all Pennsylvania citizens, businesses, and governmental entities.
The Procurement Committee is working to accelerate the adoption of EVs in Pennsylvania fleets by
providing educational resources, tools, goals, and promotions that address the needs of state,
municipal, private fleets, and consumer purchases.
1.2.2 ROADMAP PURPOSE
This document serves as the Commonwealth of Pennsylvania’s EV roadmap and has been structured to
achieve the following goals:
Expand the knowledge base of the Coalition and other Pennsylvania entities via information
gathering from a broader base of stakeholders.
Document a baseline of information regarding the deployment of EVs and EVSE in Pennsylvania to
date.
Identify EV policies, plans, and programs that can support EV deployment in Pennsylvania and draw
from best practices around the U.S. and internationally.
Develop a consistent and robust roadmap by leveraging the expertise of Coalition stakeholders, EV
thought leaders from different sectors, and experts in EV policy and planning.
1.2.3 ROADMAP FOCUS AND STRUCTURE
This roadmap explores policy measures and market interventions that can support development of
electrified on-road passenger transportation modes in Pennsylvania, with a primary focus on light-duty
Page | 6vehicles (LDV), including both light-duty cars (passenger cars such as sedans and hatchbacks) and light-
duty trucks (vehicles like SUVs, vans, and pick-up trucks). Altogether, light-duty cars and trucks comprise
89 percent of on-road vehicle miles traveled in the state (PennDOT Highway Statistics 2016).
When discussing strategies to increase adoption of EVs, the report includes both full BEVs as well as plug-
in hybrid electric vehicles (PHEV). Though traditional hybrids and other alternative fuel vehicles, such as
fuel cell electric vehicles, are also important potential strategies for Pennsylvania’s transportation sector,
this report does not address those vehicle types. The roadmap has been informed by several facilitated
workshops engaging Coalition members, a literature review, EV policy research, interviews with national EV
experts, and targeted modeling. More details about the process for developing this roadmap and a
literature review of EV deployment planning documents can be found in Appendix A.
The remainder of the roadmap is structured as follows:
SECTION 2: State of the EV Market in Pennsylvania: This section provides an overview of progress
and trends with respect to deployment of EVs and EVSE in Pennsylvania to date, as well as an
assessment of key market barriers affecting the deployment of EVs in Pennsylvania.
SECTION 3: Next Generation EV Strategies: This section describes best practices in EV policies,
programs, and other types of strategies from around the country, provides a benchmark of current
state and local policies and programs in Pennsylvania, and recommends a set of priority policies
and programs to increase EV deployment in Pennsylvania.
SECTION 4: Pennsylvania EV Market Penetration Scenarios: This section documents the
methodology and results of the scenario modeling, which describes the potential economic,
environmental, and energy sector impacts across a range of EV deployment scenarios.
SECTION 5: Conclusions and Next Steps: This section summarizes the key conclusions of the report
and outlines next steps, timelines, and stakeholder roles and responsibilities to implement policy
and program recommendations.
Page | 7SECTION 2 STATE OF THE EV MARKET IN PENNSYLVANIA
2.1 EV AND EVSE DEPLOYMENT IN PENNSYLVANIA
This section provides a snapshot of Pennsylvania’s progress to date in deploying EVs and EVSE, considering
trends in EV sales, geographic distribution of EV registrations, and progress in EVSE installations. It also
benchmarks Pennsylvania’s progress in EV deployment against other state and regional markets.
2.1.1.1 Available EV technology
Since 2011, the number of distinct EV models available has grown Figure 5: Registered vehicles in PA by
vehicle type
from under 5 to over 53, increasing the available options for
consumers. 14 Thus far, available EV models are primarily light- Vans/mini
vans, 7%
duty cars (such as sedans and hatchbacks), while SUVs, vans, and
Pickups,
pick-up trucks are just beginning to become available in PHEV 16%
models, and BEV models are anticipated to become available in
the future (see Table 2 for sample models of available EV models).
Cars,
Today, 53 percent of registered light-duty vehicles in 45%
Pennsylvania are SUVs, pick-up trucks, or vans. Given that
SUVs,
available EVs are primarily sedans and hatchbacks, the dominance 30%
of the other LDV platforms in PA could present a barrier for EV
adoption in the coming years (see Figure 5). 15
14
Office of Energy Efficiency & Renewable Energy. Find Electric Vehicle Models. Retrieved from
https://www.energy.gov/eere/electricvehicles/find-electric-vehicle-models
15
Auto Alliance Driving Innovation. (2015). State Facts: Autos Drive Pennsylvania Forward. Retrieved from
https://autoalliance.org/in-your-state/PA/
Page | 8Table 2: Vehicle types and available BEV and PHEV models 16
Vehicle type BEV sample models PHEV sample model
Compact and Ford Focus Electric Chevy Volt
Light-duty cars
subcompact cars (MSRP $29,200; Range 115 miles) (MSRP $33,200; Range 53 miles)
Nissan Leaf Prius Prime
Mid-size and large (MSRP $29,990; Range 151 miles) (MSRP $27,100; Range 25 miles)
cars Tesla Model 3 Ford Fusion Energi
(MSRP $35,000; Range 310 miles) (MSRP $33,400; Range 21 miles)
Mitsubishi Outlander
SUV
No models currently available. Toyota, (MSRP $34,600; Range 22 miles)
Light-duty
Chrysler Pacifica
trucks
BYD, VW, Tesla, Mitsubishi, Volvo, Audi,
Van
etc. have all announced SUV, Van, or (MSRP $40,000; Range 33 miles)
Pick-up models to be released by 2020. Workhorse W-15
Pick-up
(MSRP $50,000, Range 80 miles)
Among medium and heavy-duty vehicles, electric transit buses are the most widely available and
commercialized vehicle type, with electric school buses, refuse trucks, delivery trucks, and some drayage
trucks in various phases of pilot, demonstration, and early commercialization phases. Analysts anticipate
that medium- and heavy-duty vehicle fleets that primarily serve local and regional routes will be prime
candidates for widespread electrification, whereas long-haul trucking electrification may prove more
difficult. 17
2.1.1.2 Benchmarking Pennsylvania’s EV deployment progress relative to other states
Figure 6: Market share of Zero Emission Vehicles in Pennsylvania, 2013-2017 (left) and Annual sales of
Zero Emission Vehicles in Pennsylvania, 2011-2017 (right)
(Source: Auto Alliance Advanced Technology Vehicle Sale Dashboard.)
16
Information from https://www.energy.gov/eere/electricvehicles/find-electric-vehicle-models,
http://www.plugincars.com/cars
17
Moultak, M., Lutsey, N., Hall, D. (2017, September). Transitioning to Zero-Emission Heavy-Duty Freight Vehicles.
Retrieved from https://www.theicct.org/sites/default/files/publications/Zero-emission-freight-trucks_ICCT-white-
paper_26092017_vF.pdf
Page | 9In 2017, Pennsylvania ranked 19th out of 50 states in PHEV Figure 7: EV sales share by state in 2017
market share, and 32nd in BEV market share. For both EV 0% 2% 4% 6%
types combined, Pennsylvania’s market share of California 4.9%
0.6 percent of new sales falls in the middle nationwide Washington 2.5%
Oregon 2.4%
(24th), though remains lower than states that are part of
Hawaii 2.2%
the ZEV mandate. Figure 7 highlights EV market share Vermont 2.1%
amongst ZEV and non-ZEV states in 2017. 18 EV sales in District of Columbia 1.8%
Colorado 1.6%
the light-duty vehicle market have been growing at an Connecticut 1.4%
Massachusetts
average annual rate of 36 percent between 2011 and 2017 1.4%
Maryland 1.0%
(see Figure 6). 19 During that period, PHEV sales exceeded New York 1.0%
BEV sales in Pennsylvania. The market share of EVs is still Utah 1.0%
Rhode Island 0.9%
very small but growing, capturing 0.55 percent of new Arizona 0.9%
vehicle sales in 2017, up from 0.24 percent in 2013 (see New Jersey 0.9%
New Hampshire 0.9%
Figure 6). Delaware 0.9%
Maine 0.8%
2.1.1.3 Geographic Distribution of EV Deployment Virginia 0.8%
Nevada 0.8%
Wisconsin
Major metropolitan regions like Philadelphia have seen a 0.7%
Illinois 0.6%
greater share of battery EV registrations than other parts Minnesota 0.6%
of the state, while smaller metropolitan regions and rural Georgia 0.6%
Pennsylvania 0.6%
parts of the state have experienced somewhat lower Florida 0.5%
adoption rates (see Table 3). 20 To date, there have been Kansas 0.5%
North Carolina 0.5%
more substantial local and regional EV policies and New Mexico 0.5%
*ZEV states
initiatives in the Philadelphia and Pittsburgh regions, Michigan 0.5%
Missouri 0.4% shown in
which collectively represent about 45 percent of the Indiana 0.4% green, non-
state’s vehicle fleet. While the six metropolitan statistical Idaho 0.4%
ZEV states in
Texas 0.4%
areas (MSA) studied for this roadmap and highlighted in Alaska 0.4% grey, and PA
Table 3 represent a majority of the state’s vehicle market, Iowa 0.4% in red
Ohio 0.4%
38 percent of vehicles are registered outside these areas, Tennessee 0.3%
indicating a need for a statewide strategy in addition to Nebraska 0.3%
Montana 0.3%
targeted regional initiatives. Kentucky 0.3%
South Carolina 0.3%
Wyoming 0.3%
South Dakota 0.2%
Alabama 0.2%
West Virginia 0.2%
Arkansas 0.2%
Louisiana 0.2%
Mississippi 0.1%
North Dakota 0.1%
Oklahoma 0.1%
18
Data is from the Auto Alliance Advanced Technology Vehicles Sales Dashboard, and includes both BEV and PHEV
sales in 2017.
19
Based on data from the Auto Alliance Advanced Technology Vehicle Sales Dashboard.
20
PennDOT has data only for BEV registrations, while PHEVs are included with hybrid vehicles.
P a g e | 10You can also read


