Charging the Future: Challenges and Opportunities for Electric Vehicle Adoption - Projects at Harvard
←
→
Page content transcription
If your browser does not render page correctly, please read the page content below
Charging the Future: Challenges and
Opportunities for Electric Vehicle
Adoption
Faculty Research Working Paper Series

Henry Lee
Harvard Kennedy School

Alex Clark
Climate Policy Initiative

September 2018
RWP18-026

Visit the HKS Faculty Research Working Paper Series at:
https://www.hks.harvard.edu/research-insights/publications?f%5B0%5D=publication_types%3A121
The views expressed in the HKS Faculty Research Working Paper Series are those of the author(s) and do not
necessarily reflect those of the John F. Kennedy School of Government or of Harvard University. Faculty Research
Working Papers have not undergone formal review and approval. Such papers are included in this series to elicit
feedback and to encourage debate on important public policy challenges. Copyright belongs to the author(s). Papers
may be downloaded for personal use only.

                                                                                                  www.hks.harvard.edu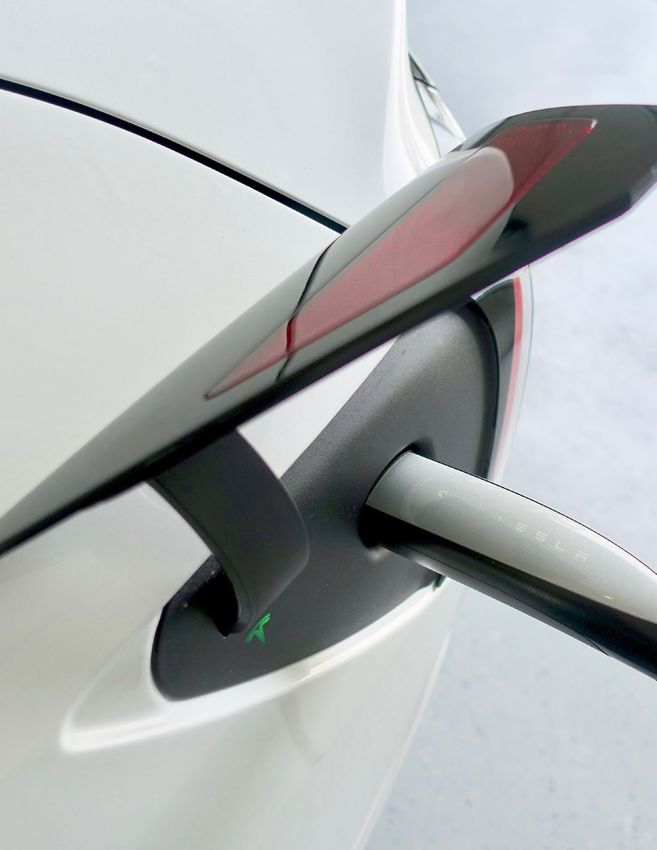
E N V I R O N M E N T A N D N AT U R A L R E S O U R C E S

Charging
the Future
Challenges and Opportunities
for Electric Vehicle Adoption

Henry Lee
Alex Clark

                                                                   PA P E R
                                                             AUGUST 20 1 8
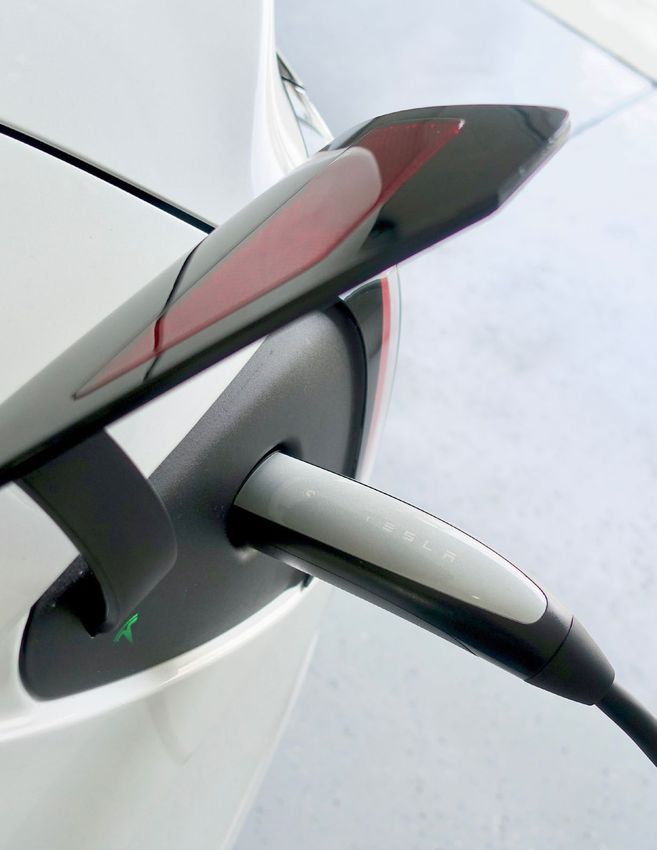
Environment and Natural Resources Program
Belfer Center for Science and International Affairs
Harvard Kennedy School
79 JFK Street
Cambridge, MA 02138

www.belfercenter.org/ENRP

The authors of this report invites use of this information for educational purposes, requiring only

that the reproduced material clearly cite the full source: Lee, Henry, and Alex Clark, “Charging the

Future: Challenges and Opportunities for Electric Vehicle Adoption.” Belfer Center for Science and

International Affairs, Cambridge, Mass: Harvard University, August 2018.

Statements and views expressed in this report are solely those of the authors and do not imply

endorsement by Harvard University, the Harvard Kennedy School, or the Belfer Center for Science

and International Affairs.

Design and layout by Andrew Facini

Cover photo: A Tesla Model 3 charges using a Mobile Charger 2.0, 29 July 2017.

(Steve Jurvetson/CC BY 2.0)

Copyright 2018, President and Fellows of Harvard College

Printed in the United States of America
E N V I R O N M E N T A N D N AT U R A L R E S O U R C E S

Charging
the Future
Challenges and Opportunities
for Electric Vehicle Adoption

Henry Lee
Alex Clark

                                                                   PA P E R
                                                             AUGUST 20 1 8
About the Project
The Environment and Natural Resources Program at the Belfer Center for
Science and International Affairs is at the center of the Harvard Kennedy
School’s research and outreach on public policy that affects global environ-
ment quality and natural resource management. Its mandate is to conduct
policy-relevant research at the regional, national, international, and global
level, and through its outreach initiatives to make its products available to
decision-makers, scholars, and interested citizens.
More information can be found on ENRP’s web site at www.belfercenter.
org/enrp or from assistant director, Amanda Sardonis (amanda_sardonis@
hks.harvard.edu) at ENRP, Harvard Kennedy School, 79 JFK Street, Cam-
bridge, MA 02138 USA.
ii Charging the Future: Challenges and Opportunities for Electric Vehicle AdoptionAbout the Authors
Henry Lee is the Jassim M. Jaidah Family Director of the Environment
and Natural Resources Program within the Belfer Center for Science and
International Affairs at Harvard’s John F. Kennedy School of Government,
Faculty Co-Chair of the Sustainability Science Program, and a Senior Lec-
turer in Public Policy. He also serves on the board of the school’s Middle
East Initiative. Before joining the School in 1979, Mr. Lee spent nine years
in Massachusetts state government as Director of the State’s Energy Office
and Special Assistant to the Governor for environmental policy. He has
served on numerous state, federal, and private boards, and advisory com-
mittees on both energy and environmental issues. His recent research
interests focus on energy and transportation, China’s energy policy, and
public infrastructure projects in developing countries.
Alex Clark is a climate finance analyst at the Climate Policy Initiative, cov-
ering a range of topics including low-carbon transport, blended finance
and tracking of climate finance flows. He is Senior Advisor to the Sustain-
able Development Solutions Network - Youth, and was the 2016-17 Henry
Fellow at the Harvard Graduate School of Arts and Sciences. He hold an
MSc in Global Governance and Diplomacy from Oxford University, and
a BA(Hons) in Politics, Philosophy and Economics from the University of
Warwick. Alex provides informal coordination support to the Galvanizing
the Groundswell of Climate Actions initiative, supporting non-state and
subnational climate action efforts globally. He is also an Associate Fellow of
the Royal Commonwealth Society.
Belfer Center for Science and International Affairs | Harvard Kennedy School iiiAcknowledgements
This paper benefited from the assistance on data access and analysis from
William Hogan, Raymond Plank Professor of Global Energy Policy at the
Harvard Kennedy School, and Mauricio Salles, Laboratory of Advanced
Electric Grids - LGrid, Polytechnic School, University of São Paulo, São
Paulo 05508-010, Brazil, and from data collected by PlugShare (formerly
Recargo). The authors are particularly thankful to the following individuals
for their insights and contributions:
Will Carry New York City Department of Transportation
Abdellah Cherkaoui Volta
Larry Dickerman Landis+Gyr
Ryan Harty American Honda Motor Company
Paul Hibbard Analysis Group
Steve Kosowski Kia Motors America
Nick Lembach Recargo
Kevin Miller ChargePoint
Salim Morsy Bloomberg New Energy Finance
Mike Nicholas International Council on Clean Transportation
Terry O’Day EVGo
Parina Parikh San Diego Gas & Electric
Qinyu Qiao Harvard Kennedy School
Jonathan Raab Raab Associates
Michael Replogle New York City Department of Transportation
Robert Scholer Kia Motors America
Cal Silcox Pacific Gas & Electric
Mark Simon New York City Department of Transportation
Patrick Smith New York City Department of Transportation
Dean Taylor Southern California Edison
None of the individuals listed have any responsibility for the content of this
paper, nor do they necessarily endorse its findings. We would also like to
express our appreciation to Julie Gardella for her assistance in formatting
and preparing numerous drafts of this paper.
Belfer Center for Science and International Affairs | Harvard Kennedy School vTable of Contents
Executive Summary............................................................................1
Introduction........................................................................................ 4
1. Battery Technology....................................................................... 6
1.1 Challenges to Wider Deployment.......................................................... 9
1.2 Subsidies .............................................................................................. 10
1.3 Lifetime Costs ....................................................................................... 11
2. Charging Infrastructure...............................................................17
2.1 The Charging Challenge....................................................................... 18
2.1.1 Types of EV Charging Equipment................................................................... 19
2.2 Understanding Charging Economics................................................... 24
2.2.1 Fixed Costs.......................................................................................................24
2.2.2 Variable Energy Costs.....................................................................................28
2.3 Modeling Charging Economics............................................................34
2.3.1 Results of the Analysis................................................................................... 36
2.3.2 Commercial Charging.................................................................................... 38
2.3.3 Pricing models................................................................................................ 45
2.3.4 Summary.........................................................................................................47
2.4 Load Management for Large-Scale EV Integration............................48
3. Conclusion.................................................................................... 52
4. References....................................................................................54
Appendices....................................................................................... 59
A.1 Lifetime EV Cost Modeling................................................................... 59
A.2 Charging Infrastructure Base Case Model Assumptions..................60
Belfer Center for Science and International Affairs | Harvard Kennedy School viiCover Image A Tesla Model 3 charges using a Mobile Charger 2.0, 29 July 2017.
Executive Summary
Electric vehicles (EVs) have advanced significantly this decade, owing
in part to decreasing battery costs. Yet EVs remain more costly than
gasoline fueled vehicles over their useful life. This paper analyzes the
additional advances that will be needed, if electric vehicles are to sig-
nificantly penetrate the passenger vehicle fleet.

Battery Prices

Cell costs have plummeted to $145 per kWh or lower, and are
expected to continue falling with technological improvements and
returns to large-scale production. While cells are only one component
of the cost of an installed battery, the cost of installed batteries has
declined from around $1,000 per kWh in 2010 to an estimated $250-
350 per kWh in 2018. Total battery costs are falling more slowly, as
consumers demand EVs with longer ranges and thus larger batteries.
Meanwhile, governments are finding it increasingly difficult to fiscally
justify large subsidies to attract buyers.

Will Declining Battery Costs Make EVs Competitive?

This paper compares the lifetime costs of battery-only cars (BEVs),
plug-in hybrids (PHEV) and gasoline-fueled internal combustion-en-
gined vehicles (ICE), using a range of gasoline prices, discount rates,
and battery costs. The PHEV is more expensive than the ICE in
almost all scenarios, while the BEV is robustly cost-competitive, once
installed battery prices reach $200-$250 per kWh. Hence, further
reductions in battery costs will still be needed for BEVs to be a viable
alternative to ICEs.

The paper compares the lifetime costs of the Chevrolet Bolt BEV to
the costs of an equivalent PHEV and ICE, using a range of gasoline
prices, discount rates, and battery costs. The PHEV is more expensive

                 Belfer Center for Science and International Affairs | Harvard Kennedy School   1
than the ICE in almost all scenarios, while the BEV is cost-competitive
once battery prices reach $200-$250 per kWh.
Will Charging Infrastructure Support EV Adoption?
Commercial success for EVs will require installing charging infrastructure
that is accessible, easy to use, and relatively inexpensive—whether at home
or in public locations. The form this infrastructure will take is still uncer-
tain, with a range of charging technologies currently available and more
expected to emerge over the next five years. The current range of equip-
ment spans slower alternating current (AC) chargers best suited to home
or office locations and short trips (Level 1-2 in this paper), and much faster
direct current fast chargers (DCFC) for rapid refueling in public locations,
best suited for recharging on longer journeys (Level 3-5). The time taken
to add 100 miles of range varies from 26 hours for the slowest AC charger,
to six minutes for the fastest DCFC charger—still far slower than the 300
miles-per-minute enjoyed by a 30 mile-per-gallon ICE.
The costs of charging infrastructure are both fixed (installation, utility
service, transformers, and equipment) and variable (electricity charges).
For chargers on commercial electricity tariffs, demand charges can domi-
nate operating costs. As a result, the total cost of power from fast charging
stations is higher than slower residential chargers unless the former can
achieve sufficiently high utilization rates.
Modeling different types of charging infrastructure and comparing them
with the operating costs of an ICE suggests that simple home charging
is competitive with today’s more efficient gasoline cars and could be sig-
nificantly cheaper if a time-of-use electricity tariff, with lower prices in
off-peak periods, is in place. More powerful home charging is sensitive to
capital costs, but is competitive with moderately efficient ICEs and sub-
stantially cheaper under a time-of-use tariff. For commercial chargers
(Level 3-5), the price of electricity required for investment in the system
to break even falls sharply at progressively higher utilization rates. At 30%
utilization, all variants are cheaper than fueling an average ICE, and at 40%
utilization, they are competitive with an efficient ICE.
2 Charging the Future: Challenges and Opportunities for Electric Vehicle AdoptionAt current levels of utilization (optimistically, 10%), commercial chargers
are almost universally not economically profitable, suggesting a significant,
sustained increase in demand will be needed for commercial charging
infrastructure to deliver financial returns, and compete with both ICEs and
cheaper residential charging.
Managing additional power demand from EVs is both a challenge and
an opportunity for distribution utilities. High concentration of EV home
charging during peak periods can overload local transformers. Utilities
may have to procure additional peak capacity, unless they are able to shift
demand to off-peak periods. Time-of-use electricity pricing, along with
smart metering, have already been deployed in some states to incentiv-
ize off-peak charging and manage peak loads, respectively. It is unclear
whether they will be sufficient to offset demand increases. Vehicle-to-grid
technology, allowing EVs to serve as mobile electricity storage units, could
complement these efforts but will need adequate incentives, which are not
presently available. Overall, electricity tariff reforms will be essential, if
today’s power systems will be able to serve the additional demand from the
significant deployment of electric vehicles.
Belfer Center for Science and International Affairs | Harvard Kennedy School 3Introduction
Over the past decade there has been a growing interest, bordering on
enthusiasm, for electric vehicles. Is the American motorist on the cusp
of replacing gasoline-powered cars with electric versions? Will gasoline
stations be superseded by fast charging stations? Will the transportation
sector of the future be electrified? These questions are at the core of the
energy and transport debates. Governments have enacted subsidy pro-
grams, supported the installation of a charging infrastructure, and are
starting to develop regulatory initiatives to support and manage an electric
vehicle fleet. In fact, some governments—including the United Kingdom
and France—have announced that they will not permit the sale of new fos-
sil-fueled automobiles after 2040.1 The car manufacturers that were initially
skeptical about electric vehicles are now committing billions of dollars to
their production. By 2022 there will be 127 different fully battery-electric
car models available for purchase in the United States.2
Is this euphoria justified by the state of the technology and by economic
and financial realities? Six years ago, a Harvard paper attempted to address
this question.3 Its conclusion was that under most business-as-usual sce-
narios, efficient fossil-fueled automobiles would continue to have a cost ad-
vantage over electric vehicles. At the time, the future of electric vehicles de-
pended largely on a combination of high government subsidies, extremely
high gasoline prices (over $4.50 per gallon), and dramatic improvements in
battery technology. Today, the outlook is more positive, but several of the
same unresolved questions remain. Will battery powered electric vehicles
be competitive with conventional gasoline-fueled vehicles in the next five
to ten years? Will a cost-effective charging infrastructure emerge? What are
the economic and financial challenges that must be overcome?
1 Ryan, C. and J. Shankleman. 26 July 2017. “U.K. Joins France, Says Goodbye to Fossil-Fuel Cars by
2040”. Bloomberg. https://www.bloomberg.com/news/articles/2017-07-25/u-k-to-ban-diesel-and-
petrol-cars-from-2040-daily-telegraph
2 Naughton, K. 19 December 2017. “The Near Future of Electric Cars: Many Models, Few Buyers”.
Bloomberg. https://www.bloomberg.com/news/features/2017-12-19/the-near-future-of-electric-
cars-many-models-few-buyers
3 See Lee, H. and G. Lovellette. 2011. “Will Electric Cars Transform the U.S. Market?” Harvard Kenne-
dy School Faculty Research Working Paper Series RWP11-032. https://research.hks.harvard.edu/
publications/getFile.aspx?Id=715
4 Charging the Future: Challenges and Opportunities for Electric Vehicle AdoptionFirst, over the past six years, battery costs have fallen significantly, but the
size of battery packs has increased. In other words, in the course of ad-
dressing range anxiety, the total cost of an EV battery pack has declined
more slowly than the cost per kilowatt-hour (kWh). As a result, installed
battery costs continue to be a barrier to widespread consumer acceptance.
This paper reviews the status of these costs and the levels that must be
reached if electric cars are to become cost-effective alternatives.
Second, while battery costs have attracted the interest and the pocket
books of both car manufacturers and the electronics industry (Samsung,
LG, Panasonic etc.), the challenges around designing and operating a fi-
nancially viable charging infrastructure to serve EV batteries remain. There
are different types of home-charging equipment, and multiple commer-
cial-charging station configurations, with no clear winner in the current
market. Who will develop a commercially profitable plan to charge the
electric cars of the future—the electric utility companies? The automobile
manufacturers? The equipment manufacturers? Or third-party investors?
None of these candidates has yet to implement a sustainable long-term
business plan. The good news is that manufactures, utilities and other
parties are moving quickly to develop inter and intra-city charging options,
but significant regulatory and financial complexities may retard widespread
economically sustainable deployment. This paper examines these com-
plexities, and how they affect the cost of fueling and operating an electric
vehicle.
Belfer Center for Science and International Affairs | Harvard Kennedy School 51. Battery Technology
Improvements in battery technology over the past six years have been
impressive. Today’s battery cells have higher energy densities and are much
less expensive on a per kWh basis than they were just a few years ago.
Lithium-ion (Li-ion) cells enjoy the bulk of investment, and remain the
preferred technology for LG Chem, Panasonic, and Samsung, the three
largest producers. Lithium-metal technologies with much higher energy
densities are in development, but currently lack the production scale and
established supply chain advantages of Li-ion.4
Verifiable information on battery costs is difficult to obtain, owing to both
intense commercial sensitivity and confusion over the definition of “bat-
tery”—which can apply to the cost of individual cells, the battery pack, or
the battery pack once installed in the vehicle itself, or indeed the final cost
to the consumer once any manufacturer markup is applied. These distinc-
tions are explained below, and unless otherwise stated, “battery costs” in
subsequent sections of this paper refer to the total cost to the consumer.
The sharp downward trend in the cost of Li-ion cells, however, is clear.
From a baseline of about $1,000 per kWh for an installed battery. Cell
manufacturing costs have declined about 70% since 2010 due primarily to
economies of scale.5 This holds across different configurations and chem-
ical compositions, and is the largest contributor to observed cost declines,
with an average of 8% cost reduction for a doubling in volume every year
since 2010.6 Compounded from 2010-2015, this equates to a 35% real
decline in cost due to economies of scale, accounting for almost half of
the total cost reductions seen since 2010. Nykvist and Nilsson’s (2015)
study concurs with this finding, attributing 30% of cost reductions from
2013-2017 to economies of scale, and the remainder to declines in material
4 Samsung, among others, has been developing graphene-based battery technologies. Despite
recent research advances, the technology is still focused on mobile device applications. It remains
some distance from commercialization in any form, and further away from deployment at the scale
required for a car battery. Jung-a, S. 27 November 2017. “Samsung hails “graphene ball” battery
success”. Financial Times. https://www.ft.com/content/5a6693f0-d349-11e7-8c9a-d9c0a5c8d5c9
5 Boston Consulting Group. 2010. “Batteries for Electric Cars: Challenges, Opportunities and the
Outlook to 2020.” Boston, MA: Boston Consulting Group.
6 Faguy, P. 2015. “Overview of the DoE Advanced Battery R&D Program”. U.S. Department of Energy.
https://energy.gov/sites/prod/files/2015/06/f23/es000_faguy_2015_o.pdf
6 Charging the Future: Challenges and Opportunities for Electric Vehicle Adoptioncosts and learning rates, with an estimated combined annual cost decline
(including both learning rate and returns to scale) of 12-14%.7
As noted already, cell costs are only a part of the total installed cost of the
battery. Using available information on battery sales to manufacturers,
McKinsey’s 2017 Electrifying Insights report implies an underlying Li-ion
cell cost of approximately $150 per kWh at the end of 2016, and an addi-
tional cost of roughly $70-100 per kWh to convert cells into battery packs.
McKinsey’s figures correspond with the more optimistic end of projec-
tions from earlier studies, citing an installed battery pack cost (to the car
manufacturer) of $227 per kWh in 2016.8 This is roughly in line with U.S.
Department of Energy trend estimates that put battery pack costs for 14
kWh plug-in hybrid EVs (PHEVs) at $289 per kWh in 2015, with poten-
tial for economies of scale alone to push this down further to $200 per
kWh.9 By McKinsey’s estimate, battery pack costs are projected to fall to
$190 per kWh by 2020.10 The McKinsey report implies that these decreases
will come primarily as a result of further technological advances in the
production of the cells themselves, rather than reductions in capital costs
stemming from scaled-up efficiency, but the report does not explain where
specifically these advances will be made.
The International Energy Agency’s 2018 Global Electric Vehicle Outlook
estimates cell costs at $145 per kWh, and gives its range of estimates for
installed battery pack costs at $155-$360 per kWh, depending heavily on
production scale and battery size. Their mid-range estimate of the total
cost to the consumer is $274 per kWh, based on comparing pricing of
models with ICE and BEV powertrains.11 This in turn implies the differ-
ence between cell cost and total cost to the consumer is in the vicinity of
$130 per kWh. Given the inherent uncertainties in these estimates, we
assume this difference is between $100-$200 per kWh, implying a total
cost to the consumer of $245-$345 per kWh (see Table 1.1). This additional
cost reflects an additional manufacturer mark-up over the cost of materials
7 Nykvist, B. and M. Nilsson. 2015. “Rapidly falling costs of battery packs for electric vehicles”. Nature
Climate Change 5: 329-332. doi:10.1038/nclimate2564.
8 McKinsey & Company. 2017. “Electrifying Insights - How auto makers can drive electrified vehicle
sales and profitability.” New York, NY: McKinsey & Company.
9 Faguy, P. 2015. “Overview of the DoE Advanced Battery R&D Program.”
10 McKinsey & Company. 2017. “Electrifying Insights.”
11 International Energy Agency. Global EV Outlook 2018: Towards cross-modal electrification. p.66.
Belfer Center for Science and International Affairs | Harvard Kennedy School 7and assembly to recover capital investment and research and development,
and to achieve a rate of return. In the latter case, there may be substantial
variation across manufacturers, depending on whether their electric vehi-
cle sales are intended to be profit-making. Assuming that the existing price
ranges reflect some form of manufacturer discount to boost demand, we
contend that financially sustainable pricing is currently in the $300-$400
per kWh range.12
Table 1.1 Battery cost estimates across stages of production
Stage of Production Estimated Cost per kWh
Cell cost
Purchasing Lithium-ion cells from the cell $145
manufacturer
Pack assembly
Arranging cells into a battery pack
Pack covering and preparation $215-245
Wrapping battery in protective materials (combined cost implied from difference
ready for installation between cell cost and installed cost, using
McKinsey $70-$100 estimate)
Installed pack
Installation into the vehicle. Includes wiring,
circuitry and inverters
Total cost to consumer $245-345
Price markup between capital cost to man- (total cost implied from difference between
ufacturer and price charged to consumer. cell cost and total cost to consumer, using a
Covers additional labor and capital costs to $100-$200 estimate implied from IEA $274
OEM. mid-range figure)
Battery pack prices are generally difficult to ascertain with any precision
and the ultimate cost to the consumer depends on supply chain dynamics,
manufacturer mark-up, and scale. In Table 1.1, we break down estimates
of the various components of battery costs. While the figures for cell cost,
installed cost, and final cost (including markup) are roughly consistent,
the largest information gap is in the stages between purchasing cells and
installing the battery pack into an EV drivetrain (including pack assembly,
covering it with protective material, wiring, circuitry, safety measures, and
an AC/DC inverter). Allowing for a wide margin of error, it is reasonable
12 As noted below, the Chevrolet Bolt is an example of a loss-making vehicle. It is often unclear in
these cases whether discounted pricing is applied to the batteries or the vehicle as a whole, and
whether it is part of a strategy to stimulate demand, or to avoid penalties for non-compliance with
clean vehicle regulations.
8 Charging the Future: Challenges and Opportunities for Electric Vehicle Adoptionto conclude that the total cost of an EV battery by the end of 2017 was in
the region of $250-$350 per kWh, and likely to fall as competitive pressure
builds, technology improves, and large-scale production continues to pro-
duce returns to scale.
1.1 Challenges to Wider Deployment
The declining per-kWh cost of batteries is happening at the same time
that battery pack sizes are increasing. In search of increased range, man-
ufacturers are augmenting the size of battery packs on new models. The
base-model Nissan Leaf powertrain grew from 24 kWh to 30 kWh for the
first generation, then to 40 kWh for the second generation (announced in
September 2017),13 while Tesla’s Model S base model has grown from offer-
ing 60 kWh, to 70 kWh, with a 100 kWh model released in August 2016.14
The delicate balance between using larger batteries to improve perfor-
mance and range, and keeping costs affordable, is not lost on an industry in
which “unfavorable battery economics will remain a profitability barrier for
the next two to three product cycles”.15
Nonetheless, OEMs are investing heavily in building up EV production
capacity. In addition to offering a PHEV version of every model it makes,
Volkswagen Group expects to offer 30 battery-only electric vehicles (BEVs)
by 2025, making up 25% of all new sales,16 while Ford plans 13 BEV
models by 2022. The Chinese government has a target of 8% of all sales
being BEVs or PHEVs in 2018, and a coalition of eight U.S. states, includ-
ing California, is aiming for a total of 3.3 million EVs on their roads by
2025.17 In Norway, BEVs and PHEVs accounted for a third of new sales in
2016, with a target of 400,000 BEVs by 2020. Norway’s success is at least
13 Nissan USA. 2017. “Build your 2018 Nissan Leaf.” https://www.nissanusa.com/electric-cars/2018-
leaf/configure/
14 Lambert, F. 2016. “Tesla’s new Model S P100D is not only quick, it’s the first all-electric car with
over 300 miles of range.” Electrek. https://electrek.co/2016/08/24/tesla-model-s-p100d-first-all-
electric-car-over-300-miles-range/
15 McKinsey & Company. 2017. “Electrifying Insights.”
16 Campbell, P. 26 July 2016. “Electric cars see range, battery and ease of charging as barriers
to mass adoption.” Financial Times. https://www.ft.com/content/8f79ae6e-2400-11e6-9d4d-
c11776a5124d
17 The Economist. 18 February 2017. “Volts wagons: Electric cars are set to arrive far more speedily
than anticipated.”
Belfer Center for Science and International Affairs | Harvard Kennedy School 9partly due to exceptionally low hydroelectric power costs for charging, and
effective policy measures offering a host of additional benefits to EV driv-
ers (including free parking and charging) and exemptions from purchase
taxes that typically double the cost of a gasoline powered vehicle.18
Meeting this expected EV demand will require an unprecedented build-up
of battery procurement capacity and capital investment, with the transition
likely to be loss-making in the short term as established OEMs shift cap-
ital and labor resources rapidly towards EV mass-production. U.S. bank
Morgan Stanley projects Volkswagen’s entire automobile business may be
loss-making from 2025-2028 as a consequence.19 Affordable supplies of
critical materials for battery manufacturing, notably cobalt, may be placed
under pressure, while assembly plants will require large capital investments
to scale up EV production sufficiently.20
1.2 Subsidies
The U.S. federal credit instituted by the Obama Administration of up to
$7,500 per car, depending on the capacity of the battery, is valid for up
to 200,000 PHEVs or BEVs sold and registered with the Department of
Transport by each independent manufacturer, regardless of model. From
the 200,000th vehicle onwards, the program is phased out so as not to dis-
rupt the market or confuse consumers. The full $7,500 credit continues
through to the end of the financial quarter in which the 200,000th vehicle
is produced, and through the following quarter. The maximum credit falls
to $3,750 for the following six months, and $1,875 for the next six months
after that, before expiring completely. Between selling the 200,000th vehi-
cle and the credit’s expiration, the manufacturer can build and sell an
18 The Economist. 18 February 2017. “Northern light: Sales of green vehicles are booming in Norway.”
http://www.economist.com/news/business/21717063-ever-more-electric-cars-are-road-next-
step-build-charging-network-support
19 The Economist. 18 February 2017. “Volts wagons: Electric cars are set to arrive far more speedily
than anticipated.”
20 Lithium market dynamics are certainly an area for further exploration in terms of geopolitics, trade
and economic scarcity, but not expanded upon here because lithium typically only comprises 1-3%
of battery costs, so even in the event of large demand spikes, is unlikely to affect battery prices very
much.
10 Charging the Future: Challenges and Opportunities for Electric Vehicle Adoptionunlimited number of EVs, receiving the applicable incentive for all cars
produced within the authorized period.21
Additional subsidies are available in some states. California’s existing pro-
gram is three times higher than most other states, but most EVs are not
eligible for the full amount, typically enjoying a maximum rebate of $2,500.
Unfortunately for California EV buyers, the allocated funds were exhausted
as of June 30, 2017, at which point only low-income applicants remained
eligible.22 The California Air Resources Board is scheduled to release a
study in early 2019 on the appropriate size of any future subsidy. Else-
where, governments have found subsidies for electric vehicles to be fiscally
unsustainable. China, Denmark, Norway, and France, amongst others, are
in the process of replacing direct financial subsidies with increased regula-
tory programs, such as exemptions from highway tolls or excise fees.23
While subsidies may provide benefits in terms of learning, a sustainable
transition to electric vehicles will not be driven by generous govern-
ment subsidies, but rather by fundamental economics and technology
improvement.
1.3 Lifetime Costs
The fully-electric Chevrolet Bolt, with an approximate 238-mile range
and list price of $37,495, is priced at $27,500 once the $7,500 federal sub-
sidy and an average $2,500 state subsidy are accounted for. The list price
of the Tesla Model 3 (with a range of 200 miles), starting at $33,000, is
reduced to $23,000 once subsidies are accounted for, but this discount
will not continue much longer, as Tesla’s eligibility for the full federal
subsidy starts to expire.
21 Internal Revenue Service. 2017. “Plug-In Electric Drive Vehicle Credit (IRC 30D).” https://www.irs.
gov/businesses/plug-in-electric-vehicle-credit-irc-30-and-irc-30d
22 California Clean Vehicle Rebate Project. 2017. “Vehicles and Eligibility.” https://cleanvehiclerebate.
org/eng
23 Hertzke, P., Müller, N. and S. Schenk. July 2017. “Dynamics in the global electric vehicle market.”
McKinsey & Company. https://www.mckinsey.com/industries/automotive-and-assembly/our-in-
sights/dynamics-in-the-global-electric-vehicle-market
Belfer Center for Science and International Affairs | Harvard Kennedy School 11We constructed a simple financial model to compare the net present cost,
over a ten-year lifetime, of a Chevrolet Volt (PHEV), Chevrolet Bolt (BEV)
and a comparable ICE, the Chevrolet Impala.24 The results are summarized
in Table 1.2. To provide some indication of the true comparability of EVs
with ICEs, federal or state subsidies are not included in our calculations of
the total cost of ownership. The Swiss bank UBS estimates that General
Motors will lose $7,400 on the sale of each Bolt, implying it would have to
price the car at $44,895 to break even.25 Other sources quote the loss to
be as high as $9,000 per vehicle, implying a breakeven price of $46,495.26
However, for each Bolt sold in California (its largest market), GM receives
four Zero-Emission Vehicle (ZEV) credits valued at about $4,000 each,
meaning it can still ultimately make a profit on each sale. In the absence
of independent verification of the loss estimates, we assume these loss
estimates are exaggerated and that the actual loss is half of the maximum
quoted figure (i.e. $4,500)—implying a breakeven price of $41,995. We
compare the ICE’s total cost of ownership at list price ($27,095) to the Volt
at list price ($33,220), and the Bolt, at its list price ($37,495), and its sug-
gested breakeven price ($41,995), to understand what it might take for the
Bolt to be profitable.
24 The Impala is chosen as it is likely more representative of mass-market models being produced
by major European and American manufacturers in the next 5-10 years than the more luxurious,
upmarket models favored by Tesla.
25 UBS. 18 May 2017. “Q-Series: UBS Evidence Lab Teardown—Disruption Ahead?” http://www.advan-
tagelithium.com/_resources/pdf/UBS-Article.pdf.
26 Welch, D. and J. Lippert. 2016. “GM’s Ready to Lose $9,000 a Pop and Chase the Electric Car
Boom.” Bloomberg. https://www.bloomberg.com/news/articles/2016-11-30/gm-s-ready-to-lose-9-
000-a-pop-and-chase-the-electric-car-boom.
12 Charging the Future: Challenges and Opportunities for Electric Vehicle AdoptionTable 1.2 Net present cost comparison of representative BEV (Chevrolet
Bolt) and PHEV (Chevrolet Volt) models, without subsidies and
assuming cars are charged at home on residential rates. ICE
(Chevrolet Impala) is basis for cost comparison.
Gas = gas price per gallon, r = discount rate.
Additional cost (savings) vs. ICE
Battery: $400/kWh
PHEV BEV BEV
(list price) (list price) (breakeven price)
Gas $2.10, r = 10% $5,680 $6,029 $10,529
Gas $2.50, r = 10% $4,643 $4,755 $9,255
Gas $3.00, r = 10% $3,346 $3,163 $7,663
Gas $2.10, r = 15% $5,762 $6,830 $11,330
Gas $2.50, r = 15% $4,915 $5,789 $10,289
Gas $3.00, r = 15% $3,855 $4,489 $8,989
Gas $2.10, r = 20% $5,822 $7,418 $11,918
Gas $2.50, r = 20% $5,114 $6,548 $11,048
Gas $3.00, r = 20% $4,229 $5,462 $9,962
Additional cost (savings) vs. ICE
Battery: $300/kWh
PHEV BEV BEV
(list price) (list price) (breakeven price)
Gas $2.10, r = 10% $3,880 $29 $4,529
Gas $2.50, r = 10% $2,843 ($1,245) $3,255
Gas $3.00, r = 10% $1,546 ($2,837) $1,663
Gas $2.10, r = 15% $3,962 $830 $5,330
Gas $2.50, r = 15% $3,115 ($211) $4,289
Gas $3.00, r = 15% $2,055 ($1,511) $2,989
Gas $2.10, r = 20% $4,022 $1,418 $5,918
Gas $2.50, r = 20% $3,314 $548 $5,048
Gas $3.00, r = 20% $2,429 ($538) $3,962
Belfer Center for Science and International Affairs | Harvard Kennedy School 13Additional cost (savings) vs. ICE
Battery: $200/kWh
PHEV BEV BEV
(list price) (list price) (breakeven price)
Gas $2.10, r = 10% $2,080 ($5,971) ($1,471)
Gas $2.50, r = 10% $1,043 ($7,245) ($2,745)
Gas $3.00, r = 10% ($254) ($8,837) ($4,337)
Gas $2.10, r = 15% $2,162 ($5,170) ($670)
Gas $2.50, r = 15% $1,315 ($6,211) ($1,711)
Gas $3.00, r = 15% $255 ($7,511) ($3,011)
Gas $2.10, r = 20% $2,222 ($4,582) ($82)
Gas $2.50, r = 20% $1,514 ($5,452) ($952)
Gas $3.00, r = 20% $629 ($6,538) ($2,038)
The analysis accounts for fuel costs and maintenance costs, calculated and
discounted annually. Maintenance costs are highest for the two-engined
PHEV, and lowest for the BEV which has a comparatively simple elec-
tric motor. Assuming a $400 per kWh final battery cost as the base case
(the higher end of our estimates), we varied final battery costs, gasoline
prices, and discount rates to assess their effect on EV competitiveness.27
We assume all EV charging takes place at home and is billed at $0.1759
per kWh, the average 2016 domestic electricity rate in California (the U.S.’
largest EV market).28 Average annual mileage is derived from the 2016
U.S. figure of 13,476 miles per year, or 36.9 miles per day.29 The combined
average energy consumption of a BEV on the market today, according to
the U.S. EPA, ranges from 0.27 kWh per mile for the Volkswagen e-Golf
and BMW i3, to 0.32 kWh per mile for the Tesla Model S.30 Unless oth-
erwise stated, this analysis assumes a higher figure of 0.37 kWh per mile
27 Recent research has identified an implied discount rate for individual vehicle purchases of 15%.
See Allcott, H. and N. Wozny. 2014. “Gasoline Prices, Fuel Economy, and the Energy Paradox.” The
Review of Economics and Statistics. Vol. 96, No.5. 779-795. doi:10.1162/REST_a_00419
28 U.S. Energy Information Administration. 2017. “Electricity data browser.” https://www.eia.gov/elec-
tricity/data/browser/.
29 Federal Highway Administration. 2016. “Average Annual Miles per Driver by Age Group.” U.S. Depart-
ment of Transportation. https://www.fhwa.dot.gov/ohim/onh00/bar8.htm
30 U.S. Department of Energy. 2017. “2018 Best and Worst Fuel Economy Vehicles.” http://www.fuele-
conomy.gov/feg/best-worst.shtml
14 Charging the Future: Challenges and Opportunities for Electric Vehicle Adoptionto accommodate systematic downward bias in official fuel economy esti-
mates31 and more aggressive driving styles. We vary the gasoline prices to
cover a range from the low and high prices of the last three years, and we
use three discount rates 10%, 15% and 20% (designated by “r” in Table 1.2).
Most economists and most OEMs use the higher discount estimates, since
American car buyers tend to hold their cars for less than the useful life of
the vehicle. See Appendix A1 for a full list of assumptions.
The figures in Table 1.2 suggest that at battery prices greater than $300
per kWh, hybrid vehicles (PHEVs) are more costly than ICEs, and only
cheaper at $200 per kWh under high gas prices and low discount rates. At
the (ICE) Chevrolet Impala’s 26 miles per gallon (mpg), gasoline fuel costs
range from $0.08 per mile ($2.10 per gallon) to $0.11 per mile ($3.00 per
gallon), while the (PHEV) Volt averages 42 miles-per-gallon equivalent,
or $0.05-$0.07 per mile, for the 70% of the time it is assumed to run as a
gasoline-electric hybrid, for the remaining 30% of the time, running on
electricity alone, it costs $0.1759 per kWh, or $0.065 per mile.
BEVs are more competitive. The Chevrolet Bolt, on 100% battery power
and assuming residential charging rates, costs $0.065 per mile to run—sig-
nificantly cheaper to fuel than the ICE. If the installed battery costs are
reduced below $200, the BEV will be less expensive than the ICE and will
be close to cost competitive at battery prices below $250 per kWh. It is
important to remember that these cost figures are for installed batteries
and are without subsidies. The BEV price is more sensitive to lower battery
prices than the PHEV. It also incurs lower maintenance costs than a PHEV
having just one motor rather than two, with few moving parts. Unsurpris-
ingly, then, at a battery cost of $200 per kWh, the BEV’s net present cost is
$4,600-$8,800 cheaper than the ICE, and even more so when compared to
the PHEV.
However, there is strong evidence to suggest that the electric vehicle manu-
facturer’s list price is set significantly below actual costs. Once the assumed
$4,500 loss is accounted for (i.e. applying the breakeven price), the BEV has
a $7,700-$11,900 higher net present cost than the ICE at $400 per kWh. At
31 Tanaka, S. 2018 forthcoming. “Mind the Gap! Tax Incentives and Incentives for Manipulating Fuel
Efficiency in the Automobile Industry.”
Belfer Center for Science and International Affairs | Harvard Kennedy School 15$200 per kWh, the BEV is cheaper in every scenario by between $80 and
$4,300. This suggests that while selling BEVs at a loss may make sense to
gain market share, experience in the BEV market, further reductions in
final battery costs, or lower electricity prices, will still be needed for BEVs
to be a viable long-term alternative to an ICE. Further, as ICEs and PHEVs
are becoming incrementally more fuel-efficient, the competitive pressures
on BEVs are not likely to abate.
Our analysis would benefit from more reliable cost data to gauge with pre-
cision which factors will be important in driving down the present cost of
installed batteries and thus BEVs. Consumer research indicates that poten-
tial EV buyers price in other factors into their purchase decision (including
persistent, if not necessarily warranted, concerns over vehicle safety and
range anxiety).32 PHEVs, while appearing less competitive than BEVs in
the figures above, may have practical advantages over BEVs not reflected in
our cost analysis.
On the other hand, trends in battery costs and the prices of EVs are declin-
ing. If these trends continue, electric vehicles could be cost competitive
with gasoline power cars over their lifetime early in the next decade. This
does not mean that ICEs are in danger of losing their markets, since it will
take time for consumers to become comfortable with electric vehicles and,
as we discuss in the next few sections, the absence of a charging infrastruc-
ture remains a major barrier.
32 McKinsey & Company. 2017. “Electrifying Insights.”
16 Charging the Future: Challenges and Opportunities for Electric Vehicle Adoption2. Charging Infrastructure
Without an accessible infrastructure that can re-charge an EV in a reason-
able period of time, most motorists will be unwilling to purchase one, even
if it is cheaper and its performance is better. Admittedly, the risk of being
stranded without power is small, but it is one that today’s motorists have
not faced in the vehicles that they have driven throughout their lifetimes.
The commercial success of the electric vehicle will require the development
of a charging infrastructure that is accessible, easy to use, and relatively
inexpensive. While there are many charging technologies available and
more in the pipeline, there is no consensus on what an effective infrastruc-
ture will look like thirty years from now. In fact, there is less certainty in
2018 than there was six years ago, when BEV batteries were smaller, and
relatively inexpensive to charge. Plugging a 24 kWh Nissan Leaf into a
normal “Level 1” 1.4 kW residential outlet in the evening and unplugging
it the next morning would recharge half the battery, require no additional
capital outlay, and the electricity would cost approximately $60 per month,
assuming the vehicle was charged every day. Impatient or heavy users
could install a “Level 2” 220-volt (6.6 kW) system for $1,500-$2,200 and
fully recharge their Leaf in seven hours.33
These options become less attractive when the BEV has a 70-100 kWh
battery, which will be more common as the BEV industry attempts to
overcome consumer range anxiety. It would take fifty hours to fully charge
a 70 kWh Tesla Model S from a normal wall outlet, and almost eleven
hours with a 220-volt, 6.6 kW line. Tesla has developed a home charging
system that can triple the electric output of a 220 volt line,34 bringing
recharging time down to under four hours, but total installed costs of the
charging equipment can reach $4,000-$6,000 depending on the buyer’s
specific requirements.35 If these newer BEVs are being driven long dis-
tances between charges, home charging technology will have to improve
33 See Lee, H. and G. Lovellette. 2011. “Will Electric Cars Transform the U.S. Market?”
34 See detailed footnote in “Level 1 and 2: Alternating Current,” under section 2.1 below.
35 Tesla has been willing to assume all or part of this cost depending on individual circumstances, but
whether it will continue to do so in the future, and to what degree, is uncertain and the financial
sustainability of such a policy depends on cross-selling of other Tesla products, such as home
battery storage systems.
Belfer Center for Science and International Affairs | Harvard Kennedy School 17dramatically or commercial fast-charging stations will have to be widely
deployed if electric vehicles are to compete with gasoline-fueled cars.
Owners of a conventional vehicle are unlikely to switch to an electric car, if
the fueling process is more difficult, time consuming, and uncertain. Com-
mercial fast-charging stations are beginning to emerge in locations across
the U.S., Europe, and Asia, but, in Tesla’s case at least, they are intended to
facilitate the sale of the vehicle, as opposed to being a commercial stand-
alone operation. If these facilities are to be deployed at scale, they will need
to be accessible to all electric car models, and will require viable business
plans—plans that will provide an opportunity for investors to make a posi-
tive return on their investments. All of this is possible, but the uncertainties
around technologies, regulations, and costs will have to be substantially
reduced.
The following section addresses several questions: What are the charging
options that are, and may become, available? What are their costs? How
does the speed of charging infrastructure affect its commercial viability?
To answer these questions, we present a simple financial model to quantify
the underlying economic factors affecting charging. Our focus is on the
capital costs of building and installing charging equipment, the variable
costs of supplying it with electrical power, and the revenue required for
charging infrastructure to break even, including a discussion of the oppor-
tunity cost of time spent waiting for EVs to charge. We conclude by briefly
addressing the economic challenges around load management in scenarios
with high EV penetration, and suggesting avenues for further research.
2.1 The Charging Challenge
Energy efficiency, distributed energy resources, and shifting demand pat-
terns have been a challenge to American electric utilities for some time.
Since 2010, annual electricity demand has been flat or declining in many
regions. In the Southwest alone, annual electricity demand in 2016 was 2.7
18 Charging the Future: Challenges and Opportunities for Electric Vehicle Adoptionmillion MWh less than forecasted.36 Rapid EV deployment will increase
the demand for power, but the existing generating capacity should be able
to meet that demand in most areas of the country, assuming that a percent-
age of that incremental demand occurs in the off-peak hours. Utilities are
less concerned about the eventual magnitude of this incremental demand,
than the form that EV charging might take—how fast, where and when,
and how the power will be priced. These parameters will be critical deter-
minants in the evolution of the EV charging market.
2.1.1 Types of EV Charging Equipment
Charging equipment, henceforth denoted by “electric vehicle supply equip-
ment” (EVSE) comes in two basic varieties. The first, comprising “Level
1” and “Level 2” EVSE, operates using alternating current (AC), and can
draw electricity directly from the local distribution system. 37 All BEVs
and PHEVs carry an on-board inverter with limited capacity, to convert
AC power to direct current (DC), which is required to charge the battery.
The second variety, “Level 3” and above, uses DC charging, which bypasses
the need for an inverter by charging the battery directly and can therefore
deliver much more power. There is otherwise no relevant difference in the
AC and DC charging process. Chargers in public or commercial locations,
typically Level 2 and above, (henceforth “commercial chargers”) may be
standalone devices, or stations comprised of multiple chargers.
Level 1 and Level 2: Alternating Current
Level 1, providing 1.4 kW of power in the U.S., is simply a conventional
wall socket, and requires no additional circuitry, aside from the adapters
required to connect the EV to the socket. In theory, Level 1 charging can
36 Salisbury, M. and W. Toor. 2016. “How Leading Utilities are Embracing Electric Vehicles.” Boulder,
CO: Southwest Energy Efficiency Project. http://www.swenergy.org/data/sites/1/media/docu-
ments/publications/documents/How_Leading_Utilities_Are_Embracing_EVs_Feb-2016.pdf
37 In the U.S., the standard frequency of AC power (the amount of times per second the current re-
verses itself) is 60 Hertz, at a potential of approximately 110 volts. In most other parts of the world,
including Europe, the corresponding values are 50 Hertz and 220 volts, providing twice the power.
This is only relevant for Level 1 (wall-plug) charging, which can take place twice as fast on a 220V
system.
Belfer Center for Science and International Affairs | Harvard Kennedy School 19be used anywhere, although in practice it takes place primarily at the EV
owners’ homes.
Level 2 charging operates on the same upgraded 220-volt outlets, required
by washing machines and clothes driers, and can easily be installed.
More modern houses typically have these outlets, while older houses may
require electrical upgrades. Depending on the home’s electrical infrastruc-
ture, this can involve upgraded circuitry, wiring extensions to reach the
charging location, or, even in rare cases, an upgraded transformer. Level
2 charging can also be provided at workplace locations, other business
locations (hotels, gas stations, private parking lots), and public locations
(on-street parking space, garages, streets, public parking lots—wherever
cars are likely to be stationary for hours at a time). Level 2 charging starts
at a power rating of 6.6 kW, increasing to 19.2 kW depending on the level
of current that the supporting circuitry can sustain. Most home Level 2
charging, and almost all commercial Level 2 charging, is limited to 6.6
kW because (a) the onboard inverter on most existing EVs cannot handle
significantly more than this level38 and (b) boosting the current typically
requires the installation of more expensive higher-capacity circuitry.39
Level 3 and above: Direct Current
Because direct current charging bypasses an EV’s onboard inverter to
charge the battery directly, it can deliver much higher levels of electrical
power. This type of charger is commonly referred to as a Direct Current
Fast Charger (DCFC) and is typically used only in commercial locations.
While studies demonstrate that consistently high DCFC usage can accel-
erate deterioration in battery capacity over time, capacity degradation for
38 Additional inverter capacity can be installed, but it will increase the cost of the vehicle.
39 Tesla EVs are one of the few exceptions. The Tesla High-Powered Wall Connector (HPWC), a product
sold separately from its cars, can boost Level 2 charging up to 16.8 kW depending on the available
circuitry and inverter capacity (out of a theoretical Level 2 maximum of 19.2 kW). Being able to use
the HPWC is one of the benefits of driving a Tesla Model S or X, which come with one 10kW onboard
inverter as standard, with an additional 10kW inverter as optional. Being able to take advantage
of the full potential of the HPWC usually requires some form of circuit upgrade from the standard
20-30 amperes, to 60-100+ amperes. Most publicly-subsidized Level 2 EVSE are limited to 6.6 kW
because of federal grant conditions linked to the cost of power and equipment (higher amperage
increases the capital and operating costs of charging). Further, for public Level 2 EVSE subject to
commercial rate schedules and therefore demand charges, it can be in the operator’s interest to
limit peak power.
20 Charging the Future: Challenges and Opportunities for Electric Vehicle Adoptionthe vast majority of users is more closely associated to overall usage than
charging patterns.40 “Estimated Direct Current Fast Charger utilization
rates,” an NREL study concludes, “do not appear frequent enough to sig-
nificantly impact battery life,” suggesting that the thermal management
systems of the battery itself are a more important determinant.41 Self-re-
ported survey data from Tesla drivers suggests that even for the most
frequent users of fast charging, battery capacity is highly unlikely to fall
below 90% of its original rating even after 150,000 miles of usage.42
For the purposes of this paper, DCFC charging is classified as follows:
• Level 3 charging is used to refer to a power delivery of 50 kW;
• Level 4 corresponds to 150kW;
• Level 5 (ultra-fast DCFC) corresponds to 350kW.
Most third-party DCFC chargers are Level 3, operating at about 50kW.
Tesla’s proprietary network of Superchargers, with a typical power output
of 120 kW, is designed to serve Tesla vehicles exclusively and corresponds
most closely to Level 4. Level 5 ultra-fast DCFC, which requires heavy-
duty insulation equipment, has not yet been deployed on a commercial
basis, and no mass-produced EVs can currently handle this level of power.
EVSE operator ChargePoint announced a 400kW charging platform in
January 201743 and a consortium of OEMs (Porsche, Ford, Daimler and
40 Shirk, M. and J. Wishart. 2015. “Effects of Electric Vehicle Fast Charging on Battery Life and Vehicle
Performance. Presented at SAE 2015 World Congress and Exhibition, Detroit, Michigan. 21-23 April
2015. https://avt.inl.gov/sites/default/files/pdf/vehiclebatteries/FastChargeEffects.pdf
41 Neubauer, J., E. Wood, E. Burton, K. Smith and A.A. Pesaran. “Impact of Fast Charging on Life of EV
Batteries.” National Renewable Energy laboratory. Presented at EVS28, KINTEX, Korea. 3-6 May
2015. https://www.nrel.gov/docs/fy15osti/63700.pdf
42 Teslarati. 2017. “Tesla battery degradation analysis reveals how long a battery might last.” http://
www.teslarati.com/how-long-will-tesla-battery-last-degradation/ Tesla Model X and S variants
include an eight-year or 100,000-120,000 mile warranty for the battery itself, while the more recent
Model 3 includes a guarantee for 70% of battery capacity over the full eight-year warranty period.
See Lambert, F. 2017. “Tesla releases Model 3 warranty with new 70% battery capacity retention
guarantee”. Electrek. https://electrek.co/2017/12/20/tesla-model-3-warranty-new-battery-capaci-
ty-retention-guarantee/
43 ChargePoint. 5 January 2017. “ChargePoint Enables the Future of Mobility with Express Plus Electric
Vehicle Charging Platform.” https://www.chargepoint.com/about/news/chargepoint-enables-fu-
ture-mobility-express-plus-electric-vehicle-charging-platform/
Belfer Center for Science and International Affairs | Harvard Kennedy School 21You can also read