FROM LOCAL TO EUROPEAN LOW EMISSION FREIGHT CONCEPTS - Fraunhofer ISI
←
→
Page content transcription
If your browser does not render page correctly, please read the page content below

FROM LOCAL TO EUROPEAN LOW EMISSION FREIGHT CONCEPTS

SUMMARY REPORT 3
LowCarb-RFC–EUROPEAN RAIL FREIGHT CORRIDORS GOING CARBON NEUTRAL

D O L L , KÖ H L E R , S I E V E R S , G R I M M , H O RVAT
(FRAUNHOFER ISI)
E I BA N D, GÖ R T Z , R E M M E R T, KLU K A S (F R AU N H O F E R I M L)   Funded by
MAIBACH AND PETRY (INFR AS)
SCHADE AND MADER (M-FIVE GMBH)
VA N H A SS E L A N D VA N E L S L A N D E R ( T P R ,
UNIVERSIT Y OF ANT WERP)
KENNY (TRANSPORT & ENVIRONMENT)
NIKLAS SIEBER
FROM LOCAL TO EUROPEAN LOW EMISSION FREIGHT
                                                               CONCEPTS

                                                               SUMMARY REPORT 3

                                                               LowCarb-RFC–EUROPEAN RAIL FREIGHT CORRIDORS GOING CARBON NEUTRAL

FUNDED BY                                                      Claus Doll, Jonathan Köhler, Luisa Sievers, Anna Grimm, Djerdj Horvat (Fraunhofer ISI)
                                                               Agnes Eiband, Dorothe Görtz, Maximiliane Remmert, Achim Klukas (Fraunhofer IML)
                                                               Markus Maibach, Christoph Petry (INFRAS)
                                                               Wolfgang Schade, Simon Mader (M-Five GmbH)
                                                               Edwin van Hassel, Thierry Vanelslander (TPR, University of Antwerp)
                                                               Samuel Kenny (Transport & Environment)
                                                               Niklas Sieber

CONSORTIUM

Fraunhofer Institute for Systems and Innovation Research ISI
(Project Coordinator)

Fraunhofer Institute for Material Flows and Logistics IML

                                                               Karlsruhe, March 2019
EDITORIAL INFORMATION                                                                    CONTENT
FROM LOCAL TO EUROPEAN LOW EMISSION FREIGHT CONCEPTS

SUMMARY REPORT 3

LowCarb-RFC–EUROPEAN RAIL FREIGHT CORRIDORS GOING CARBON NEUTRAL
                                                                                         1   INTRODUCTION––––––––––––––––––––––––––––––––––––––––– 7
Claus Doll, Jonathan Köhler, Luisa Sievers, Anna Grimm, Djerdj Horvat (Fraunhofer ISI)
                                                                                             1.1   Background                                                               7
Agnes Eiband, Dorothe Görtz, Maximiliane Remmert, Achim Klukas (Fraunhofer IML)
                                                                                             1.2   Context: the LowCarb-RFC study                                           8
Markus Maibach, Christoph Petry (INFRAS)
                                                                                             1.3   Purpose and structure                                                    8
Wolfgang Schade, Simon Mader (M-Five GmbH)
Edwin van Hassel, Thierry Vanelslander (TPR, University of Antwerp)
Samuel Kenny (Transport & Environment)                                                   2   LOCAL SCENARIOS FOR NORTH RHINE-WESTPHALIA – – ––––––––––––––– 11
Niklas Sieber
                                                                                             2.1   Introduction to the NRW Case                                            11
                                                                                             2.2   Current freight transport conditions in NRW                             11
Karlsruhe, March 2019
                                                                                             2.3   Defining local scenarios for NRW                                        14

Funded by
Stiftung Mercator Foundation and European Climate Foundation                             3   MODE SHARE AND INFRASTRUCTURE NEEDS
                                                                                             ASSESSMENT––––––––––––––––––––––––––––––––––––––––– 17
Edited by
                                                                                             3.1   Traffic development in the scenarios and impact on the infrastructure   17
Fraunhofer ISI
                                                                                             3.2   Required investments                                                    18
                                                                                             3.3   Reality check                                                           20
                                                                                             3.4   Discussion                                                              22

                                                                                         4   WIDER ECONOMIC AND LABOUR MARKET IMPACTS–––––––––––––––––– 25
                                                                                             4.1   Modelling results                                                       27
                                                                                             4.2   Interpretation                                                          29

                                                                                         5   ENVIRONMENTAL AND SAFETY IMPACTS–––––––––––––––––––––––– 31
                                                                                             5.1   Scope                                                                   31
                                                                                             5.2   Unit values for emissions and incidents                                 31
                                                                                             5.3   Results                                                                 33
                                                                                             5.4   Discussion                                                              35
                                                                                             5.5   Climate resilience and new technologies                                 36

                                                                                         6   COMPARING THE NRW CASE TO TRANS-EUROPEAN FREIGHT CORRIDORS–––– 37
Contact:
                                                                                             6.1   Different transport scenarios                                           37
Claus Doll
                                                                                             6.2   Differences in sustainability assessment                                38
Fraunhofer Institute for Systems and Innovation Research ISI
                                                                                             6.3   The role of local rail freight transport                                39
Breslauer Str. 48, 76139 Karlsruhe, Germany
Tel.: +49 721 6809-354
Email: claus.doll@isi.fraunhofer.de
www.isi.fraunhofer.de
7 TRANSFORMING INSTITUTIONS AND TECHNOLOGY ABSTRACT
REGIMES–––––––––––––––––––––––––––––––––––––––––––– 41
7.1 Basic approach to institutional change 41
7.2 Key messages on change management 41
7.3 Technology investment programmes 42
8 POLICY SUGGESTIONS AND RECOMMENDATIONS – – ––––––––––––––––– 43
8.1 Investment needs for NRW 43
This third and final summary report of the study LowCarb-RFC turns the attention on low carbon emission scenarios
8.2 Economic and social impacts for NRW 44
from the European perspective to the German region of North Rhine-Westphalia (NRW). For NRW we developed
8.3 Environmental impacts for NRW 44
and assessed specific rail modal shift and road electrification scenarios towards 2050. To achieve profound cuts
8.4 Strategic policy recommendations 44
in GHG emissions we find that planning periods need significant shortening, and system transition has to start
8.5 Industry structures and business models 45
immediately. In particular, new technologies to boost rail capacity are needed as shifting all rail freight to electric
8.6 Final remarks 46
trucks would require inconceivable road network expansions.
9 ANNEX––––––––––––––––––––––––––––––––––––––––––––– 49 Total investment costs between 2015 and 2050 range between 15 billion euros for a lower bound rail investment
case to 19 billion euros for motorway electrification and expansion. None of these costs create major disruptions
to the NRW economy or labour market and thus do not constitute an excuse for not acting.
The NRW case study finds lower GHG reduction potentials, −16 per cent, than the European corridors studies
(−28 to −43 per cent) for the railway expansion and modal shift scenarios. For road electrification all cases find a
potential of some −60 per cent. Interestingly, also for GHG mitigation costs NRW values are lower in the Pro Rail
case (140 euros per ton CO2-eq.) than in the corridor studies (around 600 euros per ton CO2-eq.). Environmental
and safety external costs suggest that GHG mitigation shall be prioritised. For profound and fast decarbonisation,
all options are needed, including CO2-efficient shipping.
ZUSAMMENFASSUNG
Dieser dritte und letzte Kurzbericht der Studie LowCarb-RFC verlagert die Sichtweise von den europäischen
Korridoren auf die Region Nordrhein-Westfahlen (NRW). Für NRW wurden spezifische Nachfrageszenarien bis
2050 entwickelt und bewertet. Für das Erreichen umfangreicher THG-Reduktionen müssen Planungszeiten
deutlich verkürzt und die Systemtransformation sofort eingeleitet werden. Insbesondere müssen durch neue
Technologien Kapazitäten bei der Bahn geschaffen werden, da die Verlagerung aller Bahngütertransporte auf
elektrifizierte Lkw exorbitant umfangreiche Ausbauten des Straßennetzes erforderte.
Die gesamten Investitionskosten zwischen 2015 und 2050 bewegen sich zwischen 15 Milliarden Euro für die
untere Grenze des Schienenausbaus und 19 Milliarden Euro für Elektrifizierung und Ausbau der Autobahnen.
Keine dieser Kosten erzeugt größere Verwerfungen der Volkswirtschaft oder des Arbeitsmarktes und bietet damit
keine Entschuldigung nicht zu handeln.
Die Fallstudie NRW findet geringere THG-Einsparpotenziale (−16 Prozent) gegenüber den Korridorstudien (−28
bis −43 Prozent) für die Bahnerweiterungs- und Verlagerungsszenarien. Die Elektrifizierung des Straßenverkehrs
erreicht in allen Fällen eine Reduktion von 60 Prozent. Interessanterweise sind auch die GHG-Vermeidungskosten
im Pro Rail-Szenario für NRW niedriger (140 Euro pro Tonne CO2-eq.) als in den Korridorstudien (um 600 Euro
je Tonne CO2-eq.). Externe Kosten für Umwelt und Sicherheit legen nahe, Klimaeffekte zu priorisieren. Für eine
tiefe und schnelle Dekarbonisierung des Güterverkehrs werden hierzu alle verfügbaren Optionen, inklusive einer
CO2-armen Schifffahrt, gebraucht.
Million tons CO2-equivalents per year 1 INTRODUCTION
1,400
1,200
1,000
800
600 1.1 BACKGROUND The figure shows that freight transport emissions are relevant for
climate mitigation strategies, even though passenger cars are
In the 28 EU Member States, heavy goods vehicles (HGVs) ac- still the dominant emitter. However, this may change with the
400
counted for a remarkably constant 19 per cent share of do- market uptake of electric and other new energy vehicles (NEVs).
mestic transport’s greenhouse gas (GHG) emissions from 1990 Trucks have a limited ability to convert to new energies. The
200 to 2016. Light duty vehicles (LDVs) added another 7 per cent volume to energy capacity of batteries is far below that of hydro-
(1990) to 9 per cent (2016), so that long distance and region- carbon fuels, and infrastructures for hydrogen are insufficiently
0 al freight transport together contributed 27 to 29 per cent developed. Synthetic fuels and biofuels for combustion engines
1990 1992 1994 1996 1998 2000 to
2002 the EU28’s2006
2004 GHG emissions.
2008 Road passenger
2010 2012 transport
2014 2016took are of course possible, but their energy efficiency is relatively
the lion’s share of this with 52 per cent of emissions in 2016, low. To achieve a satisfactory level of energy efficiency and a
while the remaining 20 per cent were almost completely due to high driving range, trucks must run directly on electric power.
international shipping and aviation. The GHG contributions of
the railways and inland navigation across the EU are negligible.
Figure 1 shows the annual emissions in transport by mode and
sector from 1990 to 2016.
FIGURE 1: Annual GHG emissions in the EU28 by transport mode and sector
Million tons CO2-equivalents per year
1,400
1,200
1,000
800
600
400
200
0
1990 1992 1994 1996 1998 2000 2002 2004 2006 2008 2010 2012 2014 2016
Heavy Goods Vehicles (HGVs) Light Duty Vehicles (LDVs) Road Passenger Railways Domestic Navigation
Domestic Civil Aviation International Aviation and Shipping Source: Fraunhofer ISI, data from European Commission (2018)
6 | 7 www.isi.fraunhofer.de
Figure 1 also reveals that GHG emissions in transport are not de-       ern Italy, and the North-Sea-Baltic corridor (NSB) from Benelux         RFC-8 from Antwerp to the Polish-Lithuanian border (Summary           year 2050 compared to the Business-as-Usual (BAU) case when
clining as they should. In fact, emissions even started to rise again   via Poland to the Baltic States. Besides major European strategies,     Report 2 of the LowCarb-RFC study, Doll et al., 2018) were            investigating the potential infrastructure, economic, social and
in 2015 and 2016, the most recent years with data availability.         the project concentrates on the implications for transport policy       examined. The main findings are that it takes time for large and      sustainability impacts.
None of the basic strategies for cleaner transport: “decoupling         at the intersection of these two corridors, the German Federal          traditional companies like the European rail carriers to adapt to
transport demand from economic growth”, “modal shift to rail”           State of North Rhine-Westphalia (NRW). The project focuses on           new market conditions and business models and these changes           The report is organised as follows: Section 2 discusses trans-
and “reducing vehicle emissions” has shown much effect over             rail as a readily available alternative to transport large quantities   cannot completely eliminate freight transport’s GHG emissions.        port scenarios for the two European freight corridors on NRW
the past 20 years. With the exception of the global financial and       of goods along busy routes using electric power, and thus po-           No matter what happens on the rail, it is necessary to decarbonise    territory. Details on individual corridor sections are taken from
economic crises 2008 to 2012, demand has been growing, im-              tentially in a carbon-neutral way. Within this setting, the project     road haulage as well. However, this pathway also contains pitfalls.   the project assessment of the German Federal Investment Plan
proved vehicle fuel efficiencies have been eaten up by increased        pursues three streams of investigation:                                 It might prove impossible to provide the necessary infrastructure     (BVWP) 2030. Section 3 derives the infrastructure demand and
motor power (and partly by emission limits), and rail network                                                                                   to transport the majority of freight on electrified highways, eco-    related investment costs associated with the NRW scenarios for
improvements have been offset by cost reductions in trucking.           •   Stream 1: Railway Reforms. This section of the LowCarb-RFC          nomic and social problems may occur, and external effects other       improved rail and carbon-free road transport. Section 4 delves
                                                                            project explores rail freight as a major pillar of climate mit-     than GHG emissions may affect the assessment of rail versus           into the larger economic impacts of the required investments
Of the many options discussed for low-carbon freight transport,             igation policy. It considers the current slow pace of climate       road-based solutions.                                                 by scenario, and Section 5 presents their environmental and
the LowCarb-RFC study looks at two of the most significant                  mitigation in the freight transport sector and asks how regu-                                                                             safety implications. These four sections summarise and inter-
measures. First, the traditional goal of shifting massive amounts           latory frameworks, company change management process-               In this final summary report of the LowCarb-RFC study, we break       pret the results of Working Paper 9 (Eiband et al., 2018) of the
of freight from road to rail. New technologies like freight plat-           es or new business models could accelerate it.                      the general and large-scale findings down to the regional level       LowCarb-RFC project.
forms, automation and advanced train control systems might                                                                                      of the German federal state of North Rhine-Westphalia (NRW),
inject new energy into this “old” idea. Second, the study looks at      •   Stream 2: European Scenarios and Impacts. Cost and qual-            which is where the two corridors meet. RFC-1 cuts through NRW         Finally, the report turns back to the analyses in the LowCarb-RFC
the comparatively new topic of electrifying motorways. Currently,           ity scenarios are established for rail, road and waterway           from north to south, while the southern branch of RFC-8 touches       Summary Reports 1 and 2. Following a brief review, Section 6
trials across Europe are collecting experiences with this concept           transport along the two corridors, and their impacts on             the Ruhr area with the port of Duisburg. This case study is also      interprets their findings in the light of the insights from the NRW
and could spark implementation plans towards the early 2020s.               the modal split, investment needs and sustainability are            closer to day-to-day policy planning as it cuts off the extreme       case study. Section 7 gives a short overview on the transforma-
                                                                            modelled. This stream forms the analytical core of the study        freight demand development forecasted for some of the sce-            tion of institutions and technology regimes. Section 8 derives
The study does not look at options for decoupling freight demand            and provides the basis for the subsequent analysis of inter-        narios along the two major corridors. A ceiling of +/−75 per          policy recommendations from the work performed in the Low-
from economic growth. Some impulses in this direction can be                vention pathways.                                                   cent of demand changes is considered in the scenarios in the          Carb-RFC project.
derived from our review of change management and business
model literature in this report. In-depth research on the topic,        •   Stream 3: Case Study NRW. This step analyses the transport
however, remains outside the scope of this study.                           scenarios and intervention pathways at the level of the local
                                                                            conditions in NRW and looks at the implications for invest-
                                                                            ments or disinvestments in infrastructures, jobs, economic
1.2     CONTEXT: THE LOWCARB-RFC STUDY                                      prosperity and the environment.

This publication is the last of three summary reports published         This third and final summary report of the LowCarb-RFC project
within the study “Low Carbon Rail Freight Corridors for Europe”         focusses on Stream 3, i.e. adapting the two major European
(LowCarb-RFC). The study was co-funded by Stiftung Mercator             corridor scenarios towards 2050 to the local conditions in the
Foundation and the European Climate Foundation over a three-            German federal state of North Rhine-Westphalia. After an as-
year period from September 2015 to November 2018. It was car-           sessment of the transport, economic and sustainability impacts,
ried out by the Fraunhofer Institutes for Systems and Innovation        the report turns to the LowCarb-RFC Summary Reports 1 and 2.
Research ISI (Karlsruhe) and for Logistics and Material Flows IML       It assesses the NRW findings in the light of the European corridor
(Dortmund), INFRAS (Zurich), TPR at the University of Antwerp           results and the previous findings on institutional reforms and
and M-FIVE GmbH (Karlsruhe).                                            business models for national rail services.

The LowCarb-RFC study concentrates on long-distance freight
transport along major European corridors because this is one of         1.3     PURPOSE AND STRUCTURE
the most steadily growing sources of greenhouse gas emissions in
Europe. It is also the most difficult to address using renewable en-    Previous publications from the LowCarb-RFC project looked at
ergies and other standard climate mitigation measures. Starting         improved rail freight performance as a way of mitigating green-
from the classical suite of strategies such as “avoid”, “shift” and     house gas (GHG) emissions (Summary Report 1 of the Low-
“improve”, the LowCarb-RFC methodology concentrates on the              Carb-RFC study, Petry et al., 2018) and the impacts of large-scale
modal shift to rail and mitigation measures in all freight modes        changes in the modal shift and in road haulage technologies
along the two major transport corridors crossing Germany: the           along two major European freight corridors. The rail freight cor-
Rhine Alpine corridor (RALP) from the Benelux countries to North-       ridors RFC-1 from Rotterdam to Genova and the southern arm of

8 | 9                                                                                                                                           www.isi.fraunhofer.de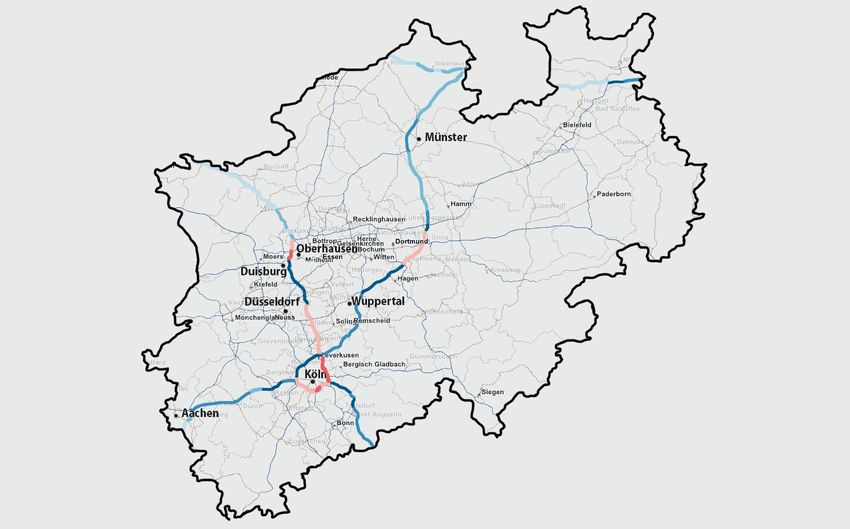
2 LOCAL SCENARIOS FOR NORTH RHINE-WESTPHALIA
Stream 3 transfers the results of streams 1 and 2 to the local placed an increasing burden on the transport network in NRW.
conditions in NRW in order to outline the regional effects of From 1990 to 2014, traffic on the motorways in NRW increased
structural changes in road and rail transport. NRW was selected by 22.8 per cent. (MBWSV, 2016). Apart from regional traffic,
as the reference region because it is crossed by two trans-Euro- especially transit transport and seaport hinterland traffic origi-
pean transport network (TEN-T) corridors (Rhine-Alpine corridor nating from the ZARA ports (Zeebrügge, Antwerp, Rotterdam
and North-Sea-Baltic corridor) and is an interesting region due and Amsterdam) (SCI Verkehr, Fraunhofer IML, 2015) present a
to its location and population density. This summary report challenge to North Rhine-Westphalia’s transport network. This
assesses the necessary investments and disinvestments as well development has already led to visible overuse on some routes,
as the environmental and social impacts of changing transport indicated by delays to rail transport (Plöchinger and Jaschensky,
volumes and infrastructure investment activities in alternative 2013) and frequent congestion on the roads (Liebsch, 2017).
scenarios towards 2050. Within the last six years, traffic jams in NRW have grown about
280 per cent in terms of kilometres, from 161,000 km in 2012
to 455,000 km in 2017 (ADAC e.V., 2012, 2017). This corre-
2.1 INTRODUCTION TO THE NRW CASE sponds to 31 per cent of the value for Germany as a whole in
2017. The predicted growth of economic and transport activities
North Rhine-Westphalia (NRW) is an important logistics area for within the region and the continuous rise in global trade volume
Germany as well as Europe due to its strategic location in the both contribute to the steep increase in the traffic loads on the
heart of Europe. North Rhine-Westphalia connects Germany transport infrastructure in NRW.
directly to the Netherlands, Belgium and France and plays an
important role in the European internal market as well as for
international and national trade and transport flows. NRW has 2.2 CURRENT FREIGHT TRANSPORT CONDITIONS
the largest population, 17.9 million inhabitants, of all 16 Ger- IN NRW
man federal states and the highest population density, 524 in-
habitants per km², of the 13 German regions (Statistisches When assessing the need for future infrastructure investments,
Bundesamt, 2016). the first step is to establish an inventory of current networks
and their bottlenecks or capacity reserves. Throughout this as-
The European region “DEA” defining North Rhine-Westphalia sessment, we concentrate on road and rail infrastructures along
has a larger population than some of the individual countries the two major European transport corridors Rhine-Alpine and
along the two major transport corridors investigated in the Low- North Sea-Baltic in NRW. We assume that inland navigation
Carb-RFC study, such as the Netherlands (17 million), Belgium has sufficient infrastructure capacity reserves to cater for even
(11.4 million) and Switzerland (8.4 million) (Eurostat, 2019). larger demand shifts in the future.
Moreover, with the port of Duisburg, NRW hosts the largest
inland port in Europe and is home to a vital logistics industry. Traffic conditions may vary strongly over time and between
It therefore constitutes an interesting and very relevant case individual sections of road and railway networks, reflecting
study area when looking at the impacts that may arise from differences in demand levels and infrastructure capacity. The
drastic policy interventions intended to curb the greenhouse data availability for capacity assessment models differ widely
gas emissions from transport. between road and rail infrastructure so we discuss the method
for assessing capacity utilization rates separately for these two
The rapid growth of the global economy (European Commis- modes.
sion, 2017) and the increase of freight transport as well as
commuter flows (Deutscher Gewerkschaftsbund, 2016) have
10 | 11 www.isi.fraunhofer.deRoad network “Leverkusen West” is graded E (“inadequate”). This calculation FIGURE 2: Mean daily traffic volume on the road infrastructure on the TEN-T corridors in NRW in 2015
Regarding the road network, the European corridors passing was made for each section on the two TEN-T corridors for road
through NRW territory consist solely of motorways. Therefore, transport and is illustrated in Figure 3.
the German road capacity model for multi-lane motorway
sections (FGSV, 2008) can be applied to estimate quality in- The blue line in Figure 3 shows the total length of the overload-
dicators by section. The model expresses loads in passenger ed sections along the two corridors in kilometres. In summary,
car units (PCU) per 24 hours. It distinguishes between light in 2015, 40 of a total 104 sections in NRW on the two corridors
traffic, i.e. passenger cars, motorcycles, vans and trucks up to were allocated traffic quality grade “E” or worse, which means
3.5 tons gross vehicle weight, and heavy traffic, i.e. trucks and they have reached a critical traffic saturation level. These 40
truck-trailer-combinations above 3.5 tons, and coaches. Heavy sections make up 176 km of a total 534 km. Only eight sections,
traffic is assigned two PCUs compared to one PCU for light with a total length of 44 km, could be assigned traffic quality
traffic (Intraplan Consult, 2012). The weighted sum of light grade “A / B”, implying that free flowing traffic is possible along
and heavy traffic volumes provided by traffic count data equals the TEN-T corridors.
the total 24-hour traffic volumes per section. The data used for
the mean daily traffic intensity were generated using the 2015 One of the three sections assigned grade “F−” is located on
road traffic census published by the Federal Highway Research the A1, starting at the intersection “Wuppertal-Nord” until
Institute (BASt) (BASt, 2017). “Wuppertal-Langerfeld”. The other two sections are connected
to each other and form part of the A3. Traffic quality remains
For an exemplary motorway section between “Leverkusen” and critical starting at the “Leverkusen” intersection through “Lever-
“Leverkusen West” on the A1, light traffic has a share of 87.2 kusen Zentrum” until “Köln-Mülheim”.
per cent out of 105,766 vehicles. This is equivalent to 92,228
PCU of light traffic and consequently 27,076 PCU of heavy Rail network
traffic, which sums up to 119,304 PCU per 24 hours on this The University of Münster determined the mean daily load of
section. Figure 2 illustrates the results of the calculations for the railways in the year 2011. Projected to 2015, the mean daily Vehicles / 24h: 150,000–175,000 125,000–150,000 100,000–125,000 75,000–100,000 50,000–75,000 25,000–50,000
each section of the two European transport corridors on NRW loads fluctuate between 0 and 770 trains; 65 of 118 sections Source: Own representation based on Openstreetmap (2018), BASt (2017)
territory and shows the difference in the mean daily traffic in- were under strain and carried more than 200 trains per day.
tensity. The busiest sections appear to be in the greater Cologne On average, this implies 227 trains per day. The University of FIGURE 3 : Distribution of traffic quality grades in 2015
area, as well as near Oberhausen and Duisburg. Münster took detailed data for each railway section (IVM, 2011).
Number of overloaded corridor sections Total length of overloaded sections (km)
The traffic loads per motorway section alone, however, do not To determine the occupancy rate for every section in per cent, 50 174 180
indicate actual traffic conditions without information on road the quotient was calculated from the given load and the ca-
capacity as well. Therefore, the total daily loads per road section pacity in trains per section. 160
were allocated to the actual number of motorway lanes for each 143
40
section. Total traffic volumes are measured in average annual Applied to the section “Aachen Central” to “Aachen West”, 140
daily traffic (AADT), i.e. in vehicles per 24 hours in the year 2015. for example, the occupancy rate was 145 per cent based on an
120
The allocation assumed an equal distribution of AADT across all actual load of 285 trains in 2015 and a calculated capacity of
lanes of a road section. This assumption appears justified under 196 trains. This section is highly overloaded and requires capac- 30
100
congested traffic conditions as drivers will make maximum use of ity enhancements. We define every section with an occupancy 89
the available road space. The six resulting traffic quality grades rate of more than 110 per cent as overloaded in line with the
80
range from A / B, which indicates very good or good traffic quali- methodology used in the BVWP (BMVI, 2015), and requiring 20 76
ty with a mean daily load of 0 to 11,530 vehicles per lane, to F−, intervention measures. 60
which is the worst situation with a mean daily load of more than 29
27
26,135 vehicles per lane (Intraplan Consult GmbH, 2012). Traffic In total, there are 93 sections with idle capacity meaning traffic 44 21 40
10
quality was assumed to be critical from grade E (“inadequate”, in these sections can flow without restrictions. On 20 sections, 16
18,920 to 20,990 vehicles per day and lane), and the sections between 85 per cent and 110 per cent capacity is used; this in- 20
11
8
allocated this grade and lower were identified as bottlenecks. dicates an economical occupancy rate and a traffic flow without
0 3 0
bigger impacts (IVM, 2011). The remaining five sections have
For the exemplary section from “Leverkusen” to “Leverkus- been classified as overloaded so that delays are a daily problem. A/B C D E F F−
en West”, six lanes have an AADT of 119,304 vehicles per Traffic quality grade
24 hours, which translates into 19,884 vehicles per lane per The line deficiencies of these critical sections result from the
24 hours. Accordingly, the section between “Leverkusen” and difference between actual loads and theoretical capacity. For Source: Own representation based on BASt (2017) and Intraplan Consult GmbH (2012)
12 | 13 www.isi.fraunhofer.dethe given example “Aachen Central” to “Aachen West”, the that results if the responsible players take no further measures TABLE 1: Definition of the scenarios for traffic development (tkm) until 2030
line deficiency was calculated as 285 − 196 = 89 (trains per to promote a mode of transport. The BAU scenario is based on
day). “Cologne Central” to “Cologne West” is the most critical the BVWP data and can therefore be classified as most likely. Scenario Rail Road
section on the TEN-T corridors in NRW with a line deficiency of
174 trains per day. This is followed by “Cologne Messe Deutz” Moderate Road (Mod Road): This scenario describes a devel- BAU = BVWP = BVWP
to “Cologne Central” (119 trains per day), “Aachen Central” to opment that favours road transport. It assumes that the rail Mod Rail +25% to BAU −5% to BAU
“Aachen West” (89 trains per day), “Westhofen” to “Schwerte” transport volume will fall by 25 per cent in 2030 compared to
Mod Road −25% to BAU +5% to BAU
(50 trains per day) and “Bonn Central” to “Bonn Mehlem” (41 the BAU scenario in this year. Assuming that the growth rate
trains per day). In total, there were 19 km of overloaded rail on waterways remains constant at 15 per cent as in the BAU Pro Rail +75% to BAU −15% to BAU
tracks along the TEN-T corridors in NRW in 2015. scenario, this means there is a corresponding shift to road trans- Pro Road −75% to BAU +15% to BAU
port. This leads to a 5 per cent growth in total road transport Source: Fraunhofer ISI
volume until 2030. Projecting these growth rates until 2050
2.3 DEFINING LOCAL SCENARIOS FOR NRW leads to a “Mod Road 2050” scenario with road transport ac- The definitions of the scenarios and their implications for trans- share is nearly the same in every scenario (44.8 per cent in 2030
counting for 53 per cent and rail for 5 per cent. Compared to port modes, the modal split and the respective growth rates of and 39.0 to 41.7 per cent in 2050), but the rail and road shares
Five scenarios examine the development of road and rail traffic the BAU scenario in 2050, this represents a 10 per cent increase ton kilometre are summarized in Table 1 and Figure 4. differ depending on the chosen infrastructure developments.
and the implications for investments or disinvestments in certain for road and a 44 per cent decrease for rail. In 2030, the share of rail transport ranges between 2.3 per
infrastructures, jobs, economic prosperity and the environment. As seen in the table above, the scenarios vary widely. This ap- cent and 16.2 per cent. This discrepancy increases even further
These scenarios differ in terms of the share of transport modes Moderate Rail (Mod Rail): The Moderate Rail 2030 scenario de- proach allows us to examine the different effects of modal shifts to a range from 0.6 per cent to 27.4 per cent by 2050. Road
in the modal split. While the "business-as-usual" (BAU) scenario scribes the opposite development. In this case, the rail transport and determine the environmental and social implications. For transport undergoes a similar development but in the opposite
describes traffic development as published in the Federal Trans- volume increases by 25 per cent, so that the share of road trans- 2050, the respective growth rates of the scenarios are extended direction. In 2030, the share of road transport ranges between
port Infrastructure Plan 2030 (BVWP) (BMVI, 2015) and is used port decreases by 5 per cent. The development described for for another 20 years, which amplifies the effects of the scenar- 39 per cent and 52.9 per cent. In 2050, a larger range emerges
in most studies examining developments in the transportation 2030 is projected up to 2050 in the “Mod Rail 2050” scenario. ios. The Pro Road and Pro Rail scenarios were included in this of 33.2 per cent to 60.4 per cent. The extreme scenarios (Pro
sector, the other scenarios look at alternative developments. The Road transport then accounts for 44 per cent of the transport study as to show the extreme effects of major modal shifts. Road and Pro Rail) highlight that modal share gains or losses
scenarios for NRW differ from the scenarios for the European volume compared to 15 per cent on rail. The two moderate These two scenarios are only realistic in a hypothetical policy of around 15 per cent are possible for road transport under
freight corridors due to their focus on infrastructure. The corridor scenarios describe a more or less realistic development of trans- environment exclusively focussed on road or rail, which ignores extreme (and highly improbable) measures.
scenarios started from cost considerations and their impact on port volumes that could be achieved by established transport all financial and organisational restrictions.
freight transport volumes, while the NRW case immediately de- policy and investment measures.
parts from given demand changes. The NRW case study focuses Figure 4 illustrates the effect of the scenarios on the modal split
on investment requirements as well as on the entailed social and Pro Road: In order to illustrate what extreme changes in the shares of the transport modes in the transport volume on the
environmental impacts on the TEN-T corridors in NRW. modal split would mean for the infrastructure, we also included TEN-T corridors in NRW. The transport shares vary significantly in
two purely theoretical, extreme scenarios. The Pro Road 2030 the different scenarios. Since the study did not examine IWT, its
Business-as-usual (BAU): The transport volume development scenario assumes a 75 per cent loss in rail transport volume. This
on the TEN-T corridors in NRW until 2030 was determined shifts to road transport, which registers an increase of 15 per
using data from the BVWP. Unlike the trans-European corridor cent. Extended to 2050, this scenario leads to an increase of
cases (see Working Paper 5 of the LowCarb-RFC study, Doll and 32 per cent in road transport compared to the BAU 2050 sce-
Köhler, 2018), the inland waterway transport (IWT) in NRW ac- nario and a marginalisation of rail transport to a share of only
counts for a much higher percentage of the total traffic volume. 0.6 per cent in the modal split of 2050. At this point, it should
This is due to the huge importance of the Rhine and the inland be emphasized once again that these are extreme changes,
waterway canal system. In addition, almost all waterways in the representing a theoretical scenario that cannot be realised.
state are part of the TEN-T corridors, whereas only a fraction
of the road and rail infrastructure is located along these corri- Pro Rail: On the other hand, the Pro Rail scenario assumes a
dors. In total, this scenario expects 42.3 billion ton kilometre theoretical development in favour of rail transport. Instead of
to be transported by road and 8.5 billion ton kilometre by rail losing 75 per cent, in this scenario, the share of rail in the modal
in 2030. This implies an increase of 27 per cent on the roads split increases by 75 per cent, so that the road traffic volume
and 23 per cent on the rails compared to 2015. The transport decreases by 15 per cent. For 2050, this means a 28 per cent
volume on the inland waterways increases by 15.3 per cent to decrease in road transport compared to the BAU 2050 scenario
41.2 billon ton kilometres. Extending this scenario to 2050 leads and a 206 per cent increase in rail transport, so that the rail’s
to traffic volumes of 58.2 billion ton kilometre on the roads new share of the modal split is 27 per cent. As in the Pro Road
and 11.3 billion ton kilometre on the rails. In contrast to the case, this is a theoretical scenario, whose extreme changes
previous working papers, the BAU scenario is treated here as an merely give an overview of purely theoretical developments.
equivalent scenario. The BAU scenario depicts the development
14 | 15 www.isi.fraunhofer.deFIGURE 4: Share of the transport modes in transport volume in 2030 and 2050
3 MODE SHARE AND INFRASTRUCTURE NEEDS
Cumulated share of the modes (%)
100 ASSESSMENT
90
80 39.4 41.5 41.7 41.4 39.0
44.8 44.8 44.8 44.8 44.8
70
0.6
60
2.3 5.3
9.5
9.2 7.0 14.7
50 11.5
16.2 27.4
40
30 52.9 53.3
60.4 3.1 TRAFFIC DEVELOPMENT IN THE SCENARIOS the TEN-T corridors in NRW. It shows the respective lengths of
43.7 46.0 48.3
43.8
48.8 AND IMPACT ON THE INFRASTRUCTURE the sections in kilometres, so that the following development
20 39.0 33.2 emerges.
10 For the five scenarios and for the key commodities transported
along these corridors, we identified the infrastructure facilities Looking at traffic quality in the years 2030 and 2050 reveals
0 required–or no longer required–as a basis for the investment that, although an intact infrastructure was assumed, bottle-
Pro Rail Mod Pro BAU Mod Pro Pro Road Pro Rail Mod Pro BAU Mod Pro Pro Road
(theoretical) Rail Road (theoretical) (theoretical) Rail Road (theoretical) plan. necks are still expected in some areas despite the planned invest-
ments. However, the expansion of the network also improves
2030 2050
Road network load the situation in some areas. Figure 5 shows that, for the year
Traffic development scenarios
Before evaluating the load on the roads, planned changes to 2030 in general, the planned projects in the BVWP can only
Road 2030 Rail 2030 IWT 2030 Road 2050 Rail 2050 IWT 2050 the infrastructure were taken into account. According to the ensure the necessary traffic quality to a limited extent, so there
Source: Own representation based on BMVI (2015) BVWP, 16 measures are planned for completion by 2030 on the is the need for additional measures.
TEN-T corridors in NRW. The following section describes traffic
FIGURE 5: Overload of road sections in NRW (only TEN-T corridors) in 2030 and 2050 development and its impacts on traffic quality in the different Rail network load
scenarios under these changed circumstances. The infrastructure changes planned in the BVWP were also
Total length of overloaded sections (km) Share of overloaded km on corridors (%)
considered for rail in 2030.
300 35
The number of critical sections in the scenarios changes in line
with the modal split developments. In the Pro Rail scenario, for In the year 2030, the extreme Pro Rail scenario implies 24 bottle
30 example, only 18 road sections with a total length of 71 km can necks on the rail corridors in NRW. These extend over a total of
250
be identified as bottlenecks. This corresponds to 13 per cent of 126 km, which corresponds to 14 per cent of the total length
the length of all motorways on the corridors in NRW, and this of the rail network on the corridors in NRW. Looking at the Pro
25
200
share increases to 23 per cent in the Pro Road scenario, which Road scenario, on the other hand, the share of critical rail kilo-
corresponds to 123 km on 32 sections. metres shrinks to one per cent, which means only six kilometres
20 on three corridor sections. In the BAU scenario, however, bottle
150 Comparing the developments in 2030 and 2050 shows the necks continue to occur. A total of 64 km on eleven sections,
15
intensification of the results. By 2050, the share of overloaded equivalent to seven per cent of the total length, still fall into
corridor sections on the road decreases to 9 per cent, spread the critical category despite the planned expansion measures.
100 over only 13 sections with a total length of 46 km. The Pro Rail
10
scenario, on the other hand, leads to the maximum of 45 over- If these scenarios are extended to the year 2050, the following
loaded sections with a total of 182 km. This means that 34 per distribution of bottlenecks results. In the Pro Rail scenario, the
50
5 cent of the total length of the corridors in NRW will be over- share of critical rail sections on the corridors in NRW doubles
loaded. A share of 19 per cent of the road corridor kilometres to 29 per cent, affecting 41 sections and 256 km. The share
0 0 remains critical even in the BAU scenario, where traffic develops of bottlenecks in the Pro Road scenario, on the other hand, is
Pro Rail Mod Pro BAU Mod Pro Pro Road
as predicted, and which forms the basis of most planning, and hardly worth mentioning at 0.2 per cent. In the BAU scenario,
(theoretical) Rail Road (theoretical) considers the measures already planned. the situation improves slightly compared to 2030. Only 48 km
Traffic development scenarios
on nine sections are critical here, which corresponds to a share
Length 2030 (km) Length 2050 (km) Share 2030 (%) Share 2050 (%) Figure 5 illustrates the different traffic developments described of five per cent.
Source: Own representation based on BASt (2017) in the scenarios for the critical road infrastructure sections on
16 | 17 www.isi.fraunhofer.deFigure 6 illustrates the different traffic developments in the volume. In the BAU scenario 2030, for example, there is the FIGURE 6: Overloaded rail sections in NRW (only TEN-T corridors) in 2030 and 2050
scenarios for the critical sections on the rail infrastructure of the need for 58 new lanes totalling 218 km.
Total length of overloaded sections (km) Share of overloaded kms on corridors (%)
TEN-T corridors in NRW. It considers the respective lengths of the
450 30
sections in kilometres, so that the following situations emerge. Additionally, we must take into account the costs for the already
planned measures that also affect traffic quality and contribute
400
As was the case for road transport, the results show that the to avoiding bottlenecks. These costs have been added to the
25
expansion measures already planned for the railways do not calculated, additional costs as a designated, fixed part in each
350
adequately meet demand. Particularly in the Pro Rail scenarios, scenario and for 2030 and 2050, respectively.
there is a great need for additional measures beyond those 300 20
already planned in order to be able to handle the growing Overall, the Pro Road scenario leads to the highest costs for both
volume of traffic. 2030 and 2050. This scenario also has the biggest increase in 250
road construction costs between 2030 and 2050 due to the 15
high road loads. The three moderate scenarios have a similar 200
3.2 REQUIRED INVESTMENTS range of costs in 2030 and do not have a major impact on the
development of road costs. The Pro Rail scenario is the only 150 10
We estimated the investments required for road and rail trans- scenario in which expansion costs decrease significantly until
port based on infrastructure needed. Investment cost figures 2050. The costs in this scenario are less than half the costs for 100
5
are mainly taken from the Federal Investment Plan 2015 (BVWP) the Pro Road scenario in 2050.
50
(BMVI, 2015). The investment programme compiles infrastruc-
ture measures planned for the TEN-T corridor sections in North To calculate the total cost of the proposed rail expansion meas- 0 0
Rhine-Westphalia, which are contained in the BVWP. ures, we determined the overall costs of the already planned Pro Rail Mod Pro BAU Mod Pro Pro Road
measures. This data indicated the average cost for the expansion (theoretical) Rail Road (theoretical)
Scenarios of traffic development
To determine the required road investments, we calculated the or new construction of tracks. Subsequently, we translated this
mean of the planned investments in the corridors in NRW. For data into a base value of “cost per kilometre” that we used Length 2030 (km) Length 2050 (km) Share 2030 (%) Share 2050 (%)
the years 2011 to 2015, cost figures were taken from the Cap- to estimate the investment costs of the additionally needed Source: Own representation based on IVM (2011)
ital Investment Framework (IRP) (BMVBS, 2012), which totalled measures.
1,266 million euros for the expansion and new construction FIGURE 7: Estimated average cost for one kilometre of road construction on the TEN-T corridors in NRW
of lanes along the relevant corridor sections. This means an The Federal Environment Agency estimated costs of 12 million
average investment volume of 17 million euros per kilometre euros per kilometre of track for the construction or expansion
Cost in million € per 1 km construction
of expansion. In the BVWP covering the years 2015 to 2030, of sections of line (Holzey, 2010). Calculating the average value
the total costs for expansion and new construction of lanes of measures planned for NRW in the BVWP (BMVI, 2015) leads 60 Maximum € 59.7 million
on the TEN-T corridors in NRW add up to 1,220 million euros, to a corresponding value of 12.7 million euros per kilometre
with a mean of 15.6 million euros per km. In both cases, we (IVM, 2011). This includes all necessary construction measures,
50
took extreme outliers into account, which are illustrated by the such as tunnels and bridges, signalling systems and planning.
dotted lines in Figure 7. However, we must emphasize that this is a rough estimate only, Proportional factor for interections / bridges
and each individual case requires close examination. 40
Due to the increasing traffic volume, it was equally necessary
Maximum € 34.4 million
to consider the expansion of intersections as well as new con- The expansion of sidings and passing tracks entails lower costs
structions, e.g. of bridges for renovation purposes. As a simple than the construction of completely new track. Since passing 30
translation to the number of kilometres did not seem appro- tracks must at least reach the maximum permissible train length
priate, these costs were assigned proportionally to the other of 740 m, costs of 12.7 million euros per passing track are cal-
20 Total cost € 19.36 million Total cost € 19.32 million
sections. For both the IRP and BVWP cost rates, this resulted culated, which is the corresponding value for the construction
Mean € 17.0 million Mean € 15.6 million
in total average costs of approximately 19.3 million euros per of one kilometre of track (Deutscher Bundestag, 2018).
kilometre. We finally assumed this value for the investment 10
requirement per kilometre for the expansion of motorway sec- We have to add the designated costs of the already planned Minimum € 6.5 million
Minimum € 4.7 million
tions in both directions. measures in the BVWP (BMVI, 2015) to the calculated additional
costs for the recommended measures. As precise information 0
The calculated required investments per kilometre of expansion on the investment volume of the planned measures on the IRP 2011–2015 BVWP 2015–2030 Reference framework
were transferred to the necessary measures identified for the TEN-T corridors in NRW was not available, we used estimated
five scenarios to determine the additionally needed investment values based on the previously determined cost per kilometre. Source: Own representation based on BMVI (2015), BMVBS (2012)
18 | 19 www.isi.fraunhofer.deIt is assumed that the European Train Control System (ETCS) relative to the other scenarios. The Mod Rail scenario is then the FIGURE 8: Estimated total investment needed on the road and rail infrastructure in NRW 2015 until 2030
expansion in Germany will be completed by 2050 (BMVI, 2018) most cost-effective variant considering lower as well as upper
which is why the corresponding capacity increase was taken into estimates. In the Pro Rail scenario, the possible range between Traffic development scenario
account in this work package. The costs for this comprehensive lower and upper bound costs are way more pronounced com-
UB
measure were also included in the assessment and increase the pared to the 2015 to 2030 investment period. This is because
Pro Road
designated costs by 4.5 million euros per corridor kilometre the longer time horizon increases the uncertainty on the number LB
(BMVI, 2018) in NRW by 2050. of potential investment measures and on their depreciation
periods. UB
Mod Road
As alternative expansion measures to avoid bottlenecks are
LB
feasible for some sections, we calculated the case with the As mentioned above, investments in road and rail are inter-
highest (upper bound, abbr. UB) and the one with the low- dependent. Higher investments on the roads usually lead to UB
est (lower bound, abbr. LB) costs, based on the general cost lower investments on the railways. This effect is more or less BAU
rates described above. The total costs of all permissible deci- noticeable depending on the chosen expansion measures for LB
sion options are then within these bounds. The upper bound the railways.
UB
represents the most expensive case where capacity increases Mod Rail
on overloaded sections are achieved by adding new tracks and Overall, the two extreme scenarios incur the highest costs, be- LB
not by extending passing tracks. If the passing track option is cause one mode of transport has to cope with an unexpectedly
UB
selected wherever possible to improve the capacity utilisation large volume of traffic, so that a large number of expansion
Pro Rail
situation, this is generally the most cost-effective case and rep- measures are necessary. In contrast, the moderate scenarios LB
resents the lower bound. featuring more balanced growth have lower expansion costs
spread more equally across the different modes of transport. 0 2,000 4,000 6,000 8,000 10,000 12,000
In order to evaluate the scenarios, it is not sufficient to consider Total cost in million €
the influences of transport development on road and rail infra-
structure separately. A stronger increase on the roads, which 3.3 REALITY CHECK Designated costs Additional costs UB = Upper bond LB = Lower bond
leads to higher investments here, implies a lower increase or Source: Own representation (based on own calculations)
even a decrease on the railways, so that fewer investments are This chapter is characterised by its theoretical nature. If all the
necessary here. Figures 8 and 9 show how these effects develop developments occur as assumed together with optimal frame- FIGURE 9: Estimated total investments needed on the road and rail infrastructure in NRW 2015 until 2050
in the five scenarios. work conditions, the outlined bottlenecks will emerge and ap-
propriate measures are to be recommended. However, in reality, Traffic development scenario
By 2030, the calculated required investment volume is almost other factors play a role that can affect, delay or even make the
twice as high as estimated in the BVWP. Even in the most necessary measures impossible. UB
Pro Road
cost-effective case, the Pro Rail scenario, the necessary invest-
LB
ments exceed the designated ones by more than 50 per cent. To illustrate this, we discuss the issue of dense building de-
The Pro Road scenario is the most expensive one in terms of velopments at the edge of existing, but overloaded transport UB
infrastructure costs. This is because only marginal changes are infrastructure. In other words, the case when the theoretically Mod Road
LB
necessary on the railways. The Pro Rail scenario, on the other defined measures meet reality.
hand, offers potential cost savings because it has lower road UB
investment requirements. For Pro Rail, however, the range of The analysis identified bottlenecks at the Leverkusen junction BAU
potential net costs exceeds all other scenarios, so that even (A1 / A3), which are to be countered by increasing the number LB
higher costs than BAU are possible. When looking at the BAU of lanes. In 2010, the A1 had six lanes from the Wermelskirchen
UB
scenario and the moderate scenarios, no relevant cost changes intersection to the Köln-Niehl intersection. The same situation Mod Rail
occur, at least in the most cost-effective variant (LB). The costs applied to the A3 from the Langenfeld motorway junction to LB
for all scenarios converge for expansion based only on new the Köln-Delbrück intersection. Only the section from the Lever-
construction (UB), although the Mod Road scenario is narrowly kusen-Opladen intersection to the Leverkusen junction has al- UB
Pro Rail
the most cost-effective here. ready been widened to eight lanes. In addition, the Leverkusen
LB
junction itself has too little capacity due to its clover shape.
Figure 9 illustrates the cost effects for 2050. First, BAU invest- 0 4,000 8,000 12,000 16,000 20,000
ments including full ETCS deployment, over the period 2015 The Federal Transport Infrastructure Plan (BVWP) includes Total cost in million €
to 2050 are around six billion euros or 50 per cent above the the eight-lane expansion of the Leverkusen junction to the
investment needs from 2015 to 2030. Second, the upper limit Köln-Niehl intersection on the A1 and the Hilden junction to Designated costs Additional costs UB = Upper bond LB = Lower bond
investment costs in the Mod Rail and BAU scenarios decline the Köln-Mülheim intersection on the A3. Source: Own representation (based on own calculations)
20 | 21 www.isi.fraunhofer.deIn all traffic development scenarios presented for 2030 two extra our results in the political discussion. However, we acknowledge
lanes are needed on the A3 from the Leverkusen junction to the that climate protection is an urgent issue and requires actions
Köln Heumar motorway intersection. This means that a total of that are more stringent.
ten lanes are required for the predicted traffic load. By the year
2050 and if traffic develops according to the BAU scenario or The investment cost assessment used the standard cost values
the Pro Road scenarios, a total of 12 lanes will be required from for investments from the BVWP, excluding land purchase and
the Leverkusen junction to the Leverkusen-Zentrum intersection large parts of maintenance. We also omitted costs for vehicle
to absorb the traffic load without disruptions. production and servicing and the real estate sector associated
with transport infrastructures. Thus, even the upper bound
Looking at an aerial photograph of the Leverkusen motorway cost estimates presented here constitute a relatively cautious
junction (see page 21), it quickly becomes apparent that unlim- estimate of the costs associated with different freight transport
ited expansion will not be possible here without considerable scenarios. Nevertheless, the figures do indicate the direct finan-
additional efforts. The surrounding residential and industrial cial burden on public budgets and the railway sector.
buildings, some of which are located directly along the route,
cause costs that have not yet been taken into account. The calculations showed that the traffic situation on the TEN-T
corridors intensifies in all scenarios. Even if traffic develops as
As this issue has become apparent in the last years, several assumed by many politicians and scientists, numerous expan-
extension measures have already been discussed. For the A1 sion measures are lacking on the roads and railways in NRW
exemplarily, 14 proposals have been compared and evaluated, in order to be able to handle the increasing load. By the year
whereof nine contained a tunnel solution (Grassl et al., 2018). 2030, the highest costs will emerge if rail is marginalised, i.e.
Furthermore, seven proposals have also been drawn up for if there is an extreme modal shift to road transport. A shift to
the extension of the A3 around the junction Leverkusen. The rail achieves the lowest costs, but only if this is achieved with
costs range between 150 million euros and 910 million euros selective expansion measures. By 2050, the costs of expansion
(Straßen.NRW, 2018). will rise in all scenarios due to additional traffic growth. The
most cost-effective scenario here is a moderate one with a
This problem is not related exclusively to road infrastructure. positive, but less extreme development of the railways.
Rail also has framework conditions that complicate infrastruc-
ture expansion and significantly increase its cost. For example, Policy recommendations based on the results in this section
the tracks between Köln Messe / Deutz and Cologne Central include preparing for long-term investment plans in good time,
Station cross the Hohenzollern Bridge. At this point, the rail using the coming decade to develop and test alternatives to
infrastructure was already overloaded in 2015, at least one traditional infrastructure programmes, and preparing for the
additional track indispensable. However, the capacity of the discussion about desirable modal shares in a post-fossil freight
bridge is already fully utilised, so that any expansion will involve transport world with low costs for trucking. More detailed policy
a great effort in terms of time and money. recommendations are elaborated in Chapter 8.
The theoretical measures face further obstacles that can cause
delays and higher costs. These include the current condition of
the infrastructure in Germany, the long duration of approval
procedures, the limited funds available, and the lack of skilled
personnel.
3.4 DISCUSSION
The case study of North Rhine-Westphalia focuses on the im-
plications of modal shifts and road decarbonisation at the local
level. In contrast, the European corridor analyses started from
the technical and efficiency potentials of ways to decrease trans-
port’s GHG emissions. These normative modal shift scenarios
are deliberately much more cautious than the corridor model .
results for NRW. This compromise supports the acceptability of
22 | 23 www.isi.fraunhofer.deYou can also read