Ethnicity and Migration in Auckland - Knowledge Auckland
←
→
Page content transcription
If your browser does not render page correctly, please read the page content below
Ethnicity and Migration in Auckland
February 2013                    Technical Report 2013/012

Auckland Council
Technical Report, TR2013/012

ISSN 2230-4525 (Print)
ISSN 2230-4533 (Online)

ISBN 978-1-927216-33-0 (Print)
ISBN 978-1-927216-34-7 (PDF)
This report has been peer reviewed by the Peer Review Panel using the Panel’s
terms of reference

Submitted for review on 11 February 2013
Review completed on 17 May 2013
Reviewed by two reviewers

Approved for Auckland Council publication by:

Name: Grant Barnes

Position: Manager
Research, Investigations and Monitoring Unit

Date: 17 May 2013

 Recommended citation:
 Gilbertson, Amanda and Meares, Carina (2013). Ethnicity and migration in Auckland.
 Auckland Council technical report, TR2013/012.

 © 2013 Auckland Council
 This publication is provided strictly subject to Auckland Council’s copyright and other intellectual property rights (if
 any) in the publication. Users of the publication may only access, reproduce and use the publication, in a secure
 digital medium or hard copy, for responsible genuine non-commercial purposes relating to personal, public
 service or educational purposes, provided that the publication is only ever accurately reproduced and proper
 attribution of its source, publication date and authorship is attached to any use or reproduction. This publication
 must not be used in any way for any commercial purpose without the prior written consent of Auckland Council.
 Auckland Council does not give any warranty whatsoever, including without limitation, as to the availability,
 accuracy, completeness, currency or reliability of the information or data (including third party data) made
 available via the publication and expressly disclaim (to the maximum extent permitted in law) all liability for any
 damage or loss resulting from your use of, or reliance on the publication or the information and data provided via
 the publication. The publication, information, and data contained within it are provided on an "as is" basis.
Ethnicity and Migration in Auckland
Prepared for Community and Cultural Strategy Unit by:

Dr Amanda Gilbertson and Dr Carina Meares
Social and Economic Research Team
Research Investigations and Monitoring Unit
Auckland Council
Contents

1.0   Introduction ................................................................................................................ 1
2.0   Immigration ................................................................................................................ 3
  2.1    New Zealand immigration policy since 1986 ........................................................... 3
  2.2    Permanent residency trends ................................................................................... 3
  2.3    Overseas born populations ..................................................................................... 5
  2.4    Length of time in New Zealand................................................................................ 7
  2.5    Spatiality of migrant settlement in Auckland ............................................................ 7
3.0   Characteristics of ethnic groups in Auckland ............................................................ 12
  3.1    Ethnic composition in Auckland............................................................................. 13
  3.2       Ethnicity by local board area.. ............................................................................... 14
  3.3       Ethnicity by birthplace ........................................................................................... 16
  3.4       Age-sex structure of ethnic groups........................................................................ 16
  3.5       Labour force status, unemployment and NEET youth ........................................... 19
  3.6       Occupation ........................................................................................................... 22
  3.7       Skill-based underemployment of immigrants ......................................................... 23
  3.8       Educational qualifications...................................................................................... 24
  3.9       Personal income ................................................................................................... 27
4.0      Projections ............................................................................................................... 29
5.0      Why Auckland? ........................................................................................................ 30
6.0      International students ............................................................................................... 31
7.0      Refugees .................................................................................................................. 33
  7.1       Demographic characteristics ................................................................................. 33
  7.2       Movements to and from New Zealand................................................................... 34
  7.3       Housing ................................................................................................................ 34
  7.4       Language and literacy........................................................................................... 34
  7.5       Education.............................................................................................................. 35
  7.6       Employment .......................................................................................................... 35
  7.7       Income .................................................................................................................. 36
  7.8    Health and well-being ............................................................................................. 37
  7.9    Social networks..................................................................................................... 37
  7.10     Citizenship, identity and belonging .................................................................... 38
  7.11     Service provision ............................................................................................... 39
  7.12     Youth and children ............................................................................................ 40
  7.13     Looking back and looking forward ..................................................................... 41
  7.14     Conclusion ........................................................................................................ 41
8.0   Health ....................................................................................................................... 42
  8.1    Health needs assessment of Asian people ........................................................... 42
    8.1.1    Summary of key quantitative findings ............................................................. 42
    8.1.2    Summary of findings from the health service provider interviews ................... 43
    8.1.3    Recommendations ......................................................................................... 44
  8.2    Health needs assessment of Middle Eastern, Latin American and African people. 44
    8.2.1    Middle Eastern people ................................................................................... 45
    8.2.2    African people ................................................................................................ 46
    8.2.3    Latin American people ................................................................................... 47
8.2.4 Findings from health service provider (HSP) interviews ................................. 48
8.2.5 Recommendations ......................................................................................... 49
9.0 Ageing ...................................................................................................................... 51
9.1 Overview of ethnic differences .............................................................................. 51
9.2 Happiness and life satisfaction .............................................................................. 52
9.3 Everyday discrimination ........................................................................................ 52
9.4 Health ................................................................................................................... 52
9.5 Loneliness ............................................................................................................ 53
9.6 Living standards.................................................................................................... 53
10.0 Quality of Life Survey ............................................................................................... 54
11.0 General Social Survey .............................................................................................. 56
11.1 Ethnic differences in well-being ......................................................................... 57
11.1.1 Health ............................................................................................................ 57
11.1.2 Knowledge and skills ..................................................................................... 58
11.1.3 Paid work ....................................................................................................... 58
11.1.4 Standard of living ........................................................................................... 59
11.1.5 Housing ......................................................................................................... 60
11.1.6 Physical environment ..................................................................................... 61
11.1.7 Safety and security ........................................................................................ 62
11.1.8 Support across households............................................................................ 63
11.1.9 Social connectedness .................................................................................... 63
11.1.10 Leisure and recreation ................................................................................ 64
11.1.11 Democracy ................................................................................................. 64
11.2 Culture and identity ........................................................................................... 64
11.2.1 Generations in New Zealand.......................................................................... 65
11.2.2 Feelings of belonging ..................................................................................... 67
11.2.3 Freedom of expression of identity .................................................................. 68
11.3 Human rights ..................................................................................................... 69
11.3.1 Discrimination ................................................................................................ 70
11.3.2 Attitudes toward multiculturalism .................................................................... 74
12.0 Funded services to migrants and refugees ............................................................... 77
12.1 Key findings....................................................................................................... 77
12.2 Recommendations ............................................................................................ 79
12.2.1 Employment ................................................................................................... 80
12.2.2 Business ........................................................................................................ 80
12.2.3 English language training and education........................................................ 81
12.2.4 Information advice and support ...................................................................... 81
12.2.5 Family support ............................................................................................... 82
12.2.6 Housing ......................................................................................................... 82
12.2.7 Recreation and leisure ................................................................................... 82
12.2.8 Culture ........................................................................................................... 82
13.0 Ethnic precincts........................................................................................................ 83
14.0 Conclusion ............................................................................................................... 84
15.0 References ............................................................................................................... 851.0 Introduction International migration is an important element in the growth of the Auckland region, and it seems likely that this will continue to be a significant factor into the future. Immigration has resulted in substantial changes to the cultural and demographic characteristics of Auckland, as well as to its physical landscape.1 Auckland is the most ethnically diverse region in the country – over 150 different ethnic identities and more than 120 languages were listed in responses to the last census in 2006. At this time, overseas-born residents constituted 37 per cent of the population, a proportion that is likely to have increased in the intervening years. This relatively new configuration of cultures, languages, traditions and skills in Auckland has brought vibrancy to the region, much of which is reflected in cultural events and traditions; however, at the local level there are ongoing challenges to ensure cross-cultural understanding and social cohesion. It is also important to understand Auckland’s ethnic communities and their well-being in a range of domains including social, economic and health. A good understanding of these factors assists council in the development and delivery of appropriate services. To aid Auckland Council in its efforts to meet the needs of ethnic peoples, an Ethnic Peoples Advisory Panel (EPAP) was established in 2010. The panel identifies and communicates the interests and preferences of ethnic peoples in Auckland to the Council, in relation to the content of the strategies, policies, plans and bylaws of the Council; and any matter that the panel considers to be of particular interest or concern to ethnic peoples of Auckland. In addition, the EPAP advises the Mayor, Governing Body and local boards on appropriate ways to engage with ethnic peoples and communities in Auckland. The EPAP follows the Office of Ethnic Affairs in its delineation of its core constituency: “People whose culture and traditions distinguish them from the majority of people in New Zealand, i.e. those who are not of Māori, New Zealand European/Pakeha or Pacific Island heritage” (Office of Ethnic Affairs, 2001). This report follows the same definition, but data on other groups (Māori, Pasifika and Pakeha) are included as a point of comparison. In late 2012, EPAP asked the Research, Investigations and Monitoring Unit at Auckland Council to prepare a report on the status of ethnic communities in Auckland. This report draws together a wide range of existing literature on ethnicity in Auckland. Many sections have been directly excerpted from these existing documents with only slight modifications where updates to data were available. It was decided not to provide an Executive Summary for this report because of the breadth of data included and because in many cases the Executive Summaries of these existing documents are presented here. Because some of these reports were prepared prior to the amalgamation of the legacy councils, old Territorial Authority boundaries are used in some sections. 1 ‘International migration’ in this report refers to all movements into and out of New Zealand, including of New Zealand citizens, while ‘immigration’ is used to refer to the in-migration of new migrants who have come under the Immigration Act 1987. Ethnicity and Migration in Auckland 1
Providing detailed and accurate data on ethnicity and migration in Auckland is difficult, for
three main reasons: firstly, because of the postponement of the 2011 census; secondly,
small sample sizes for numerically small ethnic communities make it difficult to generate
statistically significant results; and thirdly, the confidentiality requirements around data use
mean that it is not possible to report census results for numerically small ethnic
communities. We have attempted to provide the best available data within these constraints,
but much of the data presented here is several years old and is for large ethnic categories
such as ‘Asian’ and ‘Pasifika’. The focus in this report is on large quantitative surveys, rather
than more qualitative academic work, as these provide the best overview of the status of
ethnic communities.

Ethnicity and Migration in Auckland                                                                 2
2.0 Immigration2
2.1 New Zealand immigration policy since 1986

Although this report focuses on Auckland, changes in immigration patterns can only be fully
understood within the context of national immigration policy. In 1986, New Zealand’s
immigration policy was reviewed and this resulted in the Immigration Act 1987, legislation
that radically changed the criteria for the admission of new migrants into New Zealand.
Whereas previously there had been preferred source countries, the new policy focused on
the characteristics of individual migrants, especially favouring those with high levels of
education and/or work experience, those who were relatively young, and those who would
bring investment capital into the country. In 1991, the points system was established to
precisely quantify these criteria, although the number of points needed fluctuated according
to migrant quotas set by the government.

There have been a number of adjustments to immigration policy since 1991, especially
related to English language capabilities and the emphasis placed on certain criteria such as
work experience in New Zealand. However, at the time of the 2006 census, the source of
much of the data reported in this section, the fundamental policy in effect was the one that
had been initiated twenty years earlier.

2.2 Permanent residency trends

In the early 1980s, the number of visas and permits approved for permanent residence in
New Zealand hovered around 10,000 per year. From 1987 onwards, this rose dramatically to
peak at about 56,000 in 1996 (see Figure 1). The English language bond introduced in late
1995, among other factors, reduced these levels for several years. The bond was ultimately
replaced by a less punitive system and permanent residency approvals started to climb
again (in 1998, the $20,000 English language bond for non-principal residence applicants
was abolished and replaced with pre-paid English language training, in a bid to improve
language skills of migrants). The increase in numbers of permanent residency visas from
2001 appears to have been influenced by the events of 11 September 2001. Another policy
change in 2003 resulted in a temporary downturn, before this reversed again from 2004-5.

The global economic slowdown affected migration trends across the OECD from 2008-9.
Migration into OECD countries fell in 2010 for the third year in a row, but started to rise again
in most countries in 2011. This suggests that the recent slowdown in migration into OECD
countries may have come to an end. In 2011/12, 40,448 people were approved for residence
in New Zealand, compared with 40,737 in 2010/11.

2
 Much of this chapter has been directly excerpted from: Social and Economic Research and Monitoring Team
and Friesen, Ward (2007) Immigration and Ethnicity in the Auckland Region: Results from the 2006 Census of
Population and Dwellings. Auckland: Auckland Regional Council. Data and graphs have been updated where
possible.

Ethnicity and Migration in Auckland                                                                          3
Figure 1: Number of permanent residency visas and permits approved 1982-2012 (March
years)3
                                                                                                                  New
                      60000
                                                                                                                  policy
                                                                                                                  Dec. 2003
                      50000
                                                          Points                         Bond
                                                          system                         modified
    Number approved

                      40000
                                     Immigration Act
                                     1987
                                                                                                        IELTS to 6.5
                      30000
                                                                                                        (from 5)

                                                                        English Language
                      20000
                                                                        Bond Oct. 1995

                      10000

                         0
                              1982

                                     1984

                                            1986

                                                   1988

                                                          1990

                                                                 1992

                                                                           1994

                                                                                  1996

                                                                                          1998

                                                                                                 2000

                                                                                                           2002

                                                                                                                    2004

                                                                                                                           2006

                                                                                                                                  2008

                                                                                                                                         2010

                                                                                                                                                2012
                                                                          Year (ended March)

Source: N.Z. Immigration Service data
Note: IELTS stands for International English Language Testing System

Figure 2 shows recent trends in the number of residence approvals from primary source
countries.4 The United Kingdom remains, in 2011-12, the main source country (15%). The
proportion from the United Kingdom increased significantly in the first half of the decade
(from 14% in 2002/03 to 29 per cent in 2005/06), but has decreased since then. China and
India are the next largest source countries (13% each), followed by the Philippines (8%), and
Fiji and South Africa (6% each).

Skilled Migrant Category (SMC) approvals (18,843 people) accounted for just under half of
all residence approvals in 2011/12. The number of SMC approvals was down 11 per cent
(2,369 people fewer) on the previous year. The decrease reflects a flow-on effect from the
prior decrease in Essential Skills workers due to the global recession.

India has overtaken the United Kingdom as the top source country for SMC principal
applicants in 2011/12. The number of SMC principal applicants from India increased by 27
per cent from 2010/11. The increase from India is mainly due to former Indian international
students who transition to temporary work and then to permanent residence.5

3
  Data for 2007 and 2008 was unavailable at the time this report was prepared.
4
  We are unable to update this graph with 2011/12 data as numbers of people approved are not available for
each year.
5
  Labour and Immigration Research Centre (2012) Migration Trends Key Indicators Report: July 2011-June 2012.
Figure 2: Comparison of residence approvals by largest source countries, 2008/09–2010/11 Source: Department of Labour, Migration Trends and Outlook 2010/11 2.3 Overseas born populations There has been a steady increase in the proportion of the national overseas-born population since changes were made to New Zealand’s immigration policy in 1987. According to the 1986 census, only 15 per cent of the New Zealand population were overseas born. This increased steadily to reach 23 per cent by 2006, a relatively high proportion by OECD standards.6 As a major migration destination, the Auckland region has also shown a steady increase in the proportion of overseas-born over the last two decades. In 1986, 23 per cent of Auckland’s population was born overseas, this proportion has steadily risen to reach 37 per cent by 2006. Table 1 shows the numbers of usual residents in the Auckland region within each birthplace group. In 2006, 63 per cent of the population were born in New Zealand. The next largest group were those born in Asia, at 13 per cent. 6 According to OECD data for 2009, the proportion of the population classified as ‘immigrant or foreign’ is: 23 per cent for New Zealand, 26 per cent for Australia, 20 per cent for Canada and 11 per cent for the United Kingdom (http://stats.oecd.org/). Ethnicity and Migration in Auckland 5
Table 1: Region of birth, Auckland residents (2006)
                                                      1996                 2001                2006
Australia                                             18,486       2%      18,843      2%      20,220      2%
Pacific Islands                                       70,068       7%      85,371      8%      99,840      8%
United Kingdom and Ireland                            86,880       9%      83,079      8%      88,461      7%
Europe (excl. United Kingdom and                      20,019       2%      22,194      2%      25,770      2%
Ireland)
North America                                         6,987        1%      7,689       1%      9,171       1%
Asia                                                  71,259       7%      106,608     10%     166,122     13%
Other                                                 14,250       1%      30,342      3%      46,446      4%
Total Overseas                                        287,949      29%     354,126     32%     456,030     37%
New Zealand                                           720,789      71%     749,340     68%     776,472     63%
Not Elsewhere Included                                59,907       Excl.   55,425      Excl.   70,569      Excl.
Total Birthplace                                      1,068,645    100%    1,158,891   100%    1,303,068   100%

Note: Not elsewhere included responses are not included in calculation of percentages.

Figure 3 shows that there has been an increase in the numbers of overseas-born people
living in Auckland from most source regions, particularly the number born in Asian countries
(of the 2006 Auckland population, 166,000 residents were born in Asian countries), and in
the Pacific Islands (in 2006, 99,840 residents).

The increase in numbers of residents who were born in the UK and Ireland is also notable. In
previous years, the population born in the United Kingdom and Ireland had been static or
declining as the longer-term migrant population aged. However, in the 2001 to 2006 period,
there was a surge in British immigration which reversed this trend. The steady increase in
numbers from ‘other’ regions is strongly influenced by the immigration of migrants from
Africa, especially from South Africa.

Figure 3: Numbers of overseas born by area of birth, Auckland region residents (1991 to 2006)

          180,000

          160,000                1991     1996    2001     2006

          140,000

          120,000

          100,000
 number

           80,000

           60,000

           40,000

           20,000

               0
                    Australia   Pacific Islands UK and Ireland    Asia     Other

Source: New Zealand Census

Ethnicity and Migration in Auckland                                                                                6
2.4 Length of time in New Zealand
The patterns of migration and length of time living in New Zealand vary considerably across
different migrant groups, as shown in Figure 4. The majority of the population born in
England arrived in the period before the change in immigration policy in 1987, but a
significant number also arrived in the five years between 2001 and 2006. Pacific countries
are characterised by longer-term residence, although there has also been considerable
migration from these countries in recent years. Between the 2001 and 2006 censuses, the
most notable increases were from China and India, in each case more than doubling their
populations over this period.
Figure 4: Number of overseas born by period of arrival in New Zealand, Auckland region
residents (2006)
80,000
New Migrant (arr. 2001-06)
70,000
Middle Migrant (arr. 1987-2000)
Old Policy Migrant (arr. pre 1987)
60,000
Arrival time unknown
50,000
40,000
30,000
20,000
10,000
0
n
ia
i
a
nd
R
a
sia
ica
a
re a
d
s
es
F ij
iwa
ng
nd
mo
ali
an
,P
Ind
pin
gla
lay
Af r
Ko
st r
To
a
ot l
Sa
ina
Ta
Isl
ilip
En
Ma
Au
Sc
uth
uth
Ch
ok
Ph
So
So
Co
Birthplace
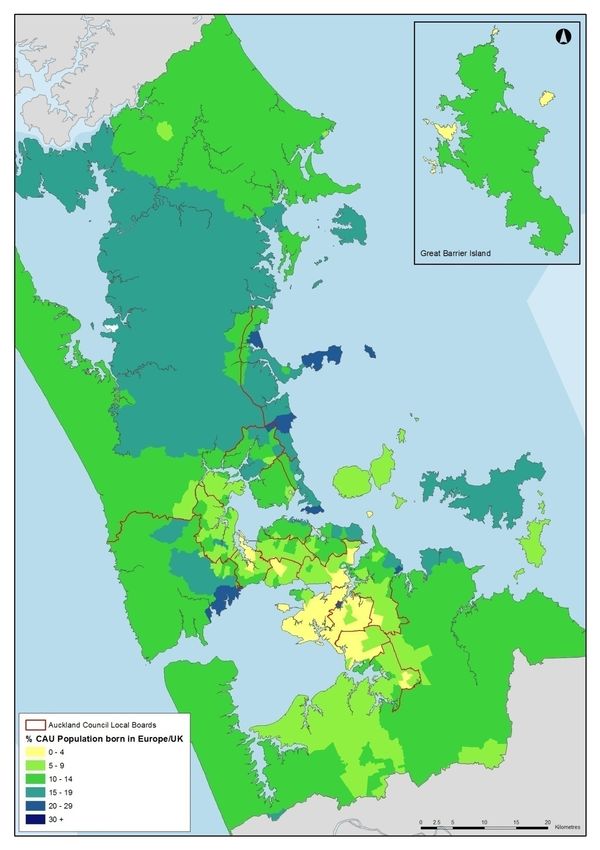
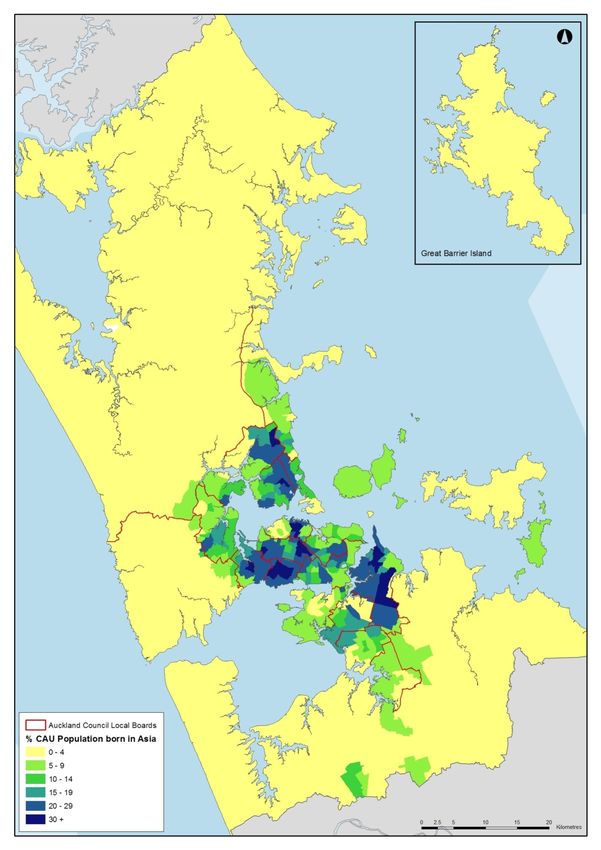
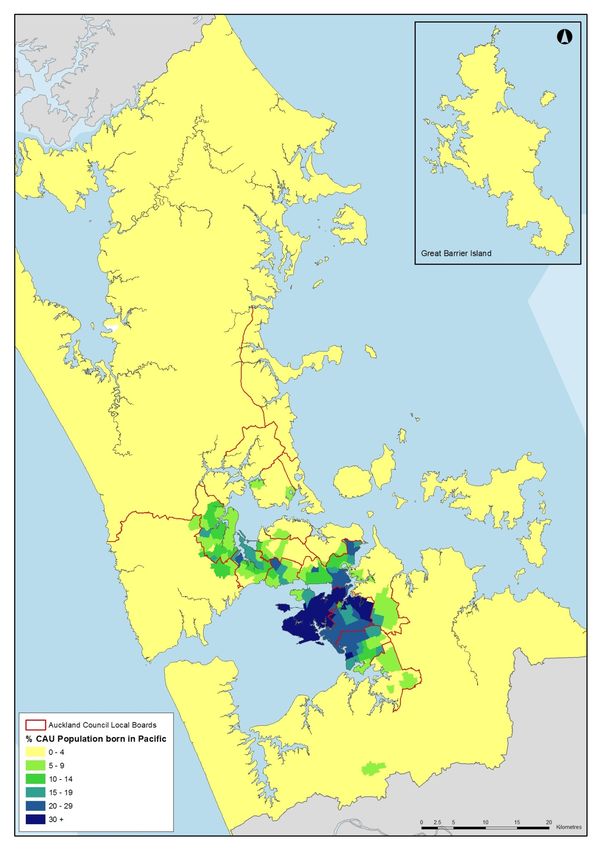
2.5 Spatiality of migrant settlement in Auckland
The residential settlement patterns of migrant groups vary considerably. This is a
phenomenon common to cities in many parts of the world. If we consider the three largest
migrant groupings in the Auckland region, namely those from UK and Europe, the Pacific,
and Asia there are obvious differences. Please not that the data and maps for this section
Ethnicity and Migration in Auckland 7were generated prior to the amalgamation of the Auckland Council and use legacy terminology. The population born in UK and Europe (most of which originates from the UK) is shown to be spread throughout the region with the main exception of the western parts of Manukau City (see Figure 5). Of the three largest migrant groups, this is the only one which has significant proportions in the rural and peri-urban parts of the region. Notable concentrations include Orewa, Whangaparaoa, North Shore Bays, Devonport, the Manukau Harbour coast of Waitakere city, and parts of Howick. These locations suggest the strong attraction of British and European migrants to coastal locations, and their ability to pay to live in these areas. Migrants from the Pacific Islands have a settlement pattern almost the opposite of those from Europe (Figure 6). The greatest concentrations are in Manukau city around the suburbs of Otara, Mangere and Manukau, as well as in Auckland city in Otahuhu and Glen Innes. These are suburbs with significant public sector housing as well as facilities serving Pacific populations such as churches and markets. Another band of Pasifika settlement runs through the southern suburbs of Auckland city into the eastern suburbs of Waitakere city. Some of these areas also have blocks of public housing but also areas of lower to middle cost private housing. There are several concentrations of the Asian-born population in the Auckland region, which are made up of different groups (Figure 7). Much of the cluster running through the middle of North Shore city is comprised of Koreans who settled in that area from the early 1990s onwards and have established churches and other cultural facilities there. Another cluster in the Central Business District is made up of a variety of Asian groups, especially Chinese and Korean, and much of this population is made up of students. The concentrations in the south-western parts of Auckland city (Mount Roskill and Mount Albert) are also diverse, with considerable numbers of Indian and Chinese migrants but with other groups also represented. These suburbs are areas of medium cost housing, and so have attracted both migrant renters and homeowners. In the suburbs around Epsom, higher value properties also house Asian migrants. The other major cluster of Asian-born migrants runs in a band from Pakuranga-Howick through the east Tamaki corridor. The predominant group in this population is Chinese, particularly those who arrived with significant assets, such as the Taiwanese and Hong Kong migrants of the 1990s, but the number of migrants from the People’s Republic of China has continued to increase in this area as well. Ethnicity and Migration in Auckland 8
Figure 5: Percentage born in Europe / UK by Census Area Unit (2006)

Ethnicity and Migration in Auckland                                   9
Figure 6: Percentage born in Pacific Islands by Census Area Unit (2006)

Ethnicity and Migration in Auckland                                       10
Figure 7: Percentage born in Asia by Census Area Unit (2006)

Ethnicity and Migration in Auckland                            11
3.0 Characteristics of ethnic groups in
  Auckland7
The previous chapter focused on ‘migrants’ living in the Auckland region, according to
residents’ places of birth. However, this report is concerned with ethnic identity, which
includes both migrants and the New Zealand-born ethnic population.

Ethnicity is a measure of cultural affiliation, as opposed to race, ancestry, nationality or
citizenship, and is self-reported in the census. In line with previous censuses, people could
identify with more than one ethnicity in 2006. All responses are included in the data so tables
showing proportions may add up to more than 100 per cent.8

There have been two important changes to the way that ethnicity results were grouped and
published in 2006, with the creation of two new categories – ‘Middle Eastern, Latin
American, African’ (MELAA) and ‘New Zealander’. These are briefly discussed below.
    • Middle Eastern/ Latin American/ African (MELAA) - these responses were
       formerly reported in the ‘Other’ count. A total of 18,555 usual residents in the
       Auckland region were included in this category in 2006.
    • New Zealander – in previous censuses, those who responded ‘New Zealander’ or
       ‘Kiwi’ were assumed to be European and were included in the ‘NZ European’ count.
       Approximately 2 per cent of the national population identified as ‘New Zealander’ in
       2001; this increased to 11 per cent (99,258 usual residents in Auckland) in 2006,
       which may be linked to discussion of possible changes to the ethnicity question in
       national media prior to the census. Recognising that such respondents might be from
       diverse ethnic backgrounds, a separate ‘New Zealander’ category was created for
       the first time. The creation of this separate category for reporting purposes
       contributed to the drop in the proportion of those who identified as European (53.6%
       in 2006 compared with 65.1% in 2001).9
Therefore some caution must be taken when comparing results from previous censuses
since these new classifications have reduced the size of previously defined categories.
‘MELAA’ was previously mostly in ‘other’, while ‘New Zealander’ mainly reduced the size of
the ‘New Zealand European’ group, but also some other groups.

7
  Much of this chapter has been directly excerpted from: Social and Economic Research and Monitoring Team
and Friesen, Ward (2007) Immigration and Ethnicity in the Auckland Region: Results from the 2006 Census of
Population and Dwellings. Auckland: Auckland Regional Council. Data and graphs have been updated where
possible.
8
  Census data on ethnicity is recorded at different levels. Level 3 is the more detailed, i.e., ethnicity according to
a particular language or sub-national region, e.g., ‘Gujarati’ or ‘Welsh’. More commonly used is ‘level 2’ ethnicity
which often equates to a nationality or an ethnicity originating in a nation state e.g. ‘Indian’ or ‘British’. Most
commonly used is ‘level 1’ ethnicity which is usually made up of multinational ethnic groups e.g. ‘Asian’ or
‘European’. In this report both level 1 and level 2 categories of ethnicity are used. The level 1 category ‘European’
includes both ‘ethnic’ (according to the Office of Ethnic Affairs definition) Europeans, such as Continental
Europeans, and non-‘ethnic’ Europeans, such as New Zealand Europeans, Australians, Americans, Canadians,
and British.
9
  Note also that in some of the published statistics from the 2006 Census, the ‘New Zealander’ category has been
regrouped with the ‘NZ European’ count especially for comparison to earlier censuses.

Ethnicity and Migration in Auckland                                                                                      12
3.1 Ethnic composition in Auckland
The largest proportion of the Auckland region’s population identifies as European (56.5%),
but this proportion is significantly lower than for New Zealand (67.6%). Within this group, 87
per cent identified as ‘New Zealand European’.
The European ethnic group proportion in Auckland has decreased quite dramatically from
previous years, dropping from 75.1 per cent in 1991. The reduction between 2001 and 2006
is partly a result of the separate classification of ‘New Zealander’ in the latter census, but
also involves the growth of other ethnic groups.
The greatest proportional increase of any ethnic group in the last 15 years or so has been
amongst those of Asian origin. In 1991, the proportion that identified as Asian in the
Auckland region was 5.5 per cent. A decade later, 13.1 per cent identified as Asian and by
2006 this proportion had grown to 18.9 per cent. This change is the result of rapid increases
in immigration, especially in the mid 1990s and then again early in the new century. Further,
a large proportion of Asian immigrants have settled in the Auckland region – in 2006, 66.1
per cent of all those who identified as Asian lived in the Auckland region (see Table 5).
Pacific populations have also continued to increase as a proportion of the Auckland
population. Pasifika comprised 11.9 per cent of the Auckland regional population in 1991,
13.3 per cent in 2001, and 14.4 per cent in 2006. Although modest levels of immigration
continued from the Pacific Islands to New Zealand during this time, there were also some
return movements to the Islands, so these increases are mainly the result of natural
increase.
Although the number of Māori in the Auckland region has increased between each census,
the proportion has remained relatively stable – the proportion of Māori in 1991 was 11.1 per
cent, increased to 11.6 per cent in 2001 and then returned to 11.1 per cent in 2006. For a full
list of ethnic groups in the Auckland region as at the 2006 census, refer to Appendix 1.
Table 2: Ethnic groupings in Auckland region, Level 1 (2006)
Total Ethnic Total Auckland
response group as a responses population
% of New as a % of
Auckland Zealand NZ total
region
population
European 698,622 56.5 2,609,589 26.8
Māori 137,133 11.1 565,329 24.3
Pasifika 177,936 14.4 265,974 66.9
Asian 234,222 18.9 354,552 66.1
Middle Eastern/ Latin American/ African 18,555 1.5 34,746 53.4
New Zealander 99,258 8.0 429,429 23.1
Other 'Other' Ethnicity 648 0.1 1,494 43.4
Total People 1,237,239 -- 3,860,163 32.1
Note: These data include only those who specified at least one ethnicity (i.e. ‘not elsewhere included’
responses are excluded from the calculation). Total percentages add up to more than 100% as
people could identify with more than one ethnicity.
Ethnicity and Migration in Auckland 133.2 Ethnicity by Local Board Area
Ethnic diversity is particularly apparent in the following Local Board Areas, where under half
of the usual residents identified as European: Mangere-Otahuhu (20% European),
Manurewa (40%), Maungakiekie-Tamaki (44%), Otara-Papatoetoe (25%), Puketapapa
(39%), and Whau (44%) (Table 3). The Local Board Areas with the highest proportion of
residents who identified as European were Great Barrier (80%), Hibiscus and Bays (81%),
Rodney (81%) and Waiheke (82%).
Table 3: Ethnicity by Local Board, Level 1 (2006)
European Māori Pasifika Asian MELAA Other Not Total
Elsewhe
re
Included
No % No % No % No % No % No % No No
Albert-Eden 50,433 5 5,505 6 7,236 8 23,100 2 1,617 2 7,113 8 3,675 91,035
8 6
Devonport- 36,726 7 2,634 5 990 2 8,310 1 660 1 5,229 1 1,446 52,653
Takapuna 2 6 0
Franklin 42,441 7 6,939 1 1,809 3 2,793 5 147 0 6,585 1 3,210 58,575
7 3 2
Great 642 8 171 2 18 2 6 1 0 0 93 1 93 897
Barrier 0 1 2
Henderson- 50,169 5 14,670 1 17,334 1 15,405 1 1,545 2 6,843 7 6,375 98,685
Massey 4 6 9 7
Hibiscus 64,359 8 4,308 5 1,242 2 5,979 7 522 1 8,919 1 1,953 81,858
and Bays 1 1
Kaipatiki 46,584 6 6,738 9 4,470 6 16,980 2 1,719 2 7,041 9 2,637 79,128
1 2
Mangere- 12,414 2 10,869 1 36,603 5 8,961 1 357 1 1,542 2 5,640 68,127
Otahuhu 0 7 9 4
Manurewa 28,554 4 19,794 2 20,448 2 10,656 1 1,533 2 3,696 5 5,331 77,205
0 8 8 5
Maungakiek 27,933 4 8,910 1 17,232 2 12,606 2 843 1 4,020 6 3,006 66,399
ie-Tamaki 4 4 7 0
Orakei 51,489 7 3,327 5 2,106 3 11,040 1 1,134 2 7,497 1 2,511 74,559
1 5 0
Otara- 16,572 2 12,000 1 30,645 4 14,910 2 717 1 2,028 3 5,154 72,309
Papatoetoe 5 8 6 2
Papakura 23,634 6 11,091 2 4,323 1 3,300 8 468 1 3,330 8 2,055 41,649
0 8 1
Puketapapa 18,843 3 2,673 6 7,095 1 19,233 4 1,299 3 2,664 6 2,538 50,778
9 5 0
Rodney 37,806 8 4,677 1 1,092 2 1,143 2 159 0 6,456 1 2,424 49,293
1 0 4
Howick 62,151 5 5,739 5 4,299 4 35,175 3 2,007 2 8,814 8 2,823 113,505
6 2
Upper 26,601 6 2,427 6 918 2 9,387 2 915 2 4,506 1 1,041 42,960
Harbour 3 2 1
Waiheke 6,102 8 915 1 285 4 192 3 39 1 792 1 354 7,797
2 2 1
Waitakere 31,671 7 4,488 1 4,287 1 3,072 7 435 1 4,368 1 2,727 45,579
Ranges 4 0 0 0
Waitemata 36,195 6 3,558 6 3,870 7 11,568 2 1,023 2 4,638 8 6,849 62,889
5 1
Whau 28,893 4 5,874 9 11,640 1 20,469 3 1,413 2 3,945 6 4,065 69,135
4 8 1
Total Local 700,20 5 137,30 1 177,94 1 234,27 1 18,55 1 100,12 8 65,907 1,305,0
Boards 9 7 7 1 8 4 9 9 8 2 21
Note: These data include only those who specified at least one ethnicity (i.e. ‘not elsewhere included’
responses are excluded from the calculation). Total percentages add up to more than 100% as
people could identify with more than one ethnicity.
Ethnicity and Migration in Auckland 14Ethnicity and Migration in Auckland 15
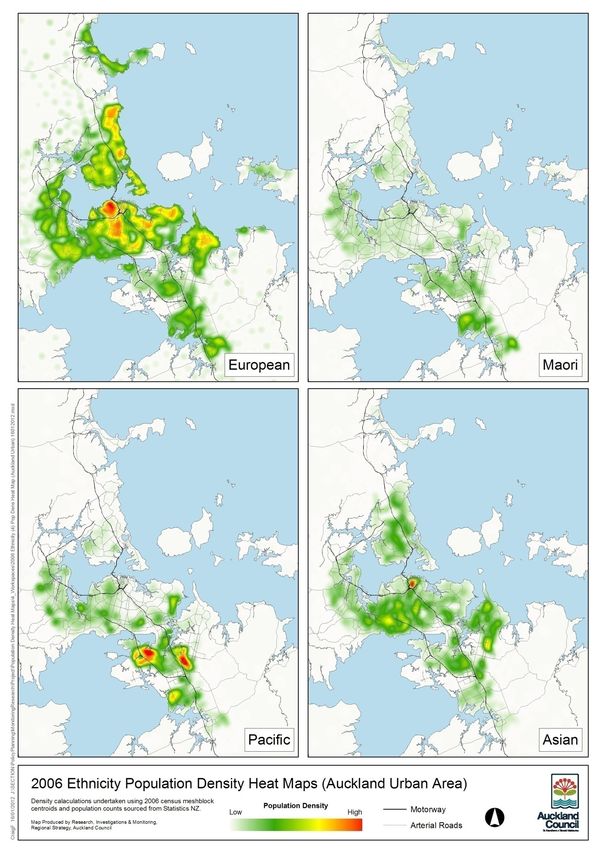
As Table 3 and the Population Density Heat Maps show, there were relatively higher
proportions of Māori in Great Barrier (21%), Manurewa (28%) and Papakura (28%). Pasifika
are concentrated in Mangere-Otahuhu (59%) and Otara-Papatoetoe (46%), and to a lesser
extent in Manurewa (28%) and Maungakiekie-Tamaki (27%). There are relatively higher
proportions of Asians in Puketapapa (40%), Howick (32%) and Whau (31%).

3.3 Ethnicity by birthplace

The complexities of ethnic identity are illustrated by the diversity of birthplaces within and
across ethnic groups. When considering the main birthplaces of the largest ethnic groups
(level 2) in the Auckland region, a great deal of interesting information is evident, such as:
    • The proportion of New Zealand born ranges from 98 per cent for Māori to 3 per cent
        for South African, and 6 per cent for Korean.
    • Those who identified as New Zealander were mainly born in New Zealand (91%) but
        it is interesting to note that there were significant numbers who were born in other
        countries, particularly England.
    • For the two largest Asian ethnic groups, Chinese and Indian, about one-fifth were
        born in New Zealand (19% and 20% respectively), reflecting the long-term history of
        these groups in this country. This is in contrast with only 6 per cent of Koreans born
        in New Zealand – most of these are the children of recent migrants.
    • Just over half of the Chinese ethnic group were born in the People’s Republic of
        China with significant numbers from Taiwan, Malaysia, Hong Kong, Singapore and
        Malaysia, reflecting migration trends in the 1990s.
    • The Indian population who were not New Zealand-born largely originated from India
        and Fiji, although migrants from South Africa and Malaysia are also notable.
    • The majority of all four largest Pacific ethnic groups were New Zealand born: 72 per
        cent of Niueans, 69 per cent of Cook Islands Māori, 57 per cent of Samoans and 54
        per cent of Tongans.
    • A large number of residents who were born in South Africa identified as NZ European
        (6,957 compared to 12,018 who identified as South African) (people may have
        identified as both).

3.4 Age-sex structure of ethnic groups

The markedly different age-sex structures of the main ethnic groups are the outcome of
different migration histories and demographic characteristics.

Eighty-five per cent of the European population were born in New Zealand, reflecting the
size of this group in the region. The age-sex characteristics of this group are mainly a result
of demographic changes that have taken place in recent decades within New Zealand
(especially reduced birth rates and an ageing population). International migration has had
some impact on these age structures, especially with the common pattern of many people in
their twenties heading overseas for a period, and this is visible in the pyramid in Figure 8.

The majority of those who identify as Māori are New Zealand born and the age-sex
characteristics shown in Figure 9 also reflect the demographic changes evident within New
Zealand in recent decades. Although Māori birth rates declined dramatically in the last 50

Ethnicity and Migration in Auckland                                                               16
years, the age structure is still much younger than the total population, as a result of high
levels of fertility in the younger age cohorts and lower levels of life expectancy among Māori.
The latter is reflected in the relatively low proportions of the population in older age cohorts.
The age-sex structure of Pasifika is similar to that of Māori, except that proportions at the
youngest cohorts are even higher. These characteristics result from demographic factors
operating both in New Zealand and in the Pacific nations of origin. In both cases, fertility
rates are relatively high, although within New Zealand these rates have declined with long-
term residency and with changes in socio-economic status (see Figure 10).
Asian age-sex structure in the Auckland region is notably different from that of the other
broad ethnic groups (Figure 11). The effects of immigration policy on this structure are clear,
with relatively large numbers in the 15 to 24 year groups (particularly aged 20 to 24 years),
reflecting large numbers of students arriving under the provisions of the international student
visa. Also, the large cohorts aged between 35 and 49 and relatively small cohorts over 60
years, reflect the age selectivity of the general (skilled) immigration policy.
Figure 8: Age sex structure, European ethnic group, Auckland (2006)
N Z Europe an population and Auckland re gional population (shade d)
85+
80-84
Males Females
75-79
70-74
65-69
60-64
55-59
50-54
45-49
40-44
35-39
30-34
25-29
20-24
15-19
10-14
5- 9
0- 4
7 6 5 4 3 2 1 0 1 2 3 4 5 6 7
Percentages
Ethnicity and Migration in Auckland 17Figure 9: Age sex structure, Māori ethnic group, Auckland (2006)
M aori population and Auckland re gional population (shade d)
85+
80-84
Males Females
75-79
70-74
65-69
60-64
55-59
50-54
45-49
40-44
35-39
30-34
25-29
20-24
15-19
10-14
5- 9
0- 4
7 6 5 4 3 2 1 0 1 2 3 4 5 6 7
Percentages
Figure 10: Age sex structure, Pacific ethnic group, Auckland (2006)
Pacific Islands population and Auckland re gional population (shaded)
85+
80-84
75-79 Males Females
70-74
65-69
60-64
55-59
50-54
45-49
40-44
35-39
30-34
25-29
20-24
15-19
10-14
5- 9
0- 4
7 6 5 4 3 2 1 0 1 2 3 4 5 6 7
Percentages
Ethnicity and Migration in Auckland 18Figure 11: Age sex structure, Asian ethnic group, Auckland (2006)
Asian population and Auckland regional population (shade d)
Males Females
85+
80-84
75-79
70-74
65-69
60-64
55-59
50-54
45-49
40-44
35-39
30-34
25-29
20-24
15-19
10-14
5- 9
0- 4
7 6 5 4 3 2 1 0 1 2 3 4 5 6 7
Percentages
3.5 Labour force status, unemployment and NEET youth10
The labour force participation rate is the proportion of people aged 15 years and over who
are employed, or unemployed and actively seeking work. Overall, the labour force
participation rate in Auckland has been relatively stable over the last decade, increasing
slightly over time from 65.6 per cent in March 2001 to 67.9 per cent in December 2012.
Labour force participation varies across ethnic groups and reflects variety in age-sex
composition, length of time in New Zealand (for those that are overseas-born) and
educational qualifications. However, even when these factors are controlled for, there are
differences between ethnic groups.
The results presented here are an overview and mask diverse outcomes within different
groups. Within each level 1 ethnic category, e.g. Asian or MELAA, there are many different
ethnic groups each of which has its own distinct characteristics. Unfortunately, data is not
gathered at a sufficient level of detail to enable reporting on the full extent of this diversity.
December 2012 figures show that those of European ethnicity had the highest participation
rate (70.9%), Pasifika had the lowest rate (56.2%), with Māori (64.8%), Asian (66.1%) and
Middle Eastern/Latin American/African (MELAA; 60.9%) in the middle.
10
This section includes excerpts from Allpress, J. A., 2013, Skills and the labour market in Auckland. Auckland
Council Technical Publication.
Ethnicity and Migration in Auckland 19In terms of changes over time, most groups experienced a slight decline in participation in
2009 and 2010, however all groups other than Pasifika have stabilised or returned to pre-
recession levels.
The lower rates of participation amongst Asians may reflect greater proportions in this group
of international students and individuals with a large asset base who are living off that, rather
than income.
Figure 12: Participation rate (%), split by ethnicity
90
80
70
Participation Rate (%)
60
50
40
30
20
Jun Dec Jun Dec Jun Dec Jun Dec Jun Dec Jun Dec Jun Dec Jun Dec Jun Dec Jun Dec Jun Dec Jun Dec
01 01 02 02 03 03 04 04 05 05 06 06 07 07 08 08 09 09 10 10 11 11 12 12
European Māori Pacific Peoples Asian MELAA/Other Total
Source: Statistics New Zealand, Household Labour Force Survey (HLFS).
The unemployment rate is the percentage of individuals in the labour force who are without a
paid job, are available for work, and are actively seeking work.
Unemployment in Auckland rose sharply – as it did in the rest of New Zealand and other
developed countries – in 2008 and 2009 as the Global Financial Crisis unfolded. Although
Auckland experienced a slight economic recovery, and decrease in unemployment, in the
latter half of 2010 and throughout 2011, unemployment levels have risen again in 2012. The
unemployment rate in Auckland in December 2012 was 7.2 per cent.
An analysis of unemployment by ethnicity shows that Māori and Pasifika have had
persistently higher unemployment than European and Asian workers over the last 11 years,
and also suffered greater increases in unemployment as a result of the financial crisis.
The December 2012 HLFS figures show unemployment rates of 14.0 per cent for Māori,
16.3 per cent for Pasifika, 7.3 per cent for MELAA, 8.4 per cent for Asian, and 5.0 per cent
for Europeans.
Ethnicity and Migration in Auckland 20While there is likely to be some degree of crossover between the patterns seen for ethnicity
and age, as a result of the relative youth of Māori and Pasifika communities, ethnicity and
age do appear to be independent predictors of unemployment rates. Differences among
ethnic groups are still seen within each age cohort, and differences among age groups are
still seen within each ethnicity.
Figure 13: Unemployment rate (%), split by ethnicity.
20
18
Unemployment Rate (%)
16
14
12
10
8
6
4
2
0
Jun 01
Dec 01
Jun 02
Dec 02
Jun 03
Dec 03
Jun 04
Dec 04
Jun 05
Dec 05
Jun 06
Dec 06
Jun 07
Dec 07
Jun 08
Dec 08
Jun 09
Dec 09
Jun 10
Dec 10
Jun 11
Dec 11
Jun 12
Dec 12
European Māori Pacific Peoples Asian MELAA/Other
Source: Statistics New Zealand, HLFS.
The NEET (not in education, employment or training) rate is defined by Statistics New
Zealand as the percentage of youth (aged 15-24 years) who are:
• unemployed (part of the labour force) and not engaged in education or training, or
• not in the labour force, and not engaged in education or training.
NEET is designed to more fully capture youth who are disengaged from both the labour
market and the education system than the official measure of unemployment. The NEET
rate is a valuable measure, in addition to youth unemployment, because it provides a wider
measure of the percentage of youth who are neither employed nor engaged in activities
(education or training) that contribute to the development of skills, and therefore improve
future work, and life prospects.
NEET status can be seen as a risk factor for exclusion and prolonged marginalisation from
the labour market.
Ethnicity and Migration in Auckland 21Figure 14: NEET rate (%) for all youth aged 15-24 years.
35
30
25
NEET rate (%)
20
15
10
5
0
Dec Mar Jun Sep Dec Mar Jun Sep Dec Mar Jun Sep Dec Mar Jun Sep Dec Mar Jun Sep Dec
07 08 08 08 08 09 09 09 09 10 10 10 10 11 11 11 11 12 12 12 12
European Māori Pacific Peoples Asian Total responding
Source: Statistics New Zealand, HLFS.
The overall NEET rate showed a small jump between late 2008 and early 2009 to
approximately 15 per cent. From 2009, the rate has remained between 10 and 15 per cent.
Independent of age, NEET rates have, over the last five years, been consistently higher
amongst Māori and Pasifika than European and Asian youth. In December 2012, the overall
(15-24 years) NEET rates for both Māori (21.6%) and Pasifika (21.0%) were approximately
twice as high as for youth of European (10.4%) and Asian (11%) ethnicity.
3.6 Occupation
There are several significant differences in occupational patterns across ethnic groups.
Relatively small proportions of Pasifika are employed in managerial and professional
occupations compared to other ethnic groups. The proportion of professionals is highest for
those classified as European (25.2%) and ‘Other Ethnicity’ (24.9%).
The proportion of those who identify as Asian in each occupational category is similar to that
for the Auckland population as a whole, with the exception of sales which accounts for 15.8
per cent of Asian workers as compared to only 10.8 per cent of all Auckland workers.
For the occupational categories which can be considered semi-professional or semi-skilled
(technicians and trades, community and personal services, clerical and administrative), there
is less difference between groups.
Within the levels of occupations with least formal training requirements (labourers and
machinery operators and drivers), Pasifika and Māori have the highest representation. This
appears to be closely related to educational qualifications (see comments below).
Ethnicity and Migration in Auckland 22Table 4: Occupation, by ethnicity (2006)
European Māori Pasifika Asian Other Total
Managers 19.7% 12.3% 7.5% 15.1% 22.7% 17.9%
Professionals 25.2% 15.2% 10.8% 20.7% 24.9% 22.6%
Technicians and Trades Workers 12.8% 12.9% 13.4% 12.3% 11.7% 12.7%
Community and Personal Service Workers 7.4% 10.3% 10.3% 7.6% 6.7% 7.7%
Clerical and Administrative Workers 14.9% 14.1% 13.2% 13.2% 15.4% 14.4%
Sales Workers 10.3% 9.4% 9.6% 15.8% 9.9% 10.8%
Machinery Operators and Drivers 4.1% 12.6% 15.9% 6.2% 3.9% 6.1%
Labourers 5.7% 13.2% 19.3% 9.1% 4.8% 7.8%
Unidentifiable, Outside Scope and Not Stated Excl. Excl. Excl. Excl. Excl. Excl.
Total 100% 100% 100% 100% 100% 100%
Note: Not elsewhere included responses are not included
3.7 Skill-based underemployment of immigrants11
Skill-based underemployment occurs when an individual possesses skills that are not fully
utilised in their current role. Workers are most productive when their skills match the skills
required for their job. Productivity decreases when workers have either more or fewer skills
than are required for the job (Poot and Stillman, 2010).
There are no official, regularly reported statistics on skilled-based underemployment in
Auckland. The lack of official measure is due, in part, to the difficulty of measuring skilled-
based underemployment. Attempts to measure this form of underemployment have most
commonly used qualifications as a proxy for skills, where an individual’s qualification is
compared to either the qualification most common within that occupation, or the qualification
level that is determined by experts as being required to perform the job satisfactorily.
The OECD (2012) conducted an analysis of over-qualification among highly-educated New
Zealanders, comparing rates in 2000-2001 with 2009-2010 (over-qualification was defined
as the number of highly educated employees [ISCED 5/6] in a low or medium occupation
[ISCO 4 to 9], expressed as a percentage of all highly educated persons). Their analysis
showed that in 2009-2010, 38.0 per cent of highly educated, native-born New Zealanders
were over-qualified for their job (the OECD average was 18.7%). This analysis also showed
that the over-qualification rate across New Zealand is 2000-2001 was 37.9 per cent,
revealing little change over the two time periods.
The OECD (2012) analysis also reported the rates of over-qualification of New Zealand
immigrants. Unlike for native-born New Zealanders, the rate for immigrants increased from
31.4 per cent in 2000-2001 to 37.2 per cent in 2009-2010. Interestingly, this increase
reflected a shift in the over-qualification rate for immigrants from below native-born New
Zealanders in the early 2000s to roughly equal in 2009-2010.
11
This section is excerpted from Allpress, J. A., 2013, Skills and the labour market in Auckland. Auckland
Council Technical Publication.
Ethnicity and Migration in Auckland 23Poot and Stillman (2010) provided some additional insight into the over-qualification rates of immigrants over time. They found, when using years of education (and therefore a slightly different methodology to the 2012 OECD analysis), that immigrants living in New Zealand for less than five years were more likely to be over-qualified (52% of recent immigrant males, and 51% of recent immigrant females were over-qualified) than individuals born in New Zealand (37% of males, 32% of females). Migrants who arrived more than five years prior, however, had only marginally higher rates of over-qualification (38% of males, 34% of females) than New Zealand-born individuals. A similar pattern was found when using the modal qualification of each occupation as a way of calculating over-qualification. There are a number of possible reasons for higher rates of over-qualification of immigrants in their first five years of living in New Zealand, including, but not limited to, English language difficulties, lack of knowledge of local culture and work systems, lack of recognition amongst employers of overseas qualifications, and employer prejudice. The findings of Poot and Stillman (2010) use the 1996, 2001 and 2006 census data and therefore do not necessarily represent current patterns of over-qualification. While these analyses were conducted at the New Zealand level, the findings have implications for Auckland. Auckland receives a significant percentage all long-term, permanent immigrants into New Zealand, and as a result immigrants play an important role in not only replacing migrant Aucklanders, but also increasing the overall skill base of the workforce. On average, international migrants into Auckland are more highly qualified than ongoing Auckland residents. The work of Poot and Stillman (2010) highlights a potential missed opportunity by showing that this qualification premium might, at least within the first five years of residency, be lost through underutilisation of immigrants’ full skill sets. This highlights the need for services that contribute to the quick and successful integration of immigrants, such as language training and employment matching services that are contextualised to the specific industries within which immigrants are seeking employment. These services are likely to have significant benefits to both the immigrants and to the wider economy, through more productive use of immigrants’ skills. 3.8 Educational qualifications12 To some extent, the labour force and occupational characteristics of ethnic groups as discussed above can be related to educational qualifications. In 2006, Māori (39%) and Pasifika (36%) had the highest proportion of those aged 15 years and over who had no qualification (note that many with ‘no qualification’ may have some secondary education, but did not complete a formal qualification). Those of Asian, Other, and European ethnicity had higher levels of Bachelors and post-graduate degrees than the Auckland population as whole. The educational qualifications of the different ethnic groups may in part reflect the emphasis that has been put on educational qualifications within the points system used to assess 12 This section includes excerpts from Allpress, J. A., 2013, Skills and the labour market in Auckland. Auckland Council Technical Publication. Ethnicity and Migration in Auckland 24
You can also read