Modal choice criteria in rail transport - Assessment of modal choice criteria in various rail transport market segments - CE Delft
←
→
Page content transcription
If your browser does not render page correctly, please read the page content below
3

    Modal choice
    criteria in rail
    transport
    Assessment of modal choice criteria
    in various rail transport market
    segments
Modal choice criteria in rail
    transport
    Assessment of modal choice criteria in various rail transport
    market segments

    This report was prepared by:
    Eelco den Boer
    Jacobine Aalberts
    Eric Tol
    Maarten ‘t Hoen
    Huib van Essen

    Delft, CE Delft, September 2018

    Publication code: 18.4S52.108

    Rail / Transport / Market / Passengers / Freight / Future

    Client: Community of European Railways

    Publications of CE Delft are available from www.cedelft.eu

    Further information on this study can be obtained from the contact person Eelco den Boer (CE Delft)

    © copyright, CE Delft, Delft

     CE Delft
     Committed to the Environment

     Through its independent research and consultancy work CE Delft is helping build a sustainable world. In the
     fields of energy, transport and resources our expertise is leading-edge. With our wealth of know-how on
     technologies, policies and economic issues we support government agencies, NGOs and industries in pursuit of
     structural change. For 40 years now, the skills and enthusiasm of CE Delft’s staff have been devoted to
     achieving this mission.

1   4.S52 - Modal choice criteria in rail transport - September 2018
Content
1   Introduction                                                           6
    1.1 Background                                                         6
    1.2 Project objective, scope and methodology                           6
    1.3 Outline                                                            7

2   Passenger transport                                                     8
    2.1 Market segmentation and market shares                               8
    2.2 Performance criteria                                               13
    2.3 Ranking of criteria                                                24
    2.4 Performance of rail passenger transport on the relevant criteria   24

3   Freight                                                                39
    3.1 Market segmentation and market shares                              39
    3.2 Performance criteria                                               43
    3.3 Ranking of criteria                                                49
    3.4 Performance of rail transport on the relevant criteria             50

4   Future trends                                                          54
    4.1 Rail passenger market                                              54
    4.2 Rail freight market                                                63
    4.3 Synthesis                                                          70

5   Conclusions                                                            73
    5.1 Passenger transport                                                73
    5.2 Rail freight                                                       74

6   References                                                             77

A   Modal choice criteria passenger rail transport                         86

B   Complete list rail freight criteria                                    88

C   Rail customer satisfaction figures                                     90

2   4.S52 - Modal choice criteria in rail transport - September 2018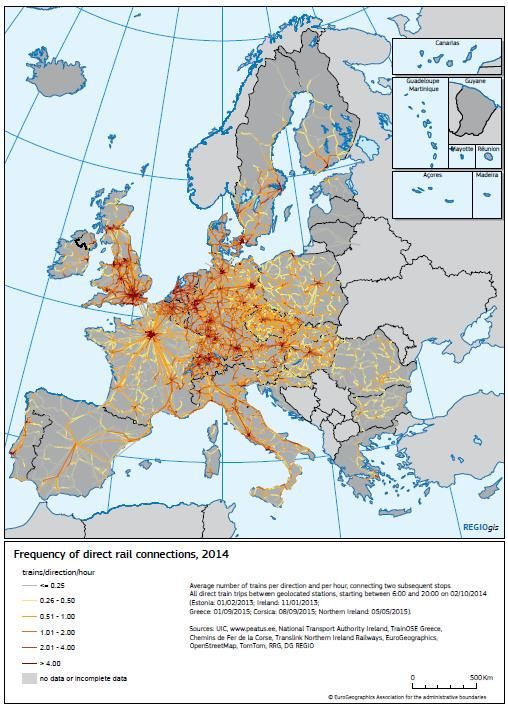
Summary
    Project objective: a better understanding of modal choice
    Increasing the market share of both rail freight and passenger transport can potentially
    contribute to improved accessibility, reduce road congestion and at the same time reduce
    the environmental burden and climate impacts of transport, if sustainable energy is used
    for propulsion. The modal choice of transport users both in passenger and freight depend on
    various criteria.

    The objective of this literature review is to get a better understanding of the criteria that
    transport users in different market segments in both passenger and freight transport use for
    choosing rail transport or a competing transport mode. In addition, future opportunities and
    challenges –endogenous and exogenous- for rail transport until 2030 have been identified.

    Passenger transport: potential for growth
    Door-to-door travel time, travel time reliability and comfort are in all market segments the
    most important criteria for modal choice, see Table 1. Commuters rank travel time and
    reliability highest. For commuters and leisure travellers, ticket prices are also important,
    while this is not the case for business travellers.

    Table 1 - Ranking of performance criteria for rail passenger transport for different trip purposes

     Criterion                      Commuting                          Business                     Leisure
     Travel time                        +++                              +++                          ++
     Reliability                        +++                              +++                          ++
     Comfort                             ++                              ++                           +++
     Accessibility                       ++                              ++                           ++
     Price                               ++                               +                         ++(+)*
     Frequency                           ++                              ++                            +
     Convenience                         +                                +                            +
     Safety                              +                                +                            +
     Environment                         +                                +                            +
    *For long distance transport, ticket prices are evaluated to be more important than on shorter distance transport.

    The evaluation of performance criteria shows that travel time and reliability of rail
    transport can be competitive for trip distances between 10 and 700 km. The travel speed of
    train is generally competitive compared to cars, but as travellers typically compare door-to-
    door travel time, the accessibility of the nearest railway station is crucial.
    Rail competitiveness increases if road travel time reliability gets poor due to congestion.
    Rail performance on travel time reliability is very high in almost all Member States. Rail is
    generally also cost competitive, compared to solo or duo occupant cars. However, for long
    distance trips, air transport is often much cheaper. The perceived quality of rail service (in
    terms of reliability, cleanliness, ticketing, client focus and other comfort factors) varies
    highly between member states, suggesting that improvement strategies focussing on
    comfort can be beneficial, but should be country or situation specific.

3   4.S52 - Modal choice criteria in rail transport - September 2018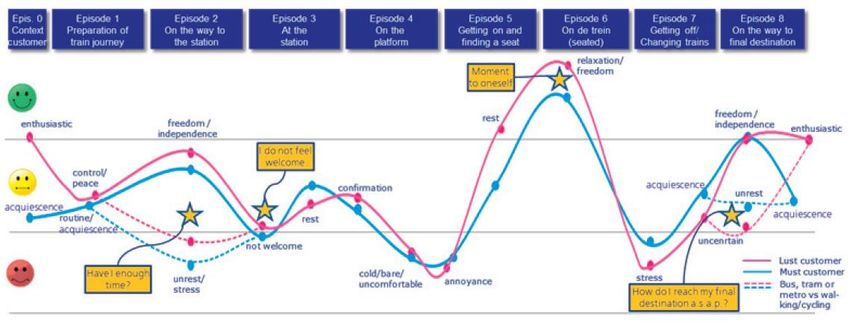
Urbanisation, mobility-as-a-service (MaaS) and the increased demand for leisure trips and
    environmental awareness are expected to have the greatest impact on rail passenger
    transport in Europe in the next decade. In many urban areas, car transport does not
    perform well, because of congestion and parking problems. Therefore, urbanisation is an
    opportunity for growth of rail transport. However, this requires a high level of integration
    with other modes, such as walking/cycling, bus/tram/metro and private car or new shared
    car service concepts. MaaS is expected to contribute to this by offering seamless switching
    between modes.

    Also the expected increase in the number of leisure trips (30% increase of intra-EU trips
    between 2010 and 2030) can be an opportunity for rail. However, as long as travel prices of
    international rail travel are not cost competitive with air, the potential for rail in
    international travel will depend on cost competitiveness. In addition, the requires an
    increase in the number of high speed rail connections.

    Finally, also the increase of environmental awareness will provide opportunities for the rail
    sector. Especially stricter environmental policies at the EU and national level are likely to
    discourage car use. At the same time, the expected electrification of automobiles may in
    the longer run diminish the relative environmental advantages of rail.

    Freight transport: challenges ahead
    The vast amount of literature available illustrates the major importance of costs as a modal
    choice criterion in freight transport on distances where rail becomes competitive. Only in
    cases of high value goods transport or conditioned goods, costs is not the single most
    important decision criterion. In those cases transport time and on-time reliability are also
    more important, see Table 2.

    Table 2 - Criteria importance ranking for maritime containers and continental freight

              Criteria                 Perishable goods/high value           Non-perishable goods/low value

     Costs                                          +++                                     ++++
     Delivery time                                 ++++                                     ++
     Punctuality                                   ++++                                     ++
     Flexibility                                     ++                                     ++
     Frequency                                       ++                                     ++
     Transport safety                                ++                                     ++
     Transport security                              ++                                     ++
     Convenience                                     ++                                      +
     Network connectivity                            ++                                      +
     Environmental efficiency                        +                                       +

    The continuous growth of import of maritime containers can to a large extent be explained
    by the focus on low-density-high-value goods, as Europeans consume more goods like
    electronics and conditioned goods. This implies that growth of rail transport is only possible
    when required service levels can be met, such as delivery time, punctuality and technical
    services as plug-in power and track and trace.

4   4.S52 - Modal choice criteria in rail transport - September 2018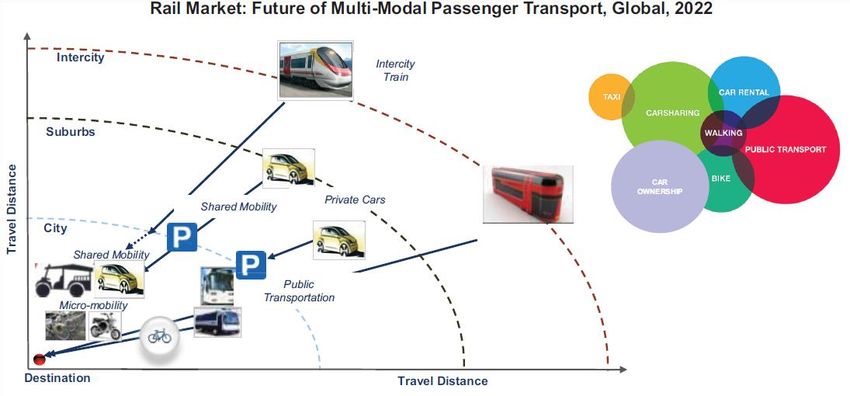
Various trends are likely to impact the rail freight market negatively in the next decade and
    need anticipation from the sector. The first one is the decrease in coal transport.
    Coal imported has increased since the 1980’s and accounts for 10% of rail freight transport
    in the EU. However, due to climate policies, the use of coal for power generation has
    started to shrink.

    The share of rail freight transport in Europe is also under pressure, due to the decline of
    single wagon load transport (SWL), which amounts to a third of the overall market in the
    EU. The decrease of the size of shipments and ‘just-in-time’ (JIT) logistics supply regimes
    requires flexibility and timely delivery. This is disadvantageous for rail transport, as road
    transport generally performs better on these criteria. This lag behind road transport can be
    explained by low speeds, caused by persistent interoperability problems, especially outside
    the European rail freight corridors. Solving of these bottlenecks is expected to last until
    2030. Reducing the border crossing difficulties and other interoperability problems would
    significantly improve the competitive position of rail.

    Opportunities for rail freight transport can be found in new and upcoming markets.
    Maritime containers will continue to grow, although to a lesser extent than in previous
    decades and the opening of the New Silk route provides opportunities for European rail
    freight market. Trailer-on-train is a concept that may require more attention as a result of
    a stronger demand for climate neutral transport in the next Post Paris decade and
    increasing shortage of truck drivers and increasing road congestion. Like for passenger
    transport, also the environmental awareness and need for climate neutral transport is an
    opportunity for rail, although variations in the extent of network electrification are
    considerable between countries.

5   4.S52 - Modal choice criteria in rail transport - September 2018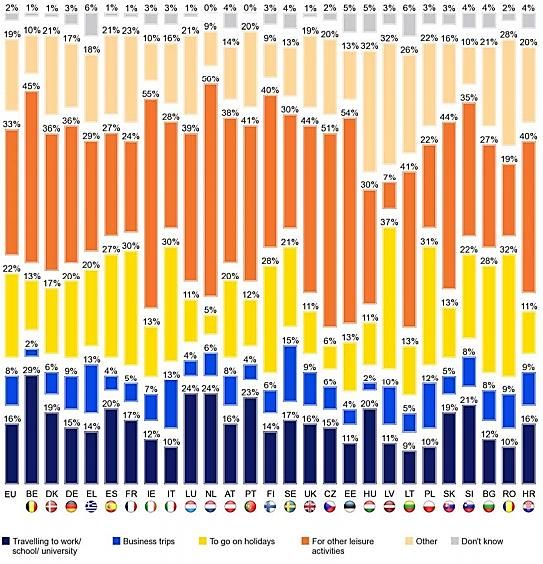
1 Introduction
1.1   Background
      Increasing the market share of rail transport can potentially contribute to improved
      accessibility, reduce road congestion and at the same time reduce the environmental
      burden and climate impacts of transport. The modal choice of transport users both in
      passenger and freight depend on various criteria. Better insight in these criteria can help
      policy makers to develop effective policies.

      In view of this CER (Community of European Railways) has commissioned CE Delft to carry
      out a desk study on the criteria that transport users use for their modal choice.
      The results of this study should help CER to define its priorities for the next legislative
      period and will show the areas where a ‘gap’ between rail and other modes needs to be
      filled, or where rail already outperforms and probably can benefit from better positioning.
      This report deals with both the current and future modal choice criteria for identified
      market segments.

1.2   Project objective, scope and methodology
      The objective of this literature review is to get a better understanding of the criteria that
      transport users in different market segments of both passenger and freight transport use for
      choosing rail transport or a competing transport mode. The review also takes account of
      future trends that may impact the position of rail transport.

      More specifically the objectives of this study are to:
      1. Map the different market segments where rail is present (e.g. passenger vs. freight,
          business travellers vs leisure travellers, heavy goods vs light goods, short distance
          travel vs. long distance travel, etc.).
      2. Identify the criteria that in each market segment ultimately ‘drive customers’ modal
          choices.
      3. Map the comparative performance of rail in different relevant market segments.
      4. Identify relevant trends and how they may affect the modal choice and pose
          opportunities or threats for the rail sector.

      The time window that is considered in the study is the 2019-2024 period and the decade
      after that regarding the future trends impacting rail transport and its customers.
      The project concerns a gathering of relevant available business and academic literature,
      under review of a group of CER members. This report does not provide a full picture of the
      potential of rail, as it does e.g. not focus on existing supply side bottlenecks in the rail
      market itself that hinder growth.

6     4.S52 - Modal choice criteria in rail transport - September 2018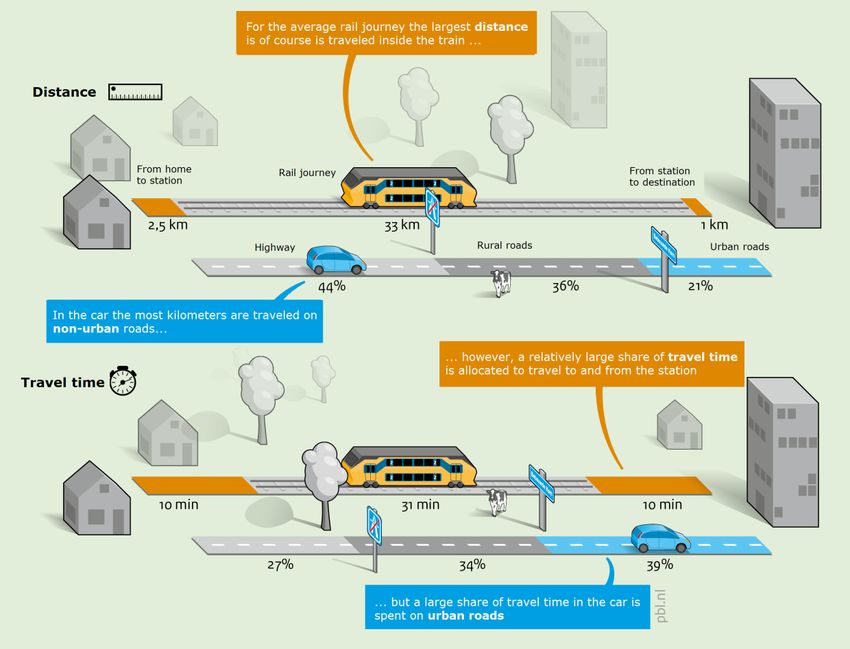
1.3   Outline
      First, a chapter is dedicated to passenger transport (Chapter 2) and one to freight transport
      (Chapter 3). In each of these chapters, the relevant market segments and its relevance,
      the performance criteria in the various transport market segments are listed and ranked,
      followed by an assessment of the performance of rail versus other modes for the most
      important criteria. Chapter 4 provides an analysis of the market developments and
      exogenous trends that are relevant for rail transport and how they may affect future modal
      choice.

7     4.S52 - Modal choice criteria in rail transport - September 2018
2 Passenger transport
      In this chapter, the relevant performance criteria for passenger rail transport are discussed.
      First, the relevant market segments are identified. Next, based on literature review the
      performance criteria relevant for modal choice are described, resulting in a ranking of the
      most relevant criteria for market segments and passenger groups that can be identified.
      Finally the performance of rail transport is discussed for the main criteria.

      The focus is on heavy rail transport. However, many studies on modal choice criteria take a
      broader perspective, e.g. considering also light rail (tram, metro) or even all public
      transport.

2.1   Market segmentation and market shares

      Market segmentation
      The share or rail in the modal split of passenger transport and potential for growth depends
      on various parameters. Also the criteria used for making the modal choice is not the same
      for all travellers. In this section the main market segments are described that are relevant
      to distinguish, when assessing the criteria used for the modal choice.

      Based on the review of the literature and the discussion with the steering committee of this
      study, a basic market segmentation has been developed, which is depicted in Table 3.
      The purpose of transport (demand side) has been chosen as the first discerning parameter,
      since this is an important factor for the criteria of transport users when making a modal
      choice. For example: travel time is one of the most important criteria for business travel,
      but less important for leisure trips, which is reflected by the much higher valuation of
      travel times for business, compared to leisure (Kouwenhoven, et al., 2015).

      The second parameter concerns the segmentation to regional, national and international
      trips, which is mainly linked to the length of the trip. The availability and competitiveness
      of rail transport is generally highest for medium distances, and lower for very short
      distances (less than 10 km) or very long distances (more than 700 km). Therefore the
      potential of rail transport in regional and international travel is most significant in the sub-
      segments of relatively short international and long regional trips, while for most national
      trips rail is a suitable option, at least for locations that are sufficiently close to a (main)
      railway station or well accessible by multimodal connections.

      In Table 3, the main competitors for rail transport and the most relevant sub-segments of
      rail transport are described for each market segment. For example, in the market segment
      international business transport, air travel is the main competitor of rail transport. In this
      market segment High Speed Rail (HSR) is able to compete with air travel. The same holds
      for international leisure trips. However, also car and coach are competitors for train travel
      in that market segment. Trips to cities well accessible by high speed rail seems to be the
      most relevant sub segment for international leisure travel by rail.

8     4.S52 - Modal choice criteria in rail transport - September 2018
Table 3 - Segments in passenger transport market and relevance of rail per segment

     Distance            Commuters                       Business                        Leisure
     International       Hardly existing                 Competitors: air                Competitors: air, coach, car
     (200+ km)
                                                         Relevance rail transport:       Relevance rail transport:
                                                         Relatively short distances      Relatively short distances
                                                         (
Figure 1 - Market share of rail in land-based passenger transport in EU-28 and European countries (2016)
Share of rail in passenger transport (pkm, excl. air
and sea)
18%
16%
14%
12%
10%
8%
6%
4%
2%
0%
Source: Pocketbook DG MOVE
Of all European countries, Switzerland has the highest share of rail in passenger transport,
with 17% of the total passenger-kilometres of land-based transport modes in 2016.
Particularly in urban areas, rail has a relatively high market share. This comes together with
lower car ownership : 73% of the urban households own a car, against 87% in areas outside
the influence of urban centres. The share of rail transport in Swiss agglomerations varies
from 9% (Lugano) to 30% (Bern).
Figure 2 shows a comparison of average rail travel in 2014 for inhabitants of all EU Member
States and also the annual change in the period 2009-2014 (EC, 2016a).
Figure 2 - Propensity to travel by rail (2014) and its average annual change since 2009. (p-km per year per
inhabitant)
10 4.S52 - Modal choice criteria in rail transport - September 2018Size of market segments
Most of the trips by rail are domestic travel, less than 6% of pkm concerns international
trips (EC, 2016a). As international trips will on average be longer than domestic ones, the
international share in the number of rail trips is even much lower.
HSR plays an important role in the rail market for trips >100km. High speed lines make up
part of the rail networks of Belgium, Germany, Spain, France, Italy, the United Kingdom,
the Netherlands, Austria and Poland. Ca. 26%-30% of all p-km are run on high speed lines,
see Figure 3. In France this share is ca. 50% (EC, 2016a) (IEA ; UIC, 2017).
Figure 3 - Passenger railway activity and High-Speed activity as a share of total passenger railway activity (%)
Data on the shares of different travel purposes
There is very little data available for travel purposes for rail transport for all EU countries.
In the EU Rail Customer Satisfaction Barometer (TNS Political & Social , 2013) the most
frequent purpose of train trips is presented per country, however the results present a
relatively high share of leisure trips compared to the national data statistics from the
Netherlands and the UK. Figure 4 shows the shares of different purposes in rail travel in the
EU (first bar) and the shares for each EU Member State according to the Eurobarometer.
The graphs show that leisure and holidays together are responsible for 55% of EU rail travel,
according to the Eurobarometer.
11 4.S52 - Modal choice criteria in rail transport - September 2018Figure 4 - Most frequent purpose of train trips, per country in the (TNS Political & Social , 2013)
In the UK, over half of all rail journeys were for commuting and education (56%), with
smaller shares for leisure (23%), business (10%) and other (10%) according to the UK
Department for Transport (DfT , 2017). Data from the national statistical agency in the
Netherlands suggest that in that country, commuter transport is by far the largest category
of regional and national rail transport: 65% of all regional and national train trips are made
with the purpose of commuting (36%) or education (29%). Leisure takes only 32% of all trips
and business trips are 4% of all train travel trips (CBS Statline). Data from Dutch Railways NS
show that for distances below 10 km, trains have no significant market share.
UITP (2016) reports the distribution of rail trips over regional/suburban and long-distance
trains, using a specific definition for regional and suburban railways (RSR): average distance
between stationsFigure 5 - Regional and long distance passenger kilometres on railways (UITP, 2016)
2.2 Performance criteria
2.2.1 Modal choice criteria rail travel
The literature review revealed that the criteria listed in Table 4 are the most important
ones for modal choice in passenger transport. All criteria found in the reviewed literature
are listed in Appendix A. For example, Redman et al., (2013) performed a broad research
review into the quality attributes of public transport that attract car users.
Table 4 - Attributes that are important for modal choice according to Redman et al., (2013)
Classification Attribute Definition
Physical Travel time The time spent for the entire door-to-door travel
Reliability How closely the actual service matches the route timetable
Accessibility The degree to which public transport is reasonably available to as
many people as possible
Frequency How often the service operates during a given period
Price The monetary cost of travel
Information provision How much information is provided about routes and interchanges
Ease of How simple transport connections are, including time spent waiting
transfers/interchanges
Vehicle condition The physical and mechanical condition of vehicles, including
frequency of breakdowns
Perceived Comfort How comfortable the journey is regarding access to seat, noise
levels, driver handling, air conditioning
Safety How safe from traffic accidents passengers feel during the journey
as well as personal safety
Convenience How simple the transport service is to use and how well it adds to
one’s ease of mobility
Aesthetics Appeal of vehicles, stations and waiting areas to users’ senses
13 4.S52 - Modal choice criteria in rail transport - September 2018Annex A provides an overview of the criteria mentioned in the studies assessed. From this
overview we conclude that the main attributes that they found are travel time, reliability,
accessibility, frequency, price and comfort & quality. Below, each of these criteria is
discussed, based on findings in literature.
Travel time
The market share of public transport is highly influenced by travel time of public transport
vs. alternative modes. For example, Figure 6 shows the travel time ratio of public transport
vs. car in Berlin (Rheinhold, 2008). When travel time by public transport is more than two
times higher than travel time by car, the market share of public transport drops below 30%.
But when travel time by public transport is less than 1.5 times higher than by car, the
market share of public transport can grow to over 60%. Also Dutch literature states that
travelling by train is competing car when the door-to-door travel time by train is no more
than 1.5 as long as the travel time by car (KiM, 2015).
Reducing travel time for train trips can play an important role by increasing rail transport.
For example, in the Netherlands rail transport has grown with 25% in the 2005-2016 periods.
10% of the growth can be explained by travel time related factors like travel time reduction
(of transport to and from the station), reduction of waiting times and transfer optimisations
(KiM, 2018c).
Figure 6 - Travel time ratio for public transport in Berlin (Rheinhold, 2008)
Also for long distance travel, where rail competes with air, travel time is an important
criterion. Several sources (UIC, 2018, KiM, 2018a) indicate a strong relationship between
rail travel time and market share for long distances related to air travel. Rail can be
competitive with air travel when the rail travel time is less than 3h30 minutes (market
share > 60%). In fact, rail dominates the market (related to air travel market share > 90%),
where rail travel time is less than two hours. For example, the Paris-Brussels route is
dominated by rail travel. Where rail travel time is more than five hours, rail becomes a
marginal actor compared to air (market share < 20%).
14 4.S52 - Modal choice criteria in rail transport - September 2018Figure 7 shows the rail market share vs. air market share for long distance-trips in France
(UIC, 2018). Figure 8 shows the market share of HSR connections on several city-pairs in
Europe and Japan.
Figure 7 - Rail market share (passengers) on the rail+market in France (UIC, 2018)
Figure 8 - Market share passenger travelling for HSR-connections between cities, related to train travel time.
HSR market share in %
Travel time in hours
15 4.S52 - Modal choice criteria in rail transport - September 2018Besides the travel times by train itself, also the travel time to and from the railways station
and the transfers, waiting time and delays influence the objective travel time.
It is important to emphasize that for the modal choice, it is not just the real travel time the
matters, but in particular the perceived travel time (see below).
Reliability
Reliability of travel times is an important factor determining travellers’ modal choice.
Unexpected delays in public transport and (unpredictable) road congestion are the most
important causes of unreliable travel times. High-frequency rail connections improve the
travel time reliability because missing a connection does not directly result in large delays.
For example, travel cost calculations for transit users on two RER-lines in Paris show that
for low-frequent lines frequency improvement has more value to the traveller than
reliability improvement (Benezech & Coulombel , 2014).
Accessibility
The existing rail network and the supplied service (connections, frequencies) determine on
which relations the train can be attractive. The transport to and from railway stations plays
a very important role in the door-to-door travel time of train journeys.
Rail transport can compete well with car trips when the destination can easily be reached
from the nearest railway station. For example, for jobs that are within less than 500 metre
of main train stations, the share of rail in commuting is significantly higher than for jobs
that are located further from railway stations (KiM, 2015).
Also when the destination location is better accessible by train than by car, rail can be the
most competitive way of travelling. Mainly in larger cities this is the case when there are
significant parking or congestion problems around the destination location. High parking
fees, long searching time for parking and extreme congestion are main factors for choosing
train instead of car (KiM, 2015).
Frequency
In quality research of public transport, the frequency of service is highlighted as a
significant factor determining perceived service quality (Redman, et al., 2013). If a
traveller arrives at a random time at their station of departure, the service frequency
determines the distribution of waiting times for the first train departure. For high
frequency trains, this reduces the need for strict journey planning by travellers, but also
the consequence of delays in transport to the station. According to Brons & Rietveld (2009),
in some respects, increasing the service frequency is better than reducing the travel time to
the station. If the route of the feeder bus to the railway station is shorter, it will reduce
the catchment area of the service and possibly the number of rail users. Secondly,
increasing the frequency of service will also reduce travel time when including waiting time
to the service.
16 4.S52 - Modal choice criteria in rail transport - September 2018Price
Price is also an important criterion for modal choice. A commonly used measure for
expressing the price sensitivity of transport is the price elasticity. A meta-study by Litman
(2017) mentions various studies that provide price sensitivity for rail passenger transport.
Mayeres (2000) reports price elasticities for rail passenger transport of -0.37 in peak and -
0.43 in off-peak hours. This means that a 10% price increase for rail transport in peak hour
results in 3.7 less passenger kilometres by rail. So, this study indicates greater price
sensitivity for off-peak travel compared with peak travel. For the market segments
distinguished in Section 2.1, it means that commuting and business travel is less price
sensitive than leisure travel.
Another meta-analysis by PBL and CE Delft (2010), concludes that rail passenger transport is
somewhat more price sensitive. The short term price elasticity of rail transport is in the
range of -0.3 to -0.7 while the long term elasticity is in the range of -0.6 to -1.1.
All the studies mentioned by Redman et al., (2013) stress that the impact afforded by
pricing mechanisms is determined to a great degree by other attributes of public transport
service quality such as access, frequency, and speed.
Comfort, convenience and safety
A lot of aspects can influence the quality and comfort the passengers’ travel experience.
For instance, vehicle condition (e.g. cleanness, silence compartments in the train) and
facilities as WiFi or catering can contribute to a pleasant and useful travel time. Also
comfort at stations and stops, such as indoor waiting rooms or shops at stations could be
useful for the traveller. Other comfort and quality aspects are: travel information (also in
case of delays), alternative transport during interruptions, user friendly booking systems
and service of personnel.
Also the ease of transfers/interchanges is important. Transfers, waiting time and delays not
only influence the objective travel time, but also the perceived travel time of the traveller.
For example, waiting time can be experienced twice as long as the objective waiting time,
delayed time as three to five times longer (Warffemius et al., 2016, Page 6; KiM, 2015).
A literature review (overview by Wardman, 2014) showed the importance of convenience in
public transport. In this research inconvenience variables are valued as multipliers to in-
vehicle-time (IVT). The paper shows that most important factors for inconvenience, such as
delay, can lead to multipliers to IVT up to five. Figure 9 shows the multipliers for the most
important convenience variables.
17 4.S52 - Modal choice criteria in rail transport - September 2018Figure 9 - Time multipliers for most important convenience issues in public transport (Wardman, 2014)
Also the comfort and service level of the transport to and from railway stations have an
effect on the traveller’s experience. Furthermore, the real and perceived safety during the
entire journey travel are also important for travellers.
Attitude, personal characteristics & environmental awareness
Besides the criteria mentioned above, some literature also mentions the attitude and
characteristics of traveller as important parameters.
In all market segments, based on objective, measurable criteria, such as price and travel
time, there is more potential for passenger rail than is really used. Subjective criteria, as
personal attitude against rail transport, sometimes dominate the travellers’ modal choice.
However, travel attitudes and behaviours are not necessarily constant over time. In fact,
they mutually influence each (Kroesen, et al., 2017). Travel behaviour changes at life
events, such as job change or rehousing (De Haas, 2016).
Personal characteristics also influence peoples’ travel behaviour and modal choice.
In general, car ownership and higher income decrease the use of public transport and
younger people and students use public transport more often than older people
(Santos, et al., 2013). Appraisal of some choice criteria depends on the frequency of
travelling by train. NS found three decisive criteria where people that are classified as ‘car
if possible’ travellers and ‘train if possible’ travellers show a significant difference in their
modal choice. People in the group ‘train if possible’ value ‘environment’, ‘useful travel
time’ and ‘pleasant travel time’ more than people in the group ‘car if possible’. The
importance of useful and pleasant travel time is confirmed by the KiM research (KiM, 2015).
Impact of policies
Corporate as well as governmental policies influence indirectly or directly peoples’ modal
choice. For example, taxation and reimbursement policies influences prices for train tickets
and other modes. Also company policies can directly influence the modal choice for
business travelling and commuting. When a company decides to book train tickets for
specific business trips or provide train cards, employees will be motivated to travel by train
more often. Especially for commuting and business, travel policies of employers play an
important role in the modal choice.
18 4.S52 - Modal choice criteria in rail transport - September 20182.2.2 Criteria assessment
In this section, the results of the literature review are provided on the various criteria
identified in the previous section and on their relative importance.
Literature review
German research (Rheinhold, 2008) among travellers in Berlin shows travel time
(determined by velocity, frequency, accessibility of stops and reliability) as main factor for
modal choice, see Figure 10.
Figure 10 - Factors determining purchase decision (%) (Rheinhold, 2008)
Dell’Olio et al., (2011) studied the quality desired by users and potential users of public
transport when defining an efficient and reliable system, taking the municipal bus services
of Santander (Spain) as a practical example. The users of public transport valued waiting
time, cleanliness and comfort the most, but the degree to which they are valued varied
according to the type of user. For potential users the most important variables are waiting
time, journey time and above all, level of occupancy (comfort). They considered the other
variables of little importance.
Dell’Olio et al., (2012) analysed users’ preferences concerning the choice between the car
and light rail or bus along a congested urban corridor. According to their stated choice
experiment, important attributes are trip frequency, fares and parking costs. They show
that the potential demand for light rail is higher than for the bus service, but it must
guarantee a regular and frequent service, at the same time as charging competitive fares.
Moreover, they conclude that it is necessary to act on parking tariffs, introduce higher fuel
taxes and a congestion charge.
Chakrabarti (2017) finds that few car owners use transit, and that lack of access to the
household vehicle(s) explain choice of transit to a large extent. For the car owners that
sometimes use transit, important attributes are: fast (relative to car), frequent and reliable
transit service along with fewer transfer requirements. Home and workplace neighborhood
density, proximity to transit stop, and availability of rail are other critical facilitators.
Guirao et al., (2016) studies the importance of service quality attributes in public
transportation. They conclude that journey time, cleanliness, the possibility of sitting
19 4.S52 - Modal choice criteria in rail transport - September 2018during the journey are important public transport attributes based on a case study in
Madrid.
For choosing train versus car problems with car accessibility of the travel destination (high
parking fees, high parking searching time, extreme congestion) are the most important
factors that determine travellers’ choice. Other motivational aspects for choosing the train
above the car are usefulness of travel time and avoiding traffic stress factors (KiM, 2015).
In older literature (Bellinger, 1970) passengers mentioned travel time (25.3 %), punctuality
(17.9%) and price (10.3 %) as the most important factors for their modal choice, over
service and comfort (8.4%), tariff system (5.9%), frequency (5.7%) and number of stops
(5.5%).
Customer surveys
A recent UIC questionnaire among 6,000 persons from France, UK and Spain (UIC, 2018)
states price as most important factor for modal choice: 80% of the respondents selected
price as a relevant modal choice criterion (respondents were asked to select five criteria at
the most among 14). Time factors were mentioned as second most, for example travel time
(69%), timetable (33%, as a marker for frequency and waiting time) and reliability (31%).
Environmental impact (5%) and on-board services (8% )were mentioned least.
Figure 11 - Ranking of criteria in UIC questionnaire (UIC, 2018)
A multivariate analysis of a national passenger survey in the UK (Greeno & Hunt, 2013)
shows that punctuality (42%), cleanliness inside train (16%) are the most important factors
correlating with overall satisfaction. The way train companies deal with delays (51%) is
mentioned as the most dissatisfying factor for satisfaction with the rail journey. Travel time
(7%), frequency of service (5%) and value for money (2%) are also satisfying factors, but less
important for total satisfaction with the journey. Although this analysis doesn’t determine
20 4.S52 - Modal choice criteria in rail transport - September 2018which factors are determinant for modal choice, this survey shows that reliability of time is
a very important factor for customers’ appraisal of rail trips.
NS customer surveys show time reliability and comfort are most important factors. Top five
main factors are reliability (90-95%), ease (85-90%), safety (80-85%), price (55-75%) and
speed (60-80%) (% importance) (Brons & Rietveld, 2009).
Stress as a factor
Legrain et al., (2015) assessed the stress of commuting, which is caused by an interaction
between objective stressors and mediators (time, control, and comfort) and subjective
stressors which act as mediators (feelings, desires, and satisfaction). Their results show that
driving is the most stressful mode of transportation when compared to others. Stressors are
mode dependent. For the car, an important stressor is congestion. Public transit users get
stressed dependent on the mode used to get to the station, satisfaction with the time to
reach the station (for train riders), and waiting time at the station, and unpredictability. It
seems that having ‘a plan B’ for their commute lessens the stress of their trip. Importantly,
stress can be reduced by increasing reliability, but also by information provision regarding
delays.
The pyramid of customer needs
Van Hagen & Bron (2014) argues that in order to achieve a true breakthrough in customer
satisfaction, railways need to focus more the emotional experience of the customer. He
distinguishes between satisfiers (experience, comfort) and dis-satisfiers (safety, reliability,
speed, ease) and explains that only satisfiers can truly raise the level of customer
satisfaction to a high level. Often, rail operators focus mostly on achieving operational
excellence (which is closely monitored by conducting regular customer satisfaction surveys)
which leads to raising dis-satisfiers to an acceptable level. Van Hagen & Bron (2014)
proposes the ‘Pyramid of Customer needs’, pointing out the difference between satisfiers
and dis-satisfiers.
21 4.S52 - Modal choice criteria in rail transport - September 2018Figure 12 - Pyramid of customer needs
The base of the pyramid is formed by the basic needs reliability and safety (primarily social
safety). Reliability indicates the degree to which passengers experience receiving what they
expect. If the service is not available when and where customers expect it, it will result in
their being dissatisfied. This means that trains must not only run on time but also that
passengers should receive information when they need it and that it is trustworthy. Speed is
the principal customer need, i.e. the majority of customers choose as short a travel time
between origin and destination as possible. Additionally, the passenger wants the trip to be
easy, i.e. convenient and with little hassle. Travel information and signposting are a help
and must be seen as logical and unambiguous (Van Hagen & Bron, 2014). Satisfiers are
comfort (sheltered waiting, sitting areas, comfortable seats, opportunity for other activities
on the train) and experience. The experience is enhanced by architecture, design,
cleanliness, used materials and colour, but also (day)light, smell and music can influence
the quality of experience.
2.2.3 Differences between market segments and user groups
The importance of the various criteria is likely to differ per market segment. However, the
amount of literature found on differences between market segments is limited. Below the
main findings are listed.
Wardman (2013) showed that walk and wait multipliers (like mentioned in Figure 9) depends
on trip purpose and trip length. Walk and waiting time has slightly more weight in shorter
trips and in trips made for leisure, see Figure 13.
22 4.S52 - Modal choice criteria in rail transport - September 2018Figure 13 - Walk and wait multipliers for various trip lengths and trip purposes (revealed preference,
Wardman, 2013)
Also the value of travel time depends on the travel purpose. As can be expected, the value
of time is much higher for business trips than for commuting or leisure (Kouwenhoven, et
al., 2015). For a business traveller, the average value of time in the Netherlands is € 19.75
per hour, for commuting € 11.50 and for other travel purposes € 7.00. Although the values
for other countries will be different, the ratios between different travel purposes are likely
to be similar.
Long distance trips – rail vs. air travel
Specifically for people’s modal choice between train and air travel (so for long distance
journeys), KiM (2018a) found the following ranking of criteria:
— travel time;
— number of travel opportunities per day;
— price;
— comfort (reservation system, travel information before and during travelling, luggage
handling, comfort at stations/airports, comfort in train/air plane).
Important performance criteria for different user groups
Abenoza et al., (2017) point out that traveller’s behaviour, experience and satisfaction
depend on individual attributes, contextual variables and attitudes. They show an overview
of attributes that determine travel satisfaction among different user groups:
— Workers: Service attributes such as punctuality, frequency, bus driving security and
information service are most important (Guirao, et al., 2016).
— Students: Ease of ticket purchase, on-board security and reliability ( (Eboli & Mazzulla,
2009).
— Riders over 65: Comfort (Dell'Olio, et al., 2011).
— Women: Sense of security (Yavuz and Welch, 2010) and cleanliness (Dell'Olio, et al.,
2011).
— Leisure travellers in Manchester: Ease is preferred over efficiency measures (Thompson
& Schofield, 2007).
— Commuters in Dublin: Reliability of service, waiting times and comfort (Cantwell, et
al., 2009).
— Non frequent PT users: Comfort (Dell'Olio, et al., 2011).
23 4.S52 - Modal choice criteria in rail transport - September 20182.3 Ranking of criteria
The importance of the different criteria identified in the previous section differs per user
and can also vary with trip purpose, length, time and frequency. Table 5 provides an
overview of the main criteria and the importance for commuting, business and leisure
travellers. The reviewed literature revealed that in general travel time, comfort and travel
time reliability are the most important criteria for modal choice, followed by price and
frequency. Annex A provides a complete overview of the most important criteria found in
the literature.
The literature review revealed some specific assessments of importance of performance
criteria for specific user groups, mainly on commuters and leisure. For business trips little
literature was available. Based on the literature review and our expertise, we ranked the
performance criteria from 1 to 3 +’s. For business, price is less important due to high value
of times, while reliability and travel time are ranked highest. Accessibility did not appear
frequently in the literature review, but is crucial for door-to-door travel time.
Table 5 - Main criteria influencing modal choice passenger rail transport
Criteria Commuting Business Leisure
Travel time +++ +++ ++
Reliability +++ +++ ++
Comfort ++ ++ +++
Accessibility ++ ++ ++
Price ++ + ++(+)
Frequency ++ ++ +
Convenience + + +
Safety + + +
Environment + + +
*For long distance transport, ticket prices are evaluated to be more important than on shorter distance transport.
2.4 Performance of rail passenger transport on the relevant criteria
As we have seen, the most important performance criteria for modal choice of rail are
travel time, reliability, accessibility, frequency, price and comfort. Below we discuss the
performance of rail for these criteria and also environment (which as we will see can be of
importance regarding future trends, see Paragraph 4.1.1) and in most cases the
performance compared to competing modes on the criteria identified in the previous
section. As accessibility is closely related to travel times, it is not assessed separately.
Travel time
The travel time is determined by vehicle speed, service frequency, and transfers/waiting
time. (Steer Davies Gleave, 2016) compares average speeds for European countries between
the train and the car. The comparison shows that across all market segments (regional,
interurban, international), the travel speed of the train is higher than for cars.
This corresponds to almost all journeys under and over 300 km, as shown in Figure 14 and
Figure 15. Especially for journeys over 300 km, the average speed of the train is higher.
24 4.S52 - Modal choice criteria in rail transport - September 2018Figure 14 - Rail and car average speeds in European countries. Inter-urban trips under 300 km (Steer Davies
Gleave, 2016)
Figure 15 - Rail and car average speeds: Interurban trips over 300 km (Steer Davies Gleave, 2016)
As mentioned in Paragraph 2.2.1, However, it is important to note that not only the speed
of the train itself matters. The travel time of public transport is highly dependent on de
means of getting to the station and from the station to the destination, as illustrated by
25 4.S52 - Modal choice criteria in rail transport - September 2018Figure 16. Although most of the kilometres in a rail journey are travelled inside the train,
a large share of the travel time is spent waiting and travelling to and from the station.
Figure 16 - Illustration of differences between travel distance and travel time by train and car (PBL, 2015)
Due to travel from door-to-train and train-to-door, the total travel time for the train is in
most cases considerably higher than for car travel. As shown in Figure 17, the public
transport alternative for most of the car trips in the Netherlands is much slower (often
travel time is more than twice as high), especially on short distances. In order to be more
competitive, the travel time for the door-to-door rail travel needs to be decreased.
26 4.S52 - Modal choice criteria in rail transport - September 2018Figure 17 – Number of car trips in peak hours (million per working day) sorted by travel time ratio public
transport/car and trip distance (KiM, 2015)
Air travel
Where for relatively short trips the service frequency and door-to-door transport is the
dominating factor for travel time, for longer (international) trips the vehicle velocity is
more important (KiM, 2018b). In some cases High Speed Trains have a shorter city-to-city
travel time than air travel. For example, from Brussels, Paris, London and Frankfurt
(amongst others) the high speed train is faster. But in most cases, even for distances below
700 km, door-to-door travel time of direct flights between cities is shorter than for rail
transport.
As an example of time and cost comparison, Figure 18 shows the travel time ratios and cost
ratios for rail and air transport from and to Amsterdam1 (figure CE Delft, based on KiM
2018a). From this analysis it can be concluded that it is very dependent on the connection
whether or not rail is cheaper and/or faster. In many cases air transport is cheaper and
faster.
________________________________
1
Amsterdam Airport to/from the cities: London, Berlin, Copenhagen, Paris, Birmingham, Basel, Bristol, Frankfurt,
Hamburg, Munchen, Hannover, Brussels, Dusseldorf.
27 4.S52 - Modal choice criteria in rail transport - September 2018Figure 18 - Ratios for travel time and travel costs between air and rail travel to and from Amsterdam
Improving the HSR network with extra connections can give a reduced travel time by train.
For example, travel times to 25 European cities from Amsterdam could become shorter than
travel times by air travel2, where in the current situation this only applies for Paris, Brussel,
Frankfurt and Dusseldorf. For such a HSR network not only new infrastructure is needed,
but also improving travel comfort and (international) planning (Haskoning, 2018). Similar
potential is available for many other large EU cities.
Price
The price of a rail ticket depends on several factors such as subscription structures and in
case of a group (or family), the number of travellers. Also prices of other modes depend on
many factors, such as taxes, price of car ownership etc. For example, in the Netherlands
65% of train trips are made with some form of subscription (27% student card, NS). In this
paragraph, a cost comparison is made between rail and car travel.
Steer Davies Gleave (2016) gathered data on average car and rail ticket costs and travel
times for regional trips, interurban trips (under and over 300 km) and international trips.
Figure 19 and Figure 20 show this comparison for interurban trips. The car costs shown in
these graph, are much lower than the cost usually reported. Car owner organisations like
ADAC report car cost of around 40 euroct/km (e.g. for Volkswagen Golf). The main reasons
for the very low costs used by Steer Davies Gleeve is that just the marginal cost are shown
(i.e. the additional cost of an additional kilometre).
________________________________
2
Based on 3.310 km new infrastructure, maximum vehicle velocity 300-350 km/hour and train stops at 200 à 300
km.
28 4.S52 - Modal choice criteria in rail transport - September 2018Figure 19 - Rail and car costs: Interurban trips under 300 km (Steer Davies Gleave, 2016)
Similar cases are also found in longer distance interurban market (over 300 km) and the
international market, where car journeys are all less expensive than rail.
Figure 20 - Rail and car costs: Interurban trips over 300 km (Steer Davies Gleave, 2016)
29 4.S52 - Modal choice criteria in rail transport - September 2018For most regional and interurban trips under 300 km, rail journeys appear to be more
expensive, on a fare per kilometre, than the equivalent journey costs by car.
Several contextual factors have to be taken into account by Steer Davies Gleave, 2016.
The car journeys are solo occupant, which has an effect if more people use the same
vehicle. With two persons using the same car, the journey price would become half.
The same case with a train journey will not yield the same effect and train travel costs may
remain the same.
Another key issue to note is the oil price, which was at the time of the study (Steer Davies
Gleave, 2016) at a historical low level. A sensitivity test conducted by the study, up to 30%
higher oil prices, did increase car travel costs, but did not change the overall conclusions.
In most cases, car trips are less expensive than train travel, although in the regional cases
the difference became relatively small. A final contextual factor is depreciation, which is
not taken into consideration by Steer Davies Gleave. 37% of car travel costs is due to
depreciation, see also Figure 21. New vehicles will have higher depreciation than older
(second hand) vehicles. In that case, car costs will be lower, although (greater) repairs to
older cars may come more frequently.
Figure 21 - Relative costs for car usage for EU member states (for all vehicles using diesel and petrol) (source:
LeasePlan, 2017)
Also, vehicle costs differs greatly in Europe (see Figure 22). For instance, Norway, Italy and
the Netherlands have high vehicle costs per month, while eastern European countries are on
the other scale of the spectrum.
30 4.S52 - Modal choice criteria in rail transport - September 2018Figure 22 - Total car costs per month, for mid-class (B- and C-segment, Benzine (Petrol) and Diesel) cars
driving 20,000 km’s per year, in 24 EU countries (LeasePlan, 2017)Diesel vehicles are almost not used in
Russia.
Ticket prices for trains and operational costs for cars are a skewed comparison. Since fuel
and repairs and maintenance count for 25% of total car costs, the total costs per kilometre
would be a factor four higher if fixed costs are included as is shown in Figure 23.
Figure 23 - Average rail fares (Steer Davies Gleave, 2016) compared to car costs per kilometre for 1, 2, 3 or 4
passengers including fixed costs
€0.45
€0.40
€0.35
Costs per kilometre (€)
€0.30
€0.25
€0.20
€0.15
€0.10
€0.05
€-
1 2 3 4
Rail Car
Variable costs Fixed costs
31 4.S52 - Modal choice criteria in rail transport - September 2018When fixed car costs are included, train fares are less expensive per kilometre than car for
most countries in the EU for solo trips. The figure shows that car occupancy is crucial for
the car costs. For commuters and business trips, the average car occupancy is just over one,
while for leisure trips this is closer to two (Dickinson et al., 2018).
Reliability
As in urban areas the level of road congestion is often high, reliability of travel times can be
an important competitive advantage of rail transport. In the case of scheduled transport
services, reliability is often referred to as punctuality. The punctuality of rail services in
EU Member States was assessed with data from the Rail Market Monitoring Scheme dataset
(Steer Davies Gleave, 2016). Almost all countries achieve very high (>90%) punctuality
scores, meaning that most trains arrive on-time at the stations.
Figure 24 - Punctuality of regional and local passenger services by Member State (Steer Davies Gleave, 2016)
ProRail/NS (2017) shows that the punctuality of passenger trains in the Netherlands,
Belgium, Sweden, Denmark, France, United Kingdom, Switzerland has remained fairly
comparable between 2012 and 2015, all achieving levels of 90-98% (measured with a
threshold of 5.5 minutes) and averaging 91.2%.
Car journey time reliability data is seldom published and often inconsistent between
Member States (Steer Davies Gleave, 2016). However, in terms of delay, The Tomtom
traffic index gives an indication of congestion levels, as measured by the average extra
travel time percentage compared to free flow levels in the large cities in Europe (see also
Text box 1 on Congestion).
32 4.S52 - Modal choice criteria in rail transport - September 2018Frequency
A key driver for the share of rail transport is the network and frequency of connections.
Figure 25 shows the frequencies of connections at the European railway network. When
comparing this map with the shares of rail in passenger transport in Figure 1, it becomes
clear that all countries with a relatively high share of rail in the modal split (above 8%),
have also high rail frequent services.
Also within the various market segments, there are significant differences between
countries.
For example, high speed rail transport is strongly concentrated in Western Europe and
virtually non-existing in Eastern Europe. The literature review (as presented in Paragraph
2.2) confirms that the speed of transport is for all transport purposes one of the key
performance criteria when evaluating the potential of international rail transport. So it is
clear that HSR is a precondition for a significant share for rail in international travel.
In general, main cities and agglomerations have a denser network and higher service
frequency than rural areas. Trips in, to or from (main) cities dominate the train passenger
market. In the Netherlands >50% of the train journeys is from or to the four main cities
(KiM, 2015).
33 4.S52 - Modal choice criteria in rail transport - September 2018Figure 25 - Frequency of direct rail connections 34 4.S52 - Modal choice criteria in rail transport - September 2018
Comfort & quality
     The Flash Eurobarometer Survey on Europeans’ satisfaction with rail services was conducted
     in 2012-13 to analyse public satisfaction with a number of features of rail transport.
     Steer Davies Gleave (2016) used the data to evaluate satisfaction levels related to comfort
     and quality of rail services, railway stations, ticketing attributes (ease of buying tickets),
     service frequency, punctuality.

     The figures show an extremely high variation within the different countries. Most railways
     received satisfaction scores of 50-80% for punctuality and reliability. As with all subjective
     measures, however, it is not clear whether this reflects the quality of the facilities
     themselves or a disparity between customer expectations and actual performance. As was
     shown in the paragraph on reliability, punctuality is on a high level in almost all countries,
     so operators with similar actual punctuality can be given widely different subjective scores.

     Less than half of Europeans are satisfied with the levels of cleanliness and maintenance of
     railway carriages, including train toilets, in their country (48%). Satisfaction is especially
     low in Romania, Hungary, Italy, Bulgaria and Slovakia. 68% of Europeans satisfied with the
     provision of information about train timetables and 67% of Europeans satisfied with the ease
     of buying tickets.

     Satisfaction with ease of buying tickets exceeded 50% except in Estonia and was highest in
     France. However, the satisfaction with through ticketing was often low. A proportion of 55%
     of respondents score their level of satisfaction with rail services as ‘high’ or ‘good’. There a
     clear distinction in satisfaction levels between Western and Eastern European Member
     States. The large differences in customer satisfaction in EU member states indicate that
     country specific measures are needed to improve comfort and perceived quality
     performance levels.

     Environment
     Travelling by train have less negative impacts on the environment than travelling by car or
     air plane. Rail transport has less emissions of CO2, nitrogen, fine dust and noise. Rail travel
     is a sustainable way of transport, because energy consumption and CO 2 emissions per pkm
     are much lower than emissions of other modes. In Europe more than 60% of the rail network
     is electrified (IEA/UIC, 2018), which gives opportunities to use renewable energy on short
     term. In 2015 ca. 20 % of rail transport in EU-28 was energized by renewable energy (IEA ;
     UIC, 2017).

     In cities, high capacity urban rail (including metro-networks) is a very energy-efficient
     transport mode, which results in low CO2 emissions compared with other modes. Figure 26
     shows the CO2 emission of several city travel modes.

35   4.S52 - Modal choice criteria in rail transport - September 2018
You can also read