Basel Committee on Banking Supervision - Early lessons from the Covid-19 pandemic on the Basel reforms
←
→
Page content transcription
If your browser does not render page correctly, please read the page content below
Basel Committee
on Banking Supervision

Early lessons from the
Covid-19 pandemic on
the Basel reforms

July 2021
This publication is available on the BIS website (www.bis.org).

© Bank for International Settlements 2021. All rights reserved. Brief excerpts may be reproduced or
 translated provided the source is stated.

ISBN - 978-92-9259-491-6 (online)
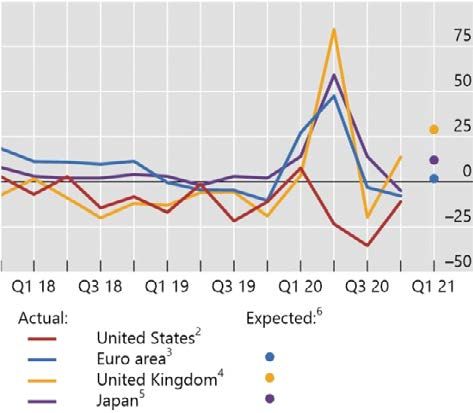
Contents

Glossary ..................................................................................................................................................................................................v

Early lessons from the Covid-19 pandemic on the Basel reforms ................................................................................. 1

Executive summary ........................................................................................................................................................................... 1

Introduction ......................................................................................................................................................................................... 4

1. The international banking system during the pandemic ......................................................................................... 4

2. The resilience of the banking system ............................................................................................................................. 13
 2.1. Overall resilience ........................................................................................................................................................... 13
 2.2. Regulatory measures and resilience outcomes during the Covid-19 pandemic ................................. 17
 2.3. Impact on lending ........................................................................................................................................................ 20

3. Capital framework .................................................................................................................................................................. 25
 3.1 The functioning of capital buffers .......................................................................................................................... 25
 3.2 Countercyclical capital policy during the pandemic ....................................................................................... 33
 3.3 Insights from pricing of Additional Tier 1 instruments................................................................................. 40

4. The Liquidity Coverage Ratio ............................................................................................................................................ 45

5. Leverage ratio and market intermediation .................................................................................................................. 52

6. The cyclicality of bank regulatory requirements during the pandemic ............................................................ 62
 6.1. Capital impact from credit loss provisioning ..................................................................................................... 62
 6.2. Capital for banks’ market activities ........................................................................................................................ 66

Annex 1: List of data sources ...................................................................................................................................................... 71

Annex 2: TFE survey questionnaire ........................................................................................................................................... 74

Annex 3: The liquidity buffer – case studies ......................................................................................................................... 77

Annex 4: Collation of supplemental tables and charts ..................................................................................................... 83

Annex 5: Members of the Task Force on Evaluations ....................................................................................................... 87

Early lessons from the Covid-19 pandemic on the Basel reforms iii

Glossary

AT1 Additional Tier 1
BCBS Basel Committee on Banking Supervision
BIS Bank for International Settlements
bp basis point
CBR Combined buffer requirement
CCoB Capital conservation buffer
CCP Central counterparty
CCR Counterparty credit risk
CCyB Countercyclical capital buffer
CD Certificate of deposit
CDS Credit default swap
CECL Current expected credit losses
CET1 Common Equity Tier 1
CoCo Contingent convertible security
CP Commercial Paper
CRA Credit rating agency
CVA Credit valuation adjustment
D-SIB Domestic systemically important bank
ECB European Central Bank
ECL Expected credit losses
EMEA Europe, Middle East and Africa
FINMA Swiss Financial Market Supervisory Authority
FRTB Fundamental Review of the Trading Book
FX Foreign exchange
GDP Gross domestic product
GFC Global Financial Crisis
G-SIB Global systemically important bank
HLBA Historical look-back approach
HQLA High-quality liquid assets
IAS International Accounting Standard
IFRS International Financial Reporting Standard
IL(M) Incurred loss (method)
IMM Internal Model Method
LCR Liquidity Coverage Ratio
LLA Loan loss allowance
MDA Maximum distributable amount
MMF Money market funds

Early lessons from the Covid-19 pandemic on the Basel reforms v
MPG Macroprudential Policy Group
NFC Non-financial corporate
NSFR Net Stable Funding Ratio
OSFI Office of the Superintendent of Financial Institutions (Canada)
P&L Profit and loss
PLA P&L attribution test
pp percentage point(s)
QIS Quantitative Impact Study
RWA Risk-weighted asset
SA-CCR Standardised approach for CCR
SFT Secured financing transaction
SICR Significant increases in credit risk
SME Small and medium-sized entity
SNL Standard and Poor's Market Intelligence
SRB Systemic risk buffer
SRS Supervisory Reporting System
TFE Task Force on Evaluations
USD US dollar
(s)VaR (Stressed) value at risk
WGL Working Group on Liquidity
YTM Yield to maturity
YTW Yield to worst

vi Early lessons from the Covid-19 pandemic on the Basel reforms

Early lessons from the Covid-19 pandemic on the Basel reforms

Executive summary

Beginning in 2009, the Basel Committee on Banking Supervision (the Committee) developed a set of new
regulatory standards, commonly referred to as the Basel reforms, in response to the Global Financial Crisis
of 2007–09. 1 These standards aimed to strengthen the regulation, supervision and risk management of
banks. Following their issuance, the Committee has deemed it appropriate to evaluate the impact of those
standards already implemented on the resilience and behaviour of the banking system.
 As part of this evaluation, the Committee has started to assess the ongoing Covid-19 pandemic’s
impact on the banking system, as it has posed a significant global test of the Basel reforms. This report
provides a preliminary assessment of whether the reforms implemented thus far have functioned as
intended in light of the pandemic, which has resulted in a pronounced global economic shock, albeit one
significantly different in nature from the financial crisis that motivated the Basel reforms.
 The report reflects the Committee’s initial findings based upon empirical analysis of a
combination of vendor and regulatory data, case studies and the results of a supervisory survey conducted
by the Committee. The findings of this report should be considered in light of (i) the incomplete data
available to date regarding the impact of the pandemic, which continues to unfold and whose full effect
on the economy may not yet be clear, and (ii) the difficulty of distinguishing between the effects of the
Basel reforms and those of the extensive and wide-ranging monetary and fiscal support measures
undertaken by authorities to address the economic impact of the pandemic.
 The report finds that the increased quality and higher levels of capital and liquidity held by banks
have helped them absorb the sizeable impact of the Covid-19 pandemic thus far, suggesting that the Basel
reforms have achieved their broad objective of strengthening the resiliency of the banking system. Banks
and the banking system would have faced greater stress had the Basel reforms not been adopted.
Throughout the unprecedented global economic downturn the banking system has continued to perform
its fundamental functions, as banks have continued to provide credit and other critical services. While the
report finds that some features of the Basel reforms, including the functioning of capital and liquidity
buffers, the degree of countercyclicality in the framework, and the treatment of central bank reserves in
the leverage ratio may warrant further consideration, it does not seek to draw firm conclusions regarding
the need for potential revisions to the reforms.
 Following a brief narrative regarding the impact of the pandemic on the banking system
(Section 1), this report outlines the Committee’s initial findings regarding (i) the overall resilience of the
banking system during the pandemic (Section 2); (ii) the usability of capital buffers, members’ experience
with the countercyclical capital policies and price movements of Additional Tier 1 (AT1) capital instruments
(Section 3); (iii) liquidity buffers (Section 4); (iv) the impact of the leverage ratio on financial intermediation
(Section 5); and (v) the cyclicality of specific Basel capital requirements (Section 6).

The overall resilience of the banking system during the pandemic
As noted, the analysis indicates that the banking system has remained resilient through the pandemic,
strengthened by substantial increases in capital and liquidity held by banks since the adoption of the Basel
reforms. No internationally active bank has failed or required significant public sector funding since the
onset of the pandemic, though future losses may emerge as the pandemic remains ongoing. Banks have
generally managed to absorb temporary increases in the costs of liquidity and higher credit risk while

1
 See Basel III: international regulatory framework for banks at www.bis.org/bcbs/basel3.htm and Minimum capital requirements
 for market risk at www.bis.org/bcbs/publ/d457.htm.

Early lessons from the Covid-19 pandemic on the Basel reforms 1
substantially maintaining their services to customers. Market measures of resilience (eg banks’ credit
default swap (CDS) spreads) do, however, indicate that some banks experienced strain early in the
pandemic. Regression results suggest that banks with higher Common Equity Tier 1 (CET1) capital ratios
experienced smaller increases in CDS spreads. Moreover, the analysis indicates that more strongly
capitalised banks showed greater increases in lending to businesses and households than other banks.
Thus, the global banking system has been able to complement and support monetary and fiscal
authorities’ efforts to maintain economic activity during the pandemic, helping to absorb the shock rather
than amplifying it, as occurred during the 2007–09 financial crisis.

The usability of capital buffers and price movements of AT1 capital instruments
The analysis indicates that most banks maintained capital ratios well above their minimum requirements
and buffers during the pandemic partially due to authorities reducing capital requirements and buffers
and imposing restrictions on capital distributions via dividend payments and share buybacks, as well as
due to the extensive fiscal and monetary support provided to borrowers. This makes it difficult to draw
conclusions regarding banks’ willingness to use capital buffers. Though some evidence suggests that
banks may have been hesitant to use their regulatory capital buffers had it been necessary.
Regression results, including a detailed study of loan data from the euro area, indicate that banks that had
less headroom (ie the amount of capital resources above minimum capital regulatory requirements and
buffers) tended to lend less during the pandemic than those with more headroom. However, it is unclear
whether this reluctance to use capital buffers reflects banks’ uncertainty regarding potential future losses
or the wider market stigma that may result if a bank were to operate in its buffers.
 Most authorities that maintained a positive countercyclical capital buffer (CCyB) prior to the
pandemic reduced them in order to provide banks with additional headroom. Similarly, several authorities
that did not have positive CCyBs lowered other regulatory requirements or buffer levels. While it is difficult
to assess the quantitative effect of these capital releases independent of other measures, analysis provides
some evidence that the capital release had a positive effect on lending during the pandemic. These
findings, taken together with supervisors’ survey responses, suggest that it may be beneficial to consider
whether there is sufficient releasable capital in place to address future systemic shocks.
 The report also includes an analysis of price and yield movements of AT1 capital instruments
compared to those of subordinated debt instruments and common equity. The analysis indicates that the
pandemic resulted in increased AT1 yield premia for both preferred stock and contingent convertible
securities relative to unsecured debt, suggesting that market participants generally perceived AT1
instruments to be riskier than debt. Furthermore, thus far during the pandemic, the two types of AT1
instruments have experienced broadly similar price movements indicating that investors do not perceive
one instrument to be riskier than the other. Regression analyses also show that AT1 prices are positively
associated with both equity and subordinated long-term debt prices. The report does not directly seek to
address the issue of AT1 instruments’ loss-absorption capacity on a going-concern basis.

Liquidity buffers
Certain banks faced liquidity pressure in the early phase of the pandemic. The severity of the pressure
largely depended on banks’ funding models. For example, banks reliant on unsecured wholesale money
markets were more likely to have experienced pressure as funding sources dried up and they experienced
large draws on loan facilities. In contrast, banks with stable deposit franchises experienced negligible
liquidity pressure even at the peak of the stress. While an increase in the amount of high-quality liquid
assets that the Liquidity Coverage Ratio (LCR) requires banks to hold helped banks absorb this liquidity
pressure, measures taken by central banks and governments to support economies significantly reduced
liquidity pressures. Overall, banks met large drawdown demands on committed lines and engaged in early
buybacks of funding instruments from money market funds. Despite relatively limited liquidity stress, some
jurisdictional studies highlighted that a range of banks took defensive action, reflecting in part their
targeting of internal LCR levels well above 100%. However, these actions do not appear to have

2 Early lessons from the Covid-19 pandemic on the Basel reforms
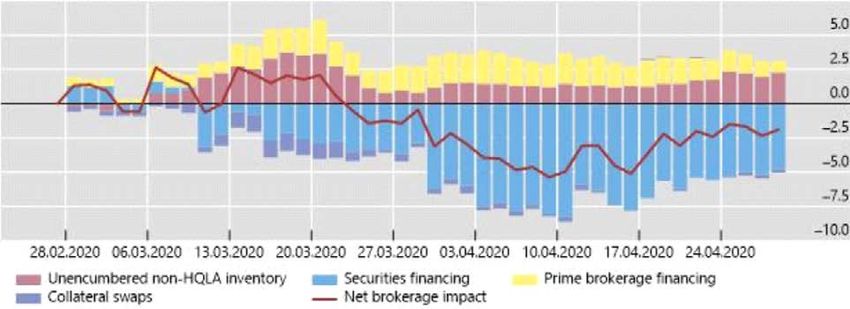
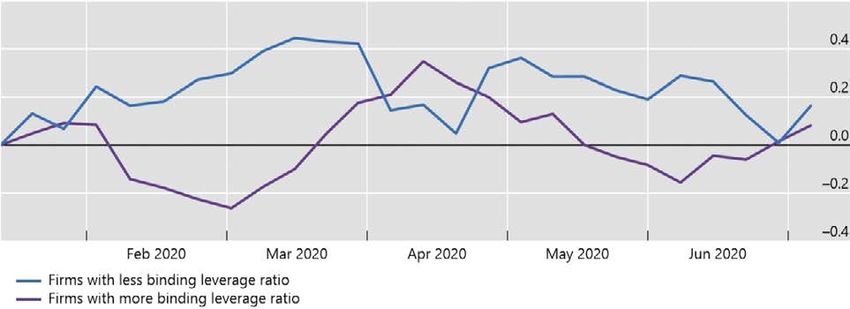
contributed materially to the wider disruption in financial markets that prompted central banks to
intervene in March 2020.

The impact of the leverage ratio on financial intermediation
While the leverage ratio (which has not yet been implemented by all member jurisdictions) was not a
binding constraint for most banks during the pandemic, the analysis – based on detailed jurisdictional
studies – examines whether banks that had a smaller amount of capital above leverage ratio requirements
and buffers were less active than other banks in financial market intermediation during the pandemic.
Overall, bank positions in government bond and repurchase agreement (repo) markets remained stable
or rose in response to the rapid surge in client demand for liquidity at the onset of the crisis, though there
is evidence that leverage ratio requirements may have reduced banks’ incentives to mitigate the large
imbalances that emerged in some markets. Several member jurisdictions temporarily exempted central
bank reserves from the leverage ratio calculation, which eased banks’ balance sheet constraints on their
intermediation activity.

The cyclicality of specific Basel capital requirements
The report concludes with an early examination of the cyclicality (defined as the extent to which regulatory
requirements respond in the opposite direction to movements in economic activity) of the impact of credit
loss provisions and market risk requirements on capital positions during the pandemic. The analysis
indicates that extensive governmental support measures to borrowers significantly dampened the impact
of the economic contraction on bank capital. Measures taken to delay the recognition of credit provisions
in the measurement of regulatory capital also deferred the impact. Collectively, these measures make it
difficult to draw conclusions about the cyclicality of capital requirements. The analysis finds that sources
of cyclicality in the current (ie Basel 2.5) market risk framework prompted supervisors to take relief
measures in several jurisdictions. However, revisions to this framework, agreed upon in January 2019, are
expected to mitigate these sources of cyclicality.
 The analysis presented herein will be updated and included, as relevant, in a more comprehensive
evaluation report covering the Basel reforms implemented over the past decade that the Committee plans
to publish in 2022 as additional data on the impact of the Covid-19 pandemic becomes available.

Early lessons from the Covid-19 pandemic on the Basel reforms 3
Introduction

1. Beginning in 2009, in response to the 2007–09 Global Financial Crisis (GFC), the Committee
developed a new set of regulatory standards commonly referred to as the Basel reforms. These reforms
aimed to strengthen the regulation, supervision and risk management of banks. Nearly a decade after this
initiative began, the Committee has deemed it appropriate to evaluate the impact that these reforms have
had on the banking system.
2. As part of this evaluation, the Committee has assessed the impact of these reforms on the
resilience and behaviour of banks during the Covid-19 pandemic, which has posed a significant test of the
reforms on a global scale. This report presents the Committee’s evaluation, which is based on a
combination of vendor and regulatory bank-level data, jurisdictional case studies and the results of
supervisory surveys. 2 The data used are described in Annex 1.
3. The findings in this report are not fully comprehensive or conclusive as the pandemic is ongoing
and its full effects on the banking system may not yet have emerged. As such, the report does not seek to
draw firm conclusions regarding the need for potential revisions to the Basel reforms. The analysis
presented herein will be updated and included, as relevant, in a full evaluation report on the Basel reforms
to be published in 2022.

1. The international banking system during the pandemic

4. The spread of the Covid-19 virus and the measures taken to control it resulted in large asset price
declines, severe dislocations in funding markets and extraordinary economic contractions around the
world. Governments and central banks responded with extensive fiscal, monetary and regulatory support
measures. In contrast to the GFC, in which banks were the sources and propagators of stress, to date banks
have remained resilient and have complemented public sector support by continuing to provide core
financial services to help cushion the impact of the pandemic on the broader economy.

Financial market turbulence
5. In the early months of 2020, as the Covid-19 virus spread from country to country, authorities
reacted by imposing lockdowns and social distancing measures. Production ceased in many sectors.
Households cut back on spending and increased precautionary savings. Many people were unable to work,
and unemployment rates rose in many jurisdictions.
6. While the timing of Covid-19 outbreaks and containment measures differed across jurisdictions,
close economic and financial interdependencies resulted in the rapid transmission of the shock through
global markets. In March 2020, concerns about the trajectory of the pandemic and its impact on economic
growth sharply diminished risk appetite, as evidenced by periods of extreme volatility in equity and other
markets (Graph 1). The S&P 500 fell by 30% between February and March 2020 and implied volatility
spiked to levels not seen since 2008. Credit spreads widened sharply, especially for high-yield bonds.
Issuance of leveraged loans and private debt largely ceased and emerging markets experienced large
capital outflows and sharp movements in foreign exchange rates.

2
 Note that as part of its Covid-19 burden-relief measures, the Committee did not conduct a quantitative impact study (QIS)
 collecting bank data covering H1 2020.

4 Early lessons from the Covid-19 pandemic on the Basel reforms
Developments in bond and equity markets Graph 1

(i) Corporate spreads1 (ii) Equity market developments (iii) Stock market implied volatility
 Basis points 19 Feb 2020 = 100 Percentage points

1
 Option-adjusted spreads. 2 Average of banks and financial services global equity indices, based on market value. 3 Average of health
care and technology global equity indices, based on market value. 4 Average of energy and basic resources global equity indices, based
on market value.
Sources: Bloomberg; Datastream; ICE BofAML indices; BIS calculations.

The “dash for cash”
7. The sudden downturn in economic activity was associated with a sharp rise in the demand for
liquidity amid concerns about businesses’ ability to absorb the shock. Many non-financial corporates
pre-emptively drew down existing credit lines to build cash reserves in order to cope with dwindling
revenues due to pandemic containment measures. In 2020, listed non-financial corporates’ net credit
drawdowns were significantly higher than in equivalent periods in 2019 (Graph 2).

Public non-financial corporates’ credit line drawdowns1
Percentage change from same period (quarter) in 2019 Graph 2

1
 Constructed as changes in the total amount of all credit drawdowns by all non-financial firms. Balanced sample across the same quarters
in 2019 and 2020.
Sources: S&P Capital IQ; BIS calculations.

Early lessons from the Covid-19 pandemic on the Basel reforms 5
8. Non-bank financial intermediaries also faced a growing need for liquidity. Increased demand
from corporates and investors for precautionary holdings of cash and highly liquid assets led to outflows
from investment funds, including certain money market funds (Graph 3). Leveraged investors also faced
liquidity pressure, with some reportedly forced to close out positions in order to meet margin calls due to
changes in asset prices.

Overview of the March 2020 money market fund (MMF) run1
In billions of US dollars Graph 3

(i) Prime and institutional MMFs (ii) MMFs grouped by volatility

Note: The vertical lines indicate 18 March 2020 (Federal Reserve unveils the MMLF programme and the ECB introduces the PEPP, which
included non-financial commercial paper). The shaded areas indicate 6–26 March 2020 (period of consecutive outflows).
AUM = assets under management; CNAV = constant NAV; LVNAV = low-volatility NAV; VNAV = variable NAV.
The sample includes money market funds as classified by CRANE (left-hand panel) and Informa iMoneyNet (right-hand panel).

Sources: CRANE; Informa iMoneyNet; BIS calculations.

9. Market liquidity also deteriorated, including in markets traditionally seen as deep and liquid
(Graph 4). In particular, signs of stress emerged in a range of short-term funding markets – including bond,
commercial paper and repo markets – as leveraged and unleveraged investors reduced their activity. In
mid-March 2020, extreme selling pressure spread to even the most liquid government bond markets.

6 Early lessons from the Covid-19 pandemic on the Basel reforms
Short-term funding market and treasury market movements Graph 4

(i) Commercial paper spread to OIS (ii) Market liquidity
 Basis points Cents per dollar notional Index (reversed)

1
 Commercial paper 90-day yield is a composite of offered levels for A1/P1/F1-rated US commercial paper programmes. 2 Bloomberg
liquidity index, multiplied by –1. Index levels are measured by the root mean squared error between bonds’ market yields and theoretical
yields based on cubic and exponential spline methodologies. The index can be deemed a proxy for aggregated on- and off-the-run spreads.
Sources: Bloomberg; JPMorgan Chase; BIS calculations.

10. Dealers helped alleviate these liquidity strains by extending repo financing, absorbing sales and
building inventories of securities. However, their ability to meet unprecedented demand for liquidity was
constrained by falling risk appetite in volatile markets and the need to manage their own balance sheet
constraints.
11. Foreign exchange (FX) markets continued to function despite the strain, although the relative
cost of offshore USD increased. In particular, in mid-March 2020, USD-based FX and swap markets
experienced significant increases in cost and volatility (Graph 5).

FX swap basis, against the US dollar
In basis points Graph 5

(i) Three-month OIS basis (ii) Three-month LIBOR basis1

1
 Calculated based on the covered interest parity condition, using foreign exchange forward and spot rates and three-month LIBOR rates.
Sources: Bloomberg; BIS calculations.

Policy responses
12. Jurisdictions took extensive policy action on multiple fronts in response to the crisis. Central banks
introduced a range of monetary interventions, which included lowering policy rates, extending asset

Early lessons from the Covid-19 pandemic on the Basel reforms 7
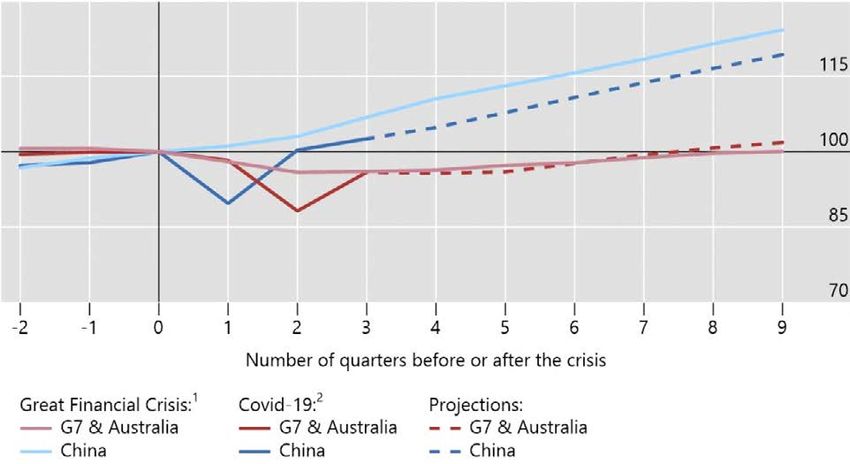
purchase programmes and providing liquidity support. Fiscal authorities offered extensive support to the
corporate sector via loan guarantees and schemes to support payment of salaries. Authorities also worked
with banks to put in place loan payment deferrals. These measures helped cushion the economic impact
of the pandemic, although there were inevitable sharp declines in output across the world (Graph 6).

Evolution of GDP in the Covid-19 pandemic and the Great Financial Crisis
Index, crisis start quarter = 100 Graph 6

1
 Quarter 0 = Q3 2008. 2
 Quarter 0 = Q4 2019; model projections starting in Q4 2020.
Sources: Datastream; national data; BIS calculations.

13. There were also policies directed at the functioning of banking systems. These largely temporary
measures fell into the following three groups:
• Measures to enhance the availability of bank funding and liquidity, which included central bank
 term funding, liquidity for lending schemes and activation of swap lines.
• Measures to help free up existing bank resources, which included encouraging the use of liquidity
 and capital buffers, steps to mitigate increases in risk-weighted capital requirements and
 reductions in certain capital and leverage requirements and buffers.
• Measures to help conserve capital, which included distribution restrictions, extending the
 transition period for deduction of provisions from capital, and loan guarantees.
 These countercyclical interventions aimed to help mitigate the economic downturn by supporting
banks in meeting liquidity and credit demand from borrowers.
14. Collectively, these measures helped stabilise key markets. Market risk appetite improved and
asset prices recovered from Q2 2020 onwards.

Banks in the pandemic
15. Banks entered the pandemic with robust capital and liquidity ratios that had materially increased
since the GFC (Section 2). Banks’ capital ratios and LCRs remained robust throughout the pandemic,
enabling them to meet loan demand and complement the broader support measures taken by authorities.

8 Early lessons from the Covid-19 pandemic on the Basel reforms
Loan demand, from both households and corporates, increased sharply in many jurisdictions during the
crisis, although it varied across jurisdictions. Bank lending generally increased early in the pandemic (Graph
7), in many cases supported by the provision of public loan guarantees, although lending growth generally
eased in H2 2020.

Banking trends Graph 7

(i) Demand for loans from credit conditions survey1 (ii) Bank lending to the non-financial sector7
 In net percentage Q1 2019 =100

1
 Positive figure indicates an increase in demand. 2 Net Percent of Domestic Respondents Reporting Stronger Demand for Commercial
and Industrial Loans from large and middle-market firms (annual sales of $50 million or more). 3 Net percentages of banks reporting an
increase in demand from large enterprises. 4 Net percentages of banks reporting an increase in demand from large PNFCs. 5 Net
percentages of banks reporting a stronger demand for loans from large firms. 6 Next three months. 7 For EMEs, simple average for Brazil,
Indonesia, Mexico, Russia, South Africa and Turkey. Series used for each jurisdiction (seasonally adjusted): For Brazil, loans from financial
system to non-financial corporations and households (total credit outstanding); for European Monetary Union, money supply, loans to other
Eurozone residents except government; for Indonesia, commercial and rural banks’ claims on private sector (loans); for Mexico, commercial
banks’ credit to private sector; for Russia, bank lending, corporate and personal loans; for Turkey, bank lending to private sector; for the
United Kingdom, monetary financial institutions’ sterling net lending to private non-financial corporations and households; for the United
States, commercial banks’ loans and leases in bank credit.
Sources: Bank of England; Bank of Japan; European Central bank; Board of Governors of the Federal Reserve System; national sources.

16. While banks entered the crisis with stronger capital and liquidity positions, bank valuations were
significantly impacted, particularly in the initial phase of the pandemic. Banks were among the worst
performers during the stock market sell-off in March 2020, with bank equity prices dropping by
approximately 40% in Q1 2020 (Graph 1 (ii), above). Bank credit spreads also widened significantly, and
lower-rated banks and more junior instruments suffered the greatest impact (Graph 8).

Early lessons from the Covid-19 pandemic on the Basel reforms 9
Banking financing performance
In basis points Graph 8

(i) Funding costs1 (ii) Banks’ CDS spreads movements during the periods of
 sell-off and stabilisation2

1
 OAS = option-adjusted spreads for the following dollar indices: Markit iBoxx USD Contingent Convertible Liquid Developed Market AT1,
iBoxx USD Banks Subordinated and iBoxx USD Banks Senior. 2 Ratings as of 19 Feb 2020, simple average by group. Stock prices measured
in per cent growth, CDS measured in basis point changes. The sample is split between the sell-off period (rise in the case of CDS), from
19 Feb to 19 Mar 2020, and the stabilisation period, from 19 Mar to 7 Apr 2020.
Sources: FitchRatings; IHS Markit iBoxx; BIS calculations.

17. Between mid-February and mid-March, wholesale funding costs increased sharply for some
banks, particularly lower-rated banks, and some faced temporary pressure on their liquidity positions
(Section 4). Banks that relied on unsecured wholesale money markets and that faced large drawdowns on
loan facilities tended to face higher pressure. In contrast, pressure on banks with stable deposit franchises
was limited even at the peak of the stress, since drawdowns on credit lines were often deposited at those
same banks.
18. With respect to capital pressure, institutions exposed to increased market volatility faced higher
capital requirements on market risk exposures early on in the pandemic. Some banks grew concerned
about potential balance sheet constraints, particularly in the face of heightened demand for the resolution
of market imbalances caused by the withdrawal of non-bank financial institutions. Many banks’ profitability
fell as higher loss provisioning compounded a pre-existing compression of net interest margins (Graph 9
(i)).
19. Bank equity prices recovered towards the end of 2020, although they lagged behind the broader
market (Graph 9 (ii)). CDS spreads gradually stabilised, with spreads for higher-rated banks returning to
close to their pre-crisis levels by Q2 2020, although spreads at lower-rated banks remained more elevated.
Provisioning rates fell in Q3 2020 as concerns about deterioration in credit quality stabilised, in part due
to the extensive and ongoing support offered to borrowers. The easing of provisioning rates, the
imposition of capital conservation measures, the adoption of loan guarantees and countercyclical
regulatory measures collectively resulted in capital ratios increasing for a wide range of banks in the
second half of the year, notwithstanding continued lending growth.

10 Early lessons from the Covid-19 pandemic on the Basel reforms
Bank profitability and equity price movements Graph 9

(i) Profits and provisions1 (ii) Bank equity prices
USD bn Per cent 2 Jan 2020 = 100

1
 Sample of 83 major banks from 25 jurisdictions. 2 Sum of quarterly loan loss provisions or reclassified impairment of loans when data
on provisions were not available. 3 Based on Datastream indices.
Sources: Datastream; Refinitiv Eikon; SNL; BIS calculations.

20. Throughout the unprecedented global macroeconomic downturn, the banking system has
continued to perform its fundamental functions, with payment services remaining intact and banks
continuing to provide credit and other critical services, aided by extraordinary public support measures.
The sustained growth in lending during this crisis contrasts sharply with what happened during the GFC
(Graph 10). Bank resilience has complemented broader support to the economy from governments and
central banks, helping banks provide many borrowers with a bridge across the crisis.
21. Bank resilience has been bolstered by broad public sector support to the economy. As this
support is removed, additional bank losses could emerge. Additionally, a longer-term consequence of the
pandemic will be higher corporate and government debt, posing additional risks to the banking sector in
the future. Finally, the pandemic is not over and there is still potential for further economic and financial
market disruption.

Early lessons from the Covid-19 pandemic on the Basel reforms 11
Bank lending during the GFC and Covid-19 Graph 10
 Per cent

1
 Bank credit to the private non-financial sector (based on 44 reporting countries). 2
 Immediate counterparty basis, for all reporting
countries, all counterparty sectors and all maturities.
Sources: BIS; BIS calculations.

12 Early lessons from the Covid-19 pandemic on the Basel reforms
2. The resilience of the banking system

22. A key objective of the Basel reforms is to build a resilient banking system that can absorb shocks
and continue to support economic activity. Bank resilience helps mitigate the adverse consequences of
shocks and facilitates a rapid recovery once a crisis abates. This section examines the resilience of the
global banking system during the pandemic and investigates the extent to which the Basel reforms may
have contributed to such resilience.

2.1. Overall resilience

23. The lack of failure of any internationally-active banks to date during the pandemic demonstrates
the resilience of the global banking system. While governments and central banks have provided
exceptional support to the economy, indirectly supporting banks, most major banks have not needed a
significant infusion of public funds, nor have they sustained heavy losses or faced extended liquidity
pressure. Rather, the banking system has continued to provide essential financial services to the economy
during this period.
24. This section provides a time series analysis of resilience, focusing on the period since the
implementation of the Basel reforms in the early 2010s to the present.
25. The analyses are carried out using both the Committee’s Quantitative Impact Study (QIS) and
Supervisory Reporting Systems (SRS) data (collectively, QIS/SRS data), as well as vendor data for a sample
of large banks. 3 The assessment looks at banks’ risk-weighted regulatory capital ratios, non-risk-based
leverage ratios, and the two liquidity metrics included in the Basel reforms: the LCR and the Net Stable
Funding Ratio (NSFR).
26. As shown in Table 1, banks’ overall resilience has, in general, significantly improved since the
adoption of the initial Basel reforms. From 2013 to the end of 2019, banks’ capital, leverage and liquidity
positions improved as reforms were implemented. 4 As of 30 June 2020, approximately three months into
the Covid-19 crisis, banks’ capital, leverage and liquidity positions had remained strong and did not appear
to be significantly impacted by the pandemic, reflecting in part the exceptional policy support measures
that had been taken.

3
 Information considered for this section of the report was obtained through previous QIS and SRS data collections. External
 vendor data from SNL was used as an additional source to validate results.
4
 The analysis of the impact of Basel reforms reflects data from 2013 onwards in order to discount the build-up of capital that
 took place during and immediately after the 2007–09 global financial crisis and the European sovereign debt crisis.

Early lessons from the Covid-19 pandemic on the Basel reforms 13
Overview of results, using consistent sample of banks, 5 in per cent Table 1

 31 December 2013 31 December 2019 30 June 2020
 Group Of Group Group Of Group Group Of Group
 1 which: 2 1 which: 2 1 which: 2
 G-SIBs G-SIBs G-SIBs
 Risk-based capital,
 initial Basel III
 framework

 CET1 ratio 10.1 9.9 8.4 12.9 12.8 13.9 12.7 12.5 14.5

 Tier 1 ratio 10.4 10.3 9.1 14.5 14.4 14.9 14.3 14.2 15.5

 Total ratio 11.8 11.6 10.8 17.0 16.9 17.3 16.9 16.7 18.1

 Leverage ratio: Fully
 phased-in final Basel III
 Tier 1 leverage ratios 4.5 4.4 3.9 6.2 6.2 5.1 6.1 N/A N/A

 Liquidity

 LCR 122.3 127.1 145.8 136.1 132.8 163.1 140.3 136.7 188.3

 NSFR 112.5 115.0 113.0 116.9 118.0 120.7 118.7 120 122.5

 Note: Due to the cancellation of the end-2020 Basel III monitoring exercise, the 30 June 2020 final Basel III leverage ratios are not available
 (Only the weighted-average initial Basel III leverage ratio for Group 1 banks is presented). 30 June 2020 NSFR numbers are approximated
 based on both QIS and SNL.
 Sources: Basel Committee on Banking Supervision; SNL.

27. More specifically, as of year-end 2019, Common Equity Tier 1 (CET1), Tier 1 and total capital ratios
had all improved significantly compared to year-end 2013 across Group 1 banks, global systemically
important banks (G-SIBs) and Group 2 banks. For instance, weighted-average CET1 ratios improved by
nearly 300 basis points (bp) for Group 1 banks and G-SIBs, and by more than 500 bp for Group 2 banks.
Following the outbreak of the pandemic, weighted-average capital ratios declined slightly (by less than
30 bp) for Group 1 banks and G-SIBs. 6 Overall, banks maintained their strong capital positions during the
pandemic, demonstrating general resilience against a significant and unprecedented negative economic
shock. This result also reflects fiscal support measures that helped reduce loan losses and payout
restrictions, which in turn helped banks retain capital.
28. Liquidity positions have also improved materially, both qualitatively and quantitatively, since
end-2013. Both the LCR and NSFR were notably higher for Group 1 and Group 2 banks by end-2019.
During this period, as banks built up liquidity buffers, the LCR increased by an average of approximately
15 percentage points (pp) for Group 1 and Group 2 banks and by a more modest but significant average
of 6 pp for G-SIBs. NSFR data suggests a more modest improvement in banks’ funding stability, possibly
because the NSFR is still in the process of being implemented globally. Both liquidity metrics were further
strengthened over the first half of 2020.
29. Note that capital levels in many jurisdictions have been bolstered in 2020 by government,
regulatory, monetary and fiscal policy assistance measures, including temporary debt relief programmes.
While the pandemic may ease as vaccinations become more widespread, some jurisdictions could see
meaningful deterioration in capital ratios, particularly as support is withdrawn.

5
 “Group 1” banks are defined as internationally active banks that have Tier 1 capital of more than €3 billion and include all
 29 institutions that have been designated as global systemically important banks (G-SIBs). “Group 2” banks are banks that have
 Tier 1 capital of less than €3 billion or are not internationally active. The set of Group 2 banks is not an internationally
 representative sample.
6
 Group 2 banks experienced an increase in capital ratios, largely driven by one sample bank’s 5 pp increase. The set of Group 2
 banks is not an internationally representative sample.

14 Early lessons from the Covid-19 pandemic on the Basel reforms
30. Graph 11 (i) examines Group 1 banks’ CET1 capital ratios across different regions over time and
demonstrates that the build-up in resilience has been a global phenomenon. Prior to the pandemic,
consistent improvement was seen across regions, with capital ratios increasing by 200–400 bp from 2014
to 2019. While some regions showed a modest decline in capital ratios during the Covid-19 pandemic,
capital levels are still well above those seen in the aftermath of the financial crisis.
31. Notably, capital levels in Europe continued to rise during the pandemic, in contrast to those in
many other jurisdictions. This could be due to a variety of factors, including the build-up of capital due to
payout restrictions, the reduced riskiness of portfolios due to loan guarantees, and differences in
accounting practices regarding loan-loss provisioning.
32. Leverage ratios have also markedly improved since the introduction of the Basel reforms. As
indicated in Graph 11 (ii), weighted-average leverage ratios for Group 1 banks improved by 100–200 bp
in all regions and remained robust throughout the first six months of the pandemic in most regions. It
should be noted that banks’ leverage ratios in some jurisdictions reflect exemptions put in place during
the pandemic to help reduce the bindingness of the leverage ratio requirement.
33. The steady increase in global banks’ LCR levels after 2013 was driven in part by European banks
(Graph 11 (iii)). More importantly, banks across all regions entered the pandemic with strong liquidity
positions, and further strengthened them during the crisis. Actions taken by many monetary authorities to
provide ample liquidity, combined with growth in deposits, may have helped banks maintain strong
liquidity positions during the pandemic.

Developments in CET1 ratios, leverage ratios and LCRs Graph 11

(i) CET1 ratios (ii) Leverage ratios (iii) Liquidity Coverage Ratios
 Per cent Per cent Per cent

Source: Basel Committee on Banking Supervision.

34. A detailed case study of the Mexican banking system (Annex 3) demonstrates the LCR’s
contribution to banks’ resilience. Following the implementation of the LCR in Mexico in 2015, Mexican
banks’ liquidity resilience increased significantly. A counterfactual analysis reveals that, had banks entered
the pandemic with the same liquidity profile that they had in 2014 (before Mexico implemented the LCR),
approximately a quarter of Mexican banks would have faced materially greater liquidity stress. Instead,
few Mexican banks faced liquidity demands that exceeded their holdings of high-quality liquid assets, and
those banks were able to meet these demands by using other available resources such as deposits at other
banks.
35. Market-based capital measures provide another perspective of the resilience of the banking
system (Graph 12 (i)). The market-based capital ratio (ie market value of common equity/(market value of
common equity + book value of total debt)) indicates that market-based measures of resilience remained
mostly unchanged and at a relatively low level between 2013 and 2019. This may reflect the downward
pressures on bank profitability arising from the prevailing low interest environment. While market-based

Early lessons from the Covid-19 pandemic on the Basel reforms 15
capital measures fell sharply with the onset of the pandemic, they have regained some of these losses
since authorities stepped in to provide fiscal and monetary support.
36. As shown in Graph 12 (ii), the distribution of market-based capital ratios shifted notably to the
left at the peak of the pandemic, before government support measures were introduced. Specifically, the
fraction of banks with a market-based capital ratio below 2% had risen sharply to 20% as of 31 March
2020, indicating concern among market participants. One interpretation of these movements is that
market-based capital measures may be more responsive to banks’ underlying health than regulatory
metrics. Another interpretation is that they indicate changes in investors’ risk preferences.

Market-based capital ratios Graph 12

(i) Evolution of market-based capital ratios (ii) Distribution of market-based capital ratios
 Per cent Per cent

 Note: MBCR = Market value of common equity/(Market value of common equity + Book value of total debt). Saudi Arabian (SA) banks are
 not included in the “Rest of World” category because their MBCR is significantly higher.
 Source: Thomson Reuters.

37. Notwithstanding the above, the global pandemic is not yet over, and the recent collapses of the
investment funds Archegos Capital Management and Greensill Capital, while not directly related to the
ongoing pandemic, raise the possibility that other losses may emerge in the financial system.
38. Examining whether the degree to which the Basel reforms have been implemented relates to
resilience metrics provides additional perspective on how the reforms have contributed to the overall
resilience of the global banking system. Here, one finds a weak positive relationship between the degree
of implementation and banks’ increase in CET1 capital from 2013 to 2019, indicating that the
implementation of the Basel reforms may have helped build resilience in the global banking system. 7 This
weaker-than-expected relationship may reflect the fact that some banks already had relatively high capital
levels, bolstered by the deleveraging that followed the GFC, when the Basel reforms were introduced.
Banks may also have responded to the announcement of the Basel reforms by raising capital ratios in
anticipation of the new standards before they were implemented, weakening any statistical relationship
between implementation and subsequent increases in capital.
39. With respect to liquidity metrics, LCRs are consistently high across jurisdictions regardless of their
implementation status. When examining changes between 2013 and 2019, banks in those jurisdictions
that started with low measures of liquidity typically experienced sharp improvements in their LCRs. This
indicates that the Basel reforms may have reduced differences in LCRs across jurisdictions and resulted in
a global banking system that is more resilient to liquidity shocks.

7
 See www.bis.org/bcbs/publ/d506.htm for the Eighteenth progress report on adoption of the Basel regulatory framework, which
 provides a summary measure of the degree to which various jurisdictions have implemented all or some of the Basel reforms.

16 Early lessons from the Covid-19 pandemic on the Basel reforms
2.2. Regulatory measures and resilience outcomes during the Covid-19 pandemic

40. As noted above, the banking system entered the pandemic with robust capital and liquidity levels,
bolstered by the Basel reforms. One can further examine the impact of these reforms by looking at the
relationship between regulatory measures and outcome measures of resilience. As no major internationally
active bank has thus far failed during the pandemic, this analysis uses banks’ CDS spreads as an outcome
measure of resilience.
41. CDS spreads are an imperfect measure of bank resilience because they can experience significant
volatility due to changes in market sentiment, which may not always reflect changes in specific banks’
resilience. Nevertheless, CDS spreads are one of several metrics that provide a market-based view of a
bank’s resilience that is not inextricably determined by regulatory requirements, and can thus help shed
light on the effects of regulatory requirements on bank resilience. If higher regulatory ratios signal greater
resilience, one would expect a negative relationship between regulatory ratios and CDS spreads.
42. A regression model is used to estimate the relationship between banks’ regulatory measures and
changes in CDS spreads during the pandemic. The primary regression model can be summarised by the
following equation, where i denotes individual banks:
 Δ ,2020 = + ,2019 + ,2019 + + .
43. Δ ,2020 is calculated as the difference in an individual bank’s CDS spreads between March/April
2020 and the end of 2019. Bank regulatory ratios at the end of 2019 ( ,2019 ), used as explanatory variables,
include the CET1 capital ratio, the leverage ratio and the LCR, considered individually or as a whole.
44. The regression includes the bank-specific control variables as of year-end 2019, reported in the
table below, as well as continent-specific fixed effects ( ) for: (i) Americas; (ii) Asia and Australia; and
(iii) Europe, Middle East and Africa.
45. The data on regulatory ratios for large internationally active banks are from S&P Market
Intelligence (SNL). The total sample comprises 83 banks located in Committee member jurisdictions for
which CDS spreads of sufficient quality are available and all three regulatory ratios (ie CET1 ratio, leverage
ratio and LCR) and control variables are available. All values of regulatory ratios are winsorised at the 5th
and 95th percentiles. All-in CET1 capital requirements and buffers (ie minimum Pillar I requirements,
regulatory buffers and Pillar II requirements) are available for a subsample of 60 banks from a survey that
was conducted by the Committee’s Task Force on Evaluations (TFE survey). 8 The relatively small sample
sizes limit the ability to draw definitive conclusions from the regression analysis.
46. The data source for bank CDS spreads is IHS Markit, and quoted five-year spreads at the senior
unsecured debt level are used. The analysis considers the average CDS spread value in March and April
2020 minus the average CDS spread value in Q4 2019 as the main dependent variable.
47. Table A2 in Annex 4 presents the descriptive statistics for the data used in the analysis (ie the
number of observations, the mean, the standard deviation, and the minimum and maximum values). All
continuous values are winsorised at the 5th and 95th percentiles.
48. The regression analysis focuses on the increase in CDS spreads that occurred in March/April 2020.
As shown in Graph 13, indices of bank CDS spreads rose quickly as the pandemic began and subsided
once authorities intervened with fiscal and monetary measures to alleviate financial market strain.

8
 See Annex 2 for further information on the TFE survey.

Early lessons from the Covid-19 pandemic on the Basel reforms 17
Development of CDS spreads for banks in Europe and North America in 2020 Graph 13
 Basis points

Source: IHS Markit.

49. Table 2 displays the results of the regression analysis. Specifications (1) through (3) each use one
of the three regulatory metrics as the explanatory variable, while Specification (4) combines them together.
The analysis controls for a number of other observables.

Regression specifications with the difference in CDS spreads between the average in
March and April 2020 and the average of the fourth quarter in 2019 as dependent
variable. Table 2
Specification (1) CET1 ratio (2) Leverage ratio (3) LCR (4) All
CET1 ratio -3.18* -4.49**
Leverage ratio -1.02 2.77
LCR 0.04 0.12
Size -5.64 -3.50 -2.78 -4.51
Return on assets 6.68 5.62 4.16 3.57
RWA to total assets 2.50 20.30 14.26 -19.53
Deposits to total assets -87.73*** -87.04*** -83.71*** -78.57***
Government ownership 27.84* 31.33* 31.62* 27.19
Sovereign CDS spreads 0.39** 0.41*** 0.41*** 0.38**
Adjusted R-squared 0.54 0.52 0.52 0.54

N 83 83 83 83
 Note: Continent fixed effects included in all regressions. Robust standard errors in all regressions. The symbols * , **, and *** denote
 statistical significance at 10%, 5% and 1%, respectively.
 Source: IHS Markit and BCBS calculations.

50. The negative and significant coefficients for the CET1 ratio in Specifications (1) and (4) indicate
that a higher CET1 ratio at the end of 2019 is associated with smaller changes in CDS spreads in response
to the pandemic. The coefficient is statistically significant at the 5% level in Specification (4). According to
Specification (4), a one standard deviation increase in the CET1 ratio (ie 2.6 pp) is associated with
approximately one quarter of a standard deviation (ie 12 bp) decrease in CDS spreads. This finding
indicates that banks with higher CET1 capital ratios showed greater resilience than those with lower ratios
early on in the pandemic.
51. The coefficients associated with the leverage ratio and the LCR are not statistically significant
across the various specifications. The leverage ratio’s lack of significance in Specification (4) is consistent

18 Early lessons from the Covid-19 pandemic on the Basel reforms
with the its design as a regulatory backstop. Unexpectedly, the LCR also appears not to have significantly
affected CDS spreads. This may reflect the fact that there were few instances of sustained liquidity pressure
at internationally active banks during the pandemic. 9 While a few banks experienced liquidity stress early
on in the crisis, this stress quickly subsided as authorities intervened to ease financial market strain. One
notable feature of the pandemic was the contrast between a resilient banking system and the strain put
on some non-bank financial institutions, as well as liquidity shortfalls in financial markets, as discussed in
Section 1.
52. With respect to the control variables, the results indicate that banks with a higher ratio of deposits
to total assets experienced significantly smaller increases in CDS spreads during the pandemic. This may
indicate that banks with more retail-oriented business models were less impacted by the pandemic than
banks with more capital markets-oriented business models. Banks located in jurisdictions where sovereign
CDS spreads rose more sharply in early 2020 showed significantly greater increases in CDS spreads during
the pandemic, indicating that the sovereign spread may capture broader macroeconomic and fiscal
difficulties. This result may also reflect a market perception that sovereign stress impacts banks.
53. Estimating the previous regressions using CET1 ratio requirements and buffers and the amount
of CET1 headroom (defined as a bank’s CET1 capital in excess of its minimum capital requirements and
buffers) as separate explanatory variables enables us to further understand the effect of bank capital on
resilience. The sample shrinks due to the lack of available data on capital requirements and buffers for all
of the banks. Furthermore, the data set does not include information on all aspects of Pillar 2 requirements
for all jurisdictions. Table 3 shows the regression results in this subsample, with the regressions including
the leverage ratio and LCR provided for completeness. The regression results in column (4) suggest that
the negative relationship between CDS spreads and the CET1 ratio is driven by the effect that CET1
headroom has. As before, the coefficients associated with the leverage ratio and the LCR are not
statistically significant in this subsample.

 Regression specifications with the difference in CDS spreads between the
 average in March and April 2020 and the average of Q4 2019 as dependent
 variable. Table 3
 Model (1) CET1 (2) Leverage ratio (3) LCR (4) All
 requirement and
 headroom
 CET1 requirement -0.11 -0.28
 CET1 headroom -1.96 -3.14**
 Leverage ratio 0.10 3.16
 LCR 0.12 0.12
 Size 0.83 2.66 3.63 1.35
 Return on assets -7.97 -8.94 -10.54 -12.08
 RWA to total assets 9.89 11.30 15.46 -5.71
 Deposits to total assets -38.21 -38.03* -36.84* -35.02
 Government ownership 8.74 10.38 10.27 7.51
 Sovereign CDS spreads 0.51*** 0.53*** 0.51*** 0.47***
 Adjusted R-squared 0.62 0.62 0.63 0.62
 N 60 60 60 60
 Note: Continent fixed effects included in all regressions. Robust standard errors in all regressions. The symbols * , **, and *** denote
 statistical significance at 10%, 5% and 1%, respectively.
 Source: IHS Markit and BCBS calculations.

9
 The fact that the LCR is disclosed with a lag in some jurisdictions may also have contributed to the lack of market reaction.

Early lessons from the Covid-19 pandemic on the Basel reforms 19
You can also read