Observing Reddit's Interaction Network - DUO
←
→
Page content transcription
If your browser does not render page correctly, please read the page content below
Observing Reddit’s Interaction
            Network
A stream-based approach for large scale
       Network Analysis on Reddit
                Andreas Huber

       Thesis submitted for the degree of
Master in Programming and System Architecture
                  60 credits

           Department of Informatics
  Faculty of mathematics and natural sciences

           UNIVERSITY OF OSLO

                   Spring 2021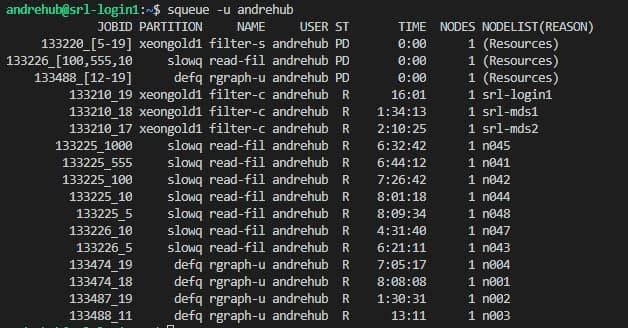
Observing Reddit’s Interaction
          Network

A stream-based approach for large scale
      Network Analysis on Reddit

             Andreas Huber
© 2021 Andreas Huber Observing Reddit’s Interaction Network http://www.duo.uio.no/ Printed: Reprosentralen, University of Oslo
Abstract

The area of misinformation is attracting considerable interest since the
2016 presidential elections in the United States of America [5] or when
conspiracy theories linked 5G with the coronavirus. Misinformation can
have drastic implications in the real world. Analyzing social media
data offers a way to detect where misinformation originates from and
how it spreads. The Understanding and Monitoring Digital Wildfires
(UMOD) project at Simula Research Laboratory focuses on monitoring
digital wildfires and developing improved prevention and preparedness
techniques to counteract misinformation. This work aims to add Reddit as
an additional data source to the UMOD project. We, therefore, demonstrate
how to build a massive graph between subreddits on Reddit from a parallel
streamed dataset. We, therefore, introduce the Reddit Dataset Stream
Pipeline (RDSP), a processing pipeline for the Reddit dataset based on
Akka Streams. We then show methods to create a graph between the
subreddits on Reddit and weigh them. We investigate the generated graphs
and present the experiments’ results, including a visualization of the graph.
This thesis provides the foundation for the UMOD project to investigate
further how misinformation spreads on Reddit.

                                      i
ii
Contents

I    Introduction                                                                            1

1    Introduction                                                                            3
     1.1 Problem definition . . . . . . . . . . . . . . . . . . . . . . . .                  4
     1.2 Contributions . . . . . . . . . . . . . . . . . . . . . . . . . . .                 5
     1.3 Outline of the Thesis . . . . . . . . . . . . . . . . . . . . . . .                 6

2    Background                                                                              9
     2.1 What is Reddit? . . . . . . . . . . . . . . . . . . . .        . . . . . .          9
     2.2 Why is Reddit relevant to detect misinformation?               . . . . . .         10
     2.3 Possible data sources . . . . . . . . . . . . . . . . .        . . . . . .         11
          2.3.1 Official Reddit API . . . . . . . . . . . . . .         . . . . . .         11
          2.3.2 The Pushshift Reddit Dataset . . . . . . . .            . . . . . .         11
          2.3.3 Pusher real-time Reddit API . . . . . . . .             . . . . . .         13
     2.4 Reddit data structure . . . . . . . . . . . . . . . . .        . . . . . .         13
          2.4.1 Pushshift data structure . . . . . . . . . . .          . . . . . .         14
          2.4.2 Exemplary graph structure . . . . . . . . .             . . . . . .         15
     2.5 Actor Model . . . . . . . . . . . . . . . . . . . . . .        . . . . . .         15
     2.6 Akka Streams . . . . . . . . . . . . . . . . . . . . .         . . . . . .         16
     2.7 JGraphT . . . . . . . . . . . . . . . . . . . . . . . .        . . . . . .         17
     2.8 Gephi . . . . . . . . . . . . . . . . . . . . . . . . . .      . . . . . .         19
     2.9 Gradle . . . . . . . . . . . . . . . . . . . . . . . . .       . . . . . .         20
     2.10 sbt . . . . . . . . . . . . . . . . . . . . . . . . . . . .   . . . . . .         21
     2.11 Named Pipes . . . . . . . . . . . . . . . . . . . . .         . . . . . .         21
     2.12 Experimental Infrastructure for Exploration of                Exascale
          Computing (eX³) . . . . . . . . . . . . . . . . . . .         . . . . . .         21
     2.13 Related work . . . . . . . . . . . . . . . . . . . . . .      . . . . . .         22

II    The project                                                                           23

3    Approach                                                                               25
     3.1 Understanding the Pushshift Reddit Dataset . . . . .               .   .   .   .   26
     3.2 Reddit Dataset Stream Pipeline . . . . . . . . . . . . .           .   .   .   .   28
         3.2.1 Statistics mode . . . . . . . . . . . . . . . . . .          .   .   .   .   30
         3.2.2 Passtrough mode . . . . . . . . . . . . . . . . .            .   .   .   .   31
         3.2.3 Streams Flow Implementation . . . . . . . . .                .   .   .   .   32
         3.2.4 Steps to get the data ready for the graph stage              .   .   .   .   32

                                          iii
3.3 Graph Building . . . . . . . . . . . . . . . . . . . . . . . . . . 33
3.3.1 Reddit Graph tool . . . . . . . . . . . . . . . . . . . . 34
3.3.2 Evolution of the graph creation . . . . . . . . . . . . . 35
3.4 Supporting Tools . . . . . . . . . . . . . . . . . . . . . . . . . 39
3.4.1 Scheduling with SLURM . . . . . . . . . . . . . . . . 39
3.4.2 Continuous Integration (CI) builds, tests, and auto-
matic updates . . . . . . . . . . . . . . . . . . . . . . . 41
4 Implementation 43
4.1 Reddit Dataset Stream Pipeline . . . . . . . . . . . . . . . . . 43
4.1.1 Command-line interface . . . . . . . . . . . . . . . . . 43
4.1.2 System setup . . . . . . . . . . . . . . . . . . . . . . . 44
4.1.3 Akka streams architecture . . . . . . . . . . . . . . . . 45
4.1.4 Pass-through mode . . . . . . . . . . . . . . . . . . . . 47
4.1.5 Statistics mode . . . . . . . . . . . . . . . . . . . . . . 50
4.1.6 Unit Tests . . . . . . . . . . . . . . . . . . . . . . . . . 53
4.2 Graph Building . . . . . . . . . . . . . . . . . . . . . . . . . . 55
4.2.1 Building the graph . . . . . . . . . . . . . . . . . . . . 55
4.2.2 Exporting the graph . . . . . . . . . . . . . . . . . . . 57
4.2.3 Technical details of loading the graph . . . . . . . . . 58
4.2.4 Command-line interface . . . . . . . . . . . . . . . . . 58
4.3 Python scripts . . . . . . . . . . . . . . . . . . . . . . . . . . . 59
4.4 Supporting Tools . . . . . . . . . . . . . . . . . . . . . . . . . 59
5 Experiments 61
5.1 Top n subreddits . . . . . . . . . . . . . . . . . . . . . . . . . . 61
5.1.1 Number of unique users in subreddits between 2005
and 2019 . . . . . . . . . . . . . . . . . . . . . . . . . . 62
5.1.2 Number of contributions in subreddits between 2005
and 2019 . . . . . . . . . . . . . . . . . . . . . . . . . . 62
5.2 Graph scores . . . . . . . . . . . . . . . . . . . . . . . . . . . . 65
5.2.1 Vertex scores . . . . . . . . . . . . . . . . . . . . . . . 65
5.2.2 Edge scores . . . . . . . . . . . . . . . . . . . . . . . . 66
5.3 Graph visualization . . . . . . . . . . . . . . . . . . . . . . . . 67
III Conclusion 73
6 Outlook 75
6.1 Challenges . . . . . . . . . . . . . . . . . . . . . . . . . . . . . 76
6.2 Limitations . . . . . . . . . . . . . . . . . . . . . . . . . . . . . 77
6.3 Future Work . . . . . . . . . . . . . . . . . . . . . . . . . . . . 77
ivList of Figures
2.1 Simplified class diagram of Reddit’s object model used for
the API. Only the relevant classes and properties are displayed. 14
2.2 Scheme of the proposed exemplary graph, illustrating the
different possible relationships between users, submissions,
subreddits and comments. . . . . . . . . . . . . . . . . . . . . 15
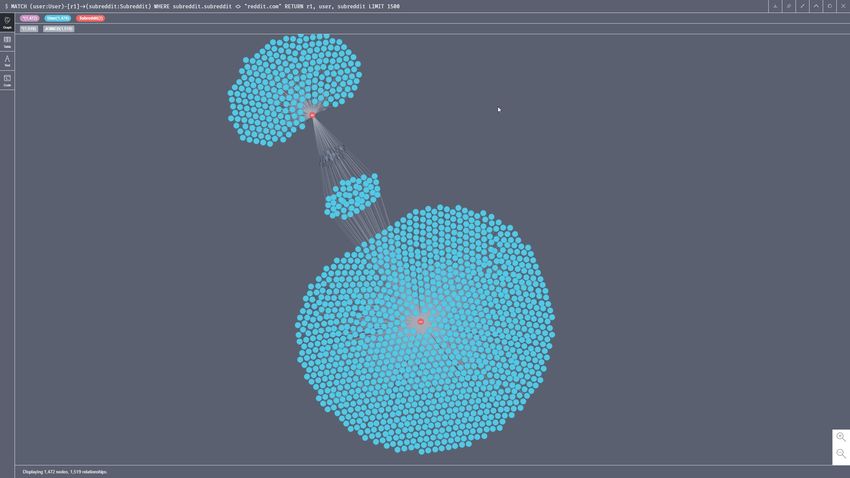
2.3 Sample graph displaying users (blue) that posted in subred-
dits (red). The cluster in the middle is composed of users
that posted in both subreddits. . . . . . . . . . . . . . . . . . 16
2.4 Illustration of an actor with a state and behaviour and the
message queue. . . . . . . . . . . . . . . . . . . . . . . . . . . 17
2.5 JGraphT class diagram that shows the core structure of the
library [26]. . . . . . . . . . . . . . . . . . . . . . . . . . . . . . 18
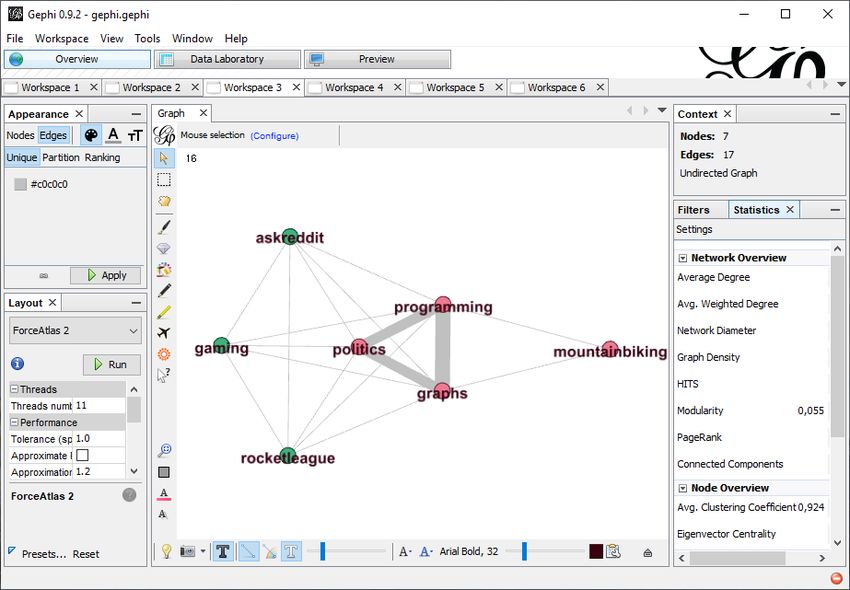
2.6 Gephi user interface. In the center of the user interface (UI)
is the graph. Currently, it shows a sample subreddit graph,
where the nodes are colored based on their modularity class.
The toolbar on the left holds the configurations for the graph
appearance and the layout algorithms. The right toolbar
shows the graph context and the panels to filter the graph
and execute statistics. . . . . . . . . . . . . . . . . . . . . . . . 20
3.1 Illustrates the necessary steps to generate the graph from the
dataset. The fist step is to use the Reddit Dataset Stream
Pipeline on the left for reading, prepossessing and filtering.
The second step to build the graphs with JGraphT and
calculate the scores. With those graphs we can perform
further experiments and build visualizations in step 3. . . . . 26
3.2 Architecture concept overview of the Reddit dataset stream
pipeline. . . . . . . . . . . . . . . . . . . . . . . . . . . . . . . 29
v3.3 Evolution of the weighting function. The first stage illus-
trates the simplest form of an undirected graph subreddit
graph. For every user that posted in two subreddits, an edge
is created. For a situation like the top 10000 subreddits with
many more users, this usually results in a fully connected
graph since it is likely that at least one user posted in two
subreddits. Therefore this is a first step towards building the
graph. In the next step, the edges are weighted by count-
ing the users that posted in the two subreddits an edge con-
nects. This provides us with a simple edge weight that gives
a first indication of which subreddits belong together. The
final weight function considers the importance of neighbors.
Once we filter out edges with low weights, we can visualize
a graph that indicates which subreddits belong together. . . 34
3.4 Creating a simple unweighted graph. Given the Comma-
separated values (CSV) list, which indicates which users
contributed in which subreddit at the left, we can create a
simple undirected graph. Andreas posted in the subreddits
fun and java, so we can create an edge between fun and java.
Daniel posted in java and berlin, so an edge between java
and berlin is created. Last haseeb posted in fun and berlin,
so we make an edge between fun and berlin. This results in
a simple graph without any edge weights taken into account
yet. . . . . . . . . . . . . . . . . . . . . . . . . . . . . . . . . . 36
3.5 From CSV to Hashmap to Graph. todo: extend description . 36
3.6 Unique subreddit combinations per user in matrix represen-
tation. . . . . . . . . . . . . . . . . . . . . . . . . . . . . . . . . 37
3.7 The four stages of building the graph. Graph rendered in
Gephi using the Force Atlas 2 layout algorithm [24] with
gravity set to 1 and scaling set to 50. Graph 3.7a shows the
graph without weights, which means the graph is layouted
only based on the number of edges each node has. Graph
3.7b uses the user count Uij as a weight, which results in a
graph that gets pulled close together. Graph 3.7c depicts the
same graph with the custom weight function. The groups of
nodes are more distinct than in the previous graph. Graph
3.7d shows the graph with the custom weights, but around
1/3 of the edges with low edge weights are filtered due to
their low importance. . . . . . . . . . . . . . . . . . . . . . . . 40
3.8 CI stages. The application is developed locally. Once a new
feature is ready, it is then pushed into a feature branch on
Github. On Github, the CI Build verifies that the code is
compilable and tests pass. If the CI build passes, the code can
be merged to the master branch. From there, the automatic
CI Build is started again, but this time the generated package
is uploaded to an Azure Blob Store. From there, it can be
downloaded to eX³ by the update script, which extracts and
overwrites the old version with the new one. . . . . . . . . . 41
vi4.1 Caption . . . . . . . . . . . . . . . . . . . . . . . . . . . . . . . 44
4.2 CPU usage in htop on 256 threads on two ThunderX2
CN9980 - Cavium 32 core ARM processors. Most of the 256
threads show a more than 90 % usage. We documented the
CPU usage during the "count users in subreddits" processing
at the beginning of the run. . . . . . . . . . . . . . . . . . . . 46
4.3 Graph 4.3a shows the concept of how the Akka Streams
Graph is built. More text describing the graph. The Data
flow diagram 4.3b illustrates how Akka Streams parallelize
the defined graph. More text describing the process. . . . . . 47
4.4 Graph 4.4a shows More text describing the graph. The Data
flow diagram 4.4b illustrates, how . More text describing the
process. . . . . . . . . . . . . . . . . . . . . . . . . . . . . . . . 49
4.5 Graph 4.5a shows More text describing the graph. The Data
flow diagram 4.5b illustrates, how . More text describing the
process. . . . . . . . . . . . . . . . . . . . . . . . . . . . . . . . 54
4.6 Example graph between the subreddits we get if we draw
an edge for every unique combination (AB, AC, BC) between
the subreddits A, B, C. . . . . . . . . . . . . . . . . . . . . . . 56
4.7 The SLURM queue on eX³. In the queue, there are Various
tasks to filter and build the graphs. Currently, we are
running the tasks on three different queues using a total of
14 nodes in parallel. The active tasks are for graph building,
filtering and creating subsets of the dataset. . . . . . . . . . . 60
5.1 Distribution of uniqe users per subreddit. TODO: Explain
numbers 1e8. Log scale . . . . . . . . . . . . . . . . . . . . . . 63
5.2 Distribution of user contributions per subreddit. TODO:
Explain numbers 1e8. Log scale. . . . . . . . . . . . . . . . . 64
5.3 Vertex list top 10k 2005-2019 basic metrics . . . . . . . . . . . 68
5.4 Edge list top 10k 2005-2019 basic metrics . . . . . . . . . . . . 69
5.5 The final graph of subreddit relations from Gephi for the top
1000 subreddits. . . . . . . . . . . . . . . . . . . . . . . . . . . 70
5.6 The final graph of subreddit relations from Gephi for the top
10000 subreddits. . . . . . . . . . . . . . . . . . . . . . . . . . 71
viiviii
List of Tables

 2.1   Size comparison between the compressed and extracted
       Reddit submissions and comments August 2019. . . . . . . .         12
 2.2   Dataset size estimation using the compressed sizes and the
       compression ratios from the August 2019 sample in Table 2.1.       12
 2.3   List of all possible full name prefixes the Reddit API uses. . .   13

 3.1   Pushshift submissions dataset description. Copied from the
       paper The Pushshift Reddit Dataset [4]. . . . . . . . . . . . .    27
 3.2   Pushshift comments dataset description. Copied from the
       paper The Pushshift Reddit Dataset [4]. . . . . . . . . . . . .    28

 5.1   Top 10 subreddits by unique users between 2005-2019 . . . .        64
 5.2   Top 10 subreddits by contributions between 2005-2019 . . .         65

                                   ix
x
Acknowledgments

I want to take this opportunity to thank the people who supported and
helped while shaping this thesis.

  First, I want to thank my supervisor Daniel Thilo Schröder for support-
ing me in defining the outline of this thesis and shaping this thesis, as
well as providing me his expertise in various fields, especially in graph
theory. Furthermore, I want to thank my supervisors Johannes Langguth
and Carsten Griwodz for their general support, counseling, critically read-
ing this thesis and many practical suggestions for improvements. I want to
thank all my supervisors for the time they spent in countless meetings and
the valuable insights they provided me.

  I want to thank the Simula Research Laboratory for providing me the
project and a place to work.

  The research presented in this paper has benefited from the Experimental
Infrastructure for Experimental Infrastructure for Exploration of Exascale
Computing (eX³), which is financially supported by the Research Council
of Norway under contract 270053.

  I am thankful to my fellow student Haseeb Rana, who spent his time at
the office with me and was always there to discuss new approaches.

  Finally, I want to thank my friends and family, especially my wife
Aleksandra, for her mental support and for making life more enjoyable.

                                    xi
xii
Part I

Introduction

     1
Chapter 1
Introduction
Fake news and misinformation are becoming a severe worldwide concern.
Harmful misinformation spread on social media can have drastic impli-
cations in the real world. In recent years the impact of missinformation
came into the discussion surrounding the 2016 presidential elections in
the United States of America [5] or when conspiracy theories linked 5G
with the coronavirus, which resulted in arson and vandalism against phone
masts in the United Kingdom [1].
Analyzing social media data offers a way to detect where misinformation
originates from and how it spreads.
The Understanding and Monitoring Digital Wildfires (UMOD) project
at the Simula Research Laboratory focuses on the monitoring of digital
wildfires and developing improved prevention and preparedness tech-
niques to counteract misinformation [25].
For understanding how misinformation spreads, it is crucial to obtain
data from various sources. The project previously focused on data collected
from Twitter and GDELT. The FACT framework provides capabilities to
capture and analyze Twitter graphs [43]. The introduction of Reddit as
an additional data source allows a different perspective on the world of
missinformation. In contrast to Twitter, it is easier to obtain textual content
from Reddit but harder to establish connections between individual users.
Reddit is organized in topical sub-communities. In Reddit’s terms, a
sub-community is called a subreddit. Those communities are primarily
user-generated and user-moderated and come in various sizes [45].
Subreddits are independent, meaning there is no direct connection to link
or group subreddits together. A user subscribing to a subreddit indicates
that the user has an interest in that topic. However, Reddit does not disclose
which users subscribe to which subreddits. What is visible is which users
commented or posted (contributed) in which subreddit by looking at all
posts and comments. We believe that these expressions of interest in
combination with the interaction in specific subreddits open the possibility
to observe missinformation in a “map of ideas”.
3Why is Reddit crucial? Reddit is a social news aggregator, where
information from all over the internet is aggregated and discussed in
decentralized topics. It is particularly relevant because the discussions on
Reddit are open and cover a huge number of topics with different opinions
from all around the world. Not having a character limit (unlike Twitter)
and the possibility to see a discussion tree also enable more profound
and richer conversations. Furthermore, like other social media platforms,
Reddit has been targeted by disinformation campaigns before [51].
Why Reddit over time? Misinformation does not appear out of nowhere.
Instead, it spreads over time before it becomes visible. To see how
misinformation spreads, and not only the finite state is relevant to track
the evolution of the spread. Therefore it is necessary to investigate the
previously mentioned “map of ideas” over time. Only then dynamics over
time will show how misinformation evolves, spreads, and might behave in
the future.
This thesis, therefore, aims to build a framework for massive temporal
Reddit graph analysis, which allows us to investigate the world of
subreddits from its beginning.
1.1 Problem definition
The topic of this thesis is the design of methods to process, create, and
understand Reddit graphs in order to be able to analyze the behavior of
Reddit over time. The research question of this thesis is:
Given a Reddit datastream, how to build a large-scale data processing
framework that allows examining Reddit’s interaction graph over
time?
We conceive this process as a triad involving data acquisition, massive
data analysis, and graph building. Whereby the latter includes the
development of a model for discovering and weighing the relationship
between subreddits. In the course of the process, we are faced with the
following challenges:
Massive Data On Reddit, information from all over the web is gathered
and discussed. Considering it claims to have 52 million daily users in
October 2020 [30] and according to the Alexa traffic rank the 19th most
popular website on the internet [38], we need to deal with one principal
problem: The dataset size is enormous, and working with this amount of
data is a challenge.
Graph Building Another problem is the data structure. Reddit is orga-
nized in topical communities called subreddits, and these communities are
independent. They do not have categories, neighbors and not relatable via
4the data structure itself. So there is no obvious way of grouping subreddits
together. In order to visualize and measure relationships between subred-
dits, a method to connect subreddits has to be developed. Then it could be
possible to find out which subreddits relate to and influence each other.
Graph size With a developed method, there is still the challenge that the
graph has to be built. With the high number of users on Reddit, it is to
be expected that the graph between subreddits is highly connected. The
number of edges in a fully connected undirected graph with n verticies is
n ( n −1)
2 . Storing the adjacency matrix thous takes O(n2 ) space. Memory
consumption and compute time are therefore a concern.
Temporal Graphs Considering a social network, it is interesting to
inspect changes in structure over time. Therefore the time dimension
should be considered while generating the graph. Theoretically, we could
generate a graph for every change, but this approach is not feasible given
the massive data problem. As a solution, we propose to create time slices of
the graph, giving us multiple views in time and the possibility to compare
them.
Prepare for streaming The UMOD project focuses on the monitoring of
digital wildfires and developing improved prevention and preparedness
techniques to counteract misinformation [25]. For the project to benefit
from the monitoring in its final stage, newer data than the one from
archived datasets is required. The created processing pipeline should be
built with the possibility of streaming in mind. It then can be extended
later so the archive dataset can be combined with live data from Reddit.
Processing streams can be more challenging than simple batch processing
because new data continuously arrives, and streams are not bounded in
size [48].
1.2 Contributions
This thesis consists of three parts. The first part focuses on the Reddit
Dataset Stream Pipeline (RDSP) and building a processing pipeline for
the Reddit dataset based on Akka Streams. The second part focuses on
developing methods to create a graph between subreddits on Reddit and
weigh them. The third part discusses the generated graphs and presents
experimental results on these graphs.
Reddit Dataset Stream Pipeline In order to tackle the problem of file
size, this thesis introduces an approach to read, extract, filter, analyze
and transform the Reddit dataset with Akka Streams in parallel. “Akka
Streams implements the Reactive Streams standard within the larger Akka
concurrency project.” [9] Reactive Streams are a way to provide highly
responsive applications that can handle multiple requests per second while
5also handling backpressure [10]. Since the resulting pipeline is stream-
based, it can be extended to function with live data in the future.
Graph Building Method Considering the independence of subreddits, a
method to overcome it by building a graph with edges between subreddits
from user contributions is shown. Furthermore, a weighting method that
takes the importance of neighbors into account is applied to those edges.
Paralell Score Calculation With expanding graph sizes, the time to
complete the computation of all scores on the graph single-threaded
consumes too much time - and therefore also blocks compute resources
for longer than necessary. Considering that it is necessary to test multiple
iterations of the algorithm and that the results have to be checked promptly,
a single-threaded calculation is not an option. Therefore the scores and
weight of edges and vertices are calculated in parallel over multiple
iterations to build the graph in a timely manner.
Graph Visualization Understanding if the created graph is meaningful
and resembles the landscape of Reddit, a visual representation is needed.
Therefore, this thesis shows a visual representation of the subreddit
landscape of the top 10.000 subreddits. To get a helpful visualization, edges
with low edge weights are filtered, and the graph layout is based on the
developed edge weight. This is necessary because otherwise, the rendered
graph would show more edges than one can comprehend.
Experiments and Distributions Furthermore, the thesis gathers and
discusses the distributions of the scores in the graph and provides a more
detailed overview of the landscape of Reddit.
Raw Graphs and Time Slices To make the results more accessible and to
make it possible for others to base their work upon these results, with this
thesis we release the graphs as DOT files and as edge and vertex CSV lists.
Further, pre-generated time slices from 2005 to 2019 are released as well -
even though the results are not discussed in this thesis. The time slices are
released as DOT files and as edge and vertex CSV lists.
Project Contribution This thesis is the first contribution to the UMOD
project concerning Reddit. It makes Reddit as a data source more accessible
and provides prepared graphs that can be further explored.
1.3 Outline of the Thesis
Chapter 2 provides a necessary overview on topics concerned in this
thesis. Starting from a quick overview about Reddit, why it is relevant,
and what the data structure looks like, to the Pushshift Reddit dataset that
acts as the main data source. The reader gets a quick introduction to Actors,
6Akka, and Akka Streams. Concerning the graph creation, the background
chapter provides a short overview of the java library JGraphT. Finally, the
chapter presents the eX³ platform 1 and the SLURM workload manager [50]
used to schedule work on eX³.
Chapter 3 illustrates the ideas and methods behind the developed
software. It mainly focuses on two parts—the dataset processing part
with the Reddit Dataset Stream Pipeline and the graph creation part.
The dataset processing part provides a short overview of operations and
transformations performed on the dataset and how parallelism is solved
with Akka streams. It also provides general insight on design choices
around the data flow within the actor system. The graph building stage
discusses how the data provided by the Reddit Dataset Stream Pipeline is
aggregated to build the first graph. Given the first graph, the approach
discusses multiple iterations of improving the graph model to finally get a
useful weighted graph representing the subreddit landscape of Reddit. The
last part discusses the tooling, like the slurm workload manager, to process
the datasets on multiple nodes in the eX³ cluster.
Chapter 4 describes the implementation process and gives deeper insight
on how to understand and use the programs. As in Chapter 3, the
implementation chapter focuses on mainly two parts - the Reddit Dataset
Stream Pipeline and the graph building. The Reddit Dataset Stream
Pipeline section discusses the whole feature set of the program and the
flow of data within Akka Streams in detail. Moreover, it explains all the
necessary steps to get the data ready for the graph creation phase. The
graph building section discusses building the graph with detailed insight
on important design choices during the implementations. Furthermore, the
technical details of exporting and loading the graphs section is elaborated.
Finally, the section explains how to use the command line interface of the
program.
Chapter 5 Based on the Reddit graph, this chapter discusses experiments
performed on the graph and our findings. We present basic statistics on
the top n subreddits. Further, we present metrics we calculate on the graph
and show our attempt at visualizing the graph.
Chapter 6 shows a perspective on how the gained knowledge and toolset
can be used and how it will integrate with the UMOD project. The outlook
chapter discusses future changes, proposes new changes, and where to go
from there. It primarily focuses on what steps have to be undergone to
create a system that supports live streaming. Finally, we conclude what
has been achieved and what potential there is for future improvement.
1 https://www.ex3.simula.no/
78
Chapter 2

Background

Chapter 2 is concerned with providing relevant base knowledge to get
a better understanding of this Thesis scope. In this chapter, first, we
illustrate what Reddit is, how it is structured and why it is relevant. We
present possible Reddit data sources and the Reddit data structure. We
then introduce utilized concepts, frameworks, and tools and discuss related
work.

2.1    What is Reddit?
Reddit is a social news site that aggregates a continuous flow of user-
submitted posts. According to Reddit’s CEO Steve Huffman, “Reddit is a
platform where users can discuss anything imaginable” [21]. The relevance
of a post or comment is determined by its age and how users rank the
post by voting it up or down. Reddit shows the most popular posts on its
homepage [49]. To better understand how Reddit works, it is essential to
discuss its building blocks first.

Subreddits. Reddit is comprised of thousands of primarily user-gener-
ated, and user-moderated topical sub-communities of various sizes. In
Reddit’s terms, a community is a so-called subreddit [45]. A subreddit is
identified by its unique URL in the scheme of /r/subredditname. The sub-
reddit Politics, for example, is accessible under the URL www.reddit.com/
r/politics. A subreddit and its discussions are usually open accessible to be
read by everyone that visits the site [2]. Still, there is the possibility to create
private subreddits [11], and some subreddits might be quarantined, which
hides them from new users [21]. Reddit reported more than 130.000 active
communities as of December 4, 2019. [20].

Posts. All registered users can submit posts to a subreddit whether they
subscribed to the corresponding subreddit or not. Users can post new
content as “self-posts” and links. Self-posts are text posts that are saved
to Reddit directly where link posts point to various external sources such
as articles, images, or videos [45].

                                         9
Comments. All registered users can comment on the initial post or in
reply to other comments. The result is a hierarchical discussion tree where
users answer to previous comments or create an entirely new comment in
answer to the post [45].
Voting. Posts and comments can be upvoted or downvoted by registered
users. Reddit uses a ranking function based on time and votes. Thereby
votes have a direct influence on the order in which Reddit displays the
posts on the page.
Karma. Users receive karma points when other users upvote their posts
or comments, and they lose karma points when they receive downvotes.
For example, if a user’s comment receives five upvotes and one downvote,
the user gains four karma points for the post. Reddit counts post karma and
comments karma independently. Users do not earn karma on self-posts.
Users with a large amount of karma are considered more active or valuable
members of the community. As a reward, users with a high amount of
karma are allowed to post more frequently [49]. The amount of karma a
user has earned can be seen by hovering over their username or accessing
their profile page [2].
2.2 Why is Reddit relevant to detect misinformation?
The objective of the thesis is to gather social network data from sources
other than Twitter and predict information spreading within this data.
Although further evaluation of data sources is part of the thesis, my
preparations have already shown that Reddit is a potential candidate for
a data source due to its open nature, easy to handle API, and the existence
of substantial historic datasets [4]. Furthermore, Reddit’s spreading data is
relatively easy to extract using existing libraries such as The Python Reddit
API Wrapper (PRAW) 1 compared to, e.g., Twitter spreading graphs which
require one to overcome massive technical obstacles.
Data from Reddit is relevant for research because “...it arguably enables
richer user interactions than other sites, such as Facebook and Twitter” [8].
Moreover, the conversations on Reddit are not restricted to one topic per
se. Due to its open API, the data is more accessible and not as limited as
the data that other social media sites provide through their API. Reddit also
claims to be bot and crawler friendly, as long as they do not exceed usage
limits or lie about their identity [37].
For the UMOD research project, Reddit is one of many possible data
sources. Undoubtedly the project can benefit from as many sources as
possible. Fortunately, Reddit itself aggregates various sources on a large
scale. It is relevant to see how misinformation spreads from and to multiple
sites to analyze how misinformation spreads. Since Reddit uses links, it
would be possible to link tweets to posts and vice versa across those two
1 PRAW: The Python Reddit API Wrapper https://praw.readthedocs.io.
10data sources and many more in the future. There is also the hypothesis that
some fake news stories or ideas might originate on Reddit. Furthermore,
many popular fake news stories will land on Reddit eventually.
2.3 Possible data sources
2.3.1 Official Reddit API
Reddit provides an extensive Rest API that allows developers to integrate
third-party applications with Reddit. Many pages on Reddit can also not
only be requested as an HTML page but also as JSON, XML, or RSS file,
by adding “.json”, “.xml” or “.rss” to the URL. If you wanted to view the
platforms newest posts from www.reddit.com/r/all/new/ in JSON format,
the modified URL would be www.reddit.com/r/all/new/.json.
Reddit has an API rate limitation of 60 requests per minute. How
many requests your application has remaining and when the time window
resets is provided via the “X-Ratelimit-Remaining” and “X-Ratelimit-
Reset" HTTP headers. API clients applications must also be authenticated
using OAuth2 and offer a unique User-Agent string. By requesting
multiple resources at a time, it is possible to increase the queried data by
a certain amount without circumventing the request limit. For example,
instead of requesting each submission at a time, we could request the 100
newest submissions by increasing the limit to 100 www.reddit.com/r/all/
new/.json?limit=100 [37]. But there is still a limit of how much data can
be requested. In this example, 100 results are the maximum number of
submissions the API returns.
Third-party clients for the Reddit API exist for various programming
languages [36]. The implementations and features vary from project to
project. PRAW for example, provides functionality to query the API but
also more intelligent features such as submission streams and automatic
rate limit handling.
The Reddit API provides all the desired data, but scraping all of Reddit
while respecting their limits does not seem to be feasible. Also, aggregating
and storing the results would undoubtedly require substantial resources.
2.3.2 The Pushshift Reddit Dataset
Pushshift is a five-year-old platform that collects Reddit data and exposes
it through an API. Compared to the Reddit API, the Pushshift API allows
researchers to query historic Reddit data more easily, including full-text
search against submissions and comments. They also provide a higher API
limits than Reddit [4]. There are three queryable API endpoints to obtain
information about subreddits, submissions, and comments:
• /reddit/subreddit/search
• /reddit/submission/search
• /reddit/comment/search
11Dataset Compressed Extracted Ratio
Submissions August 2019 6507 MB 68490 MB 1:10.53
Comments August 2019 16789 MB 186005 MB 1:11.7
Table 2.1: Size comparison between the compressed and extracted Reddit
submissions and comments August 2019.
Dataset Compressed Extracted
Submissions 200.03 GB 2.11 TB
Comments 653.96 GB 7.25 TB
Total 854.04 GB 9.35 TB
Table 2.2: Dataset size estimation using the compressed sizes and the
compression ratios from the August 2019 sample in Table 2.1.
The API provides extensive functionality to filter and search based on the
content and simply restrict the result ranges by ID or date. Because Reddit’s
IDs are sequential, this is a simple way to query, e.g., missing comment
ranges.
Compressed monthly archives. In addition to the searchable API, the
Pushshift Reddit dataset also provides its data as monthly dumps. The
dumps are available as compressed Newline Delimited JSON (NDJSON)
files, where each line represents an object (e.g., a single comment or an
individual submission). The archives are available under files.pushshift.io/
reddit. The compressed size is around 200 GB for all the submissions and
654 GB for the comments from June 2005 until September 2019. To estimate
the uncompressed size of the whole dataset, samples from the submissions
and comments were taken. Table 2.1 shows the sample’s compressed and
uncompressed sizes as well as the compression ratio. To estimate the
extracted size of all the dumps together, we took the compression ratios
from the sample above and applied them to summed up file sizes in Table
2.2.
This method is far from precise because it does not take the different
compression algorithms, content types, and file sizes into account, but it
provides a solid basis to understand the amount of data that we have to
deal with.
The advantage of these archives is that they are easy to obtain since no
rate limit or login is required. They are files, so we can store the archives
and read them by a magnitude faster than the Rest API. The disadvantages
are that the dumps are only created when the Pushshift team triggers the
export. Therefore the data available in the dumps can lag several months
behind. The Pushshift dumps also do not provide time-series information
– meaning they only offer one snapshot for every submission or comment
at the time that it has been crawled [35].
12Type prefix Data type
t1\_ Comment
t2\_ Account
t3\_ Link
t4\_ Message
t5\_ Subreddit
t6\_ Award
Table 2.3: List of all possible full name prefixes the Reddit API uses.
Pushshift Elastic Search API. Pushshift also provides access to the Elastic
Search API. Cloudflare currently blocks access to the API due to misuse. It
is possible to get whitelisted upon request [34].
2.3.3 Pusher real-time Reddit API
Pusher provides a commercial real-time API that lets you subscribe to a
subreddit and get notifications for new posts. In theory, this could provide
the data we need, but it does not seem practical to maintain a subscription
to each of the over 130.000 subreddits [33].
2.4 Reddit data structure
Every object in Reddit’s API is a thing. A thing is a universal base class that
has an ID, a kind that specifies the underlying data type and a full name.
A full name combines the kind of a thing (e.g. a comment) and the unique
ID to generate a compact, globally unique object ID on Reddit. Full names
have the scheme type_id, for example for a comment t1_1ac81d. Table 2.3
lists all the possible full name prefixes and their corresponding data types
[39].
Reddit IDs are regular ascending numeric IDs that are Base36 encoded.
The created interface simply provides a unified way to determine when
an entity has been created. Moreover, the votable interface provides com-
monly used properties for voting. The subreddit entity holds the details
about a subreddit. Most importantly, its unique URL /r/subredditname.
A link is the data type for a post. Based on whether the self text or link
field is filled, the post is a self-post or a link. The comment data type is
associated with a link via the link_id. Suppose the comment is a reply
to a parent post, then the parent_id points to the comment in response.
Therefore the parent_id allows hierarchical comments. Figure 2.1 shows a
simplified class diagram of Reddit’s object model.
13«interface» «interface» thing
votable created
+ id: String
+ down: int + created: long + kind: String
+ likes: bool + created_utc: long + name: String
+ ups: int
comment link subreddit message account
+ author: String + domain: string + accounts_active: int + author: String + comment_karma: int
+ body: String + score: int + description: String + body: String + id: String
+ link_id: String + selftext: String + display_name: String + name: String + link_karma: int
+ parent_id: String + sticked: bool + subscribers: long + parent_id: String + name: String
+ subreddit: String + subreddit: String + title: String
+ title: String + url: String 0..* 0..*
0..* + url: String
0..*
0..*
1..* 1..* 1..* 1..* 1..*
listing
+ after: String
+ before: String
Figure 2.1: Simplified class diagram of Reddit’s object model used for the
API. Only the relevant classes and properties are displayed.
2.4.1 Pushshift data structure
The dataset is split up into monthly dumps.
Submissions are stored as a flat list (one submission object per line).
The relationships to the author and subreddit entities can be generated by
matching the unique author name and the subreddit ID. If a submission is a
link, there might be additional metadata within the object (e.g., thumbnails
or HTML code to embed a youtube video).
The dataset organizes comments in a flat list (one comment object per
line); there is no hierarchy within the dataset. The recursive comment
structure has to be recreated by matching the ID with other comments
parent IDs as described in Chapter 2.4 as well with their subreddits.
Pushshift provides a single file containing all the users, including metadata,
and another one for all the subreddits with metadata. All the entities in the
dataset represent the state at the time they were scraped by the Pushshift
ingest script. Therefore each object contains a retrieved_on field – a Unix
timestamp with the time and date it was retrieved. The relationships
between the different entities must be recreated during processing or a
database import to get a relational data structure.
14JOINED Subreddit
User POSTED
Submission
COMMENTED
Comment COMMENTMADE
ISREPLYTO
Figure 2.2: Scheme of the proposed exemplary graph, illustrating the
different possible relationships between users, submissions, subreddits and
comments.
2.4.2 Exemplary graph structure
Figure 2.2 depicts an exemplary and partial graph scheme that visualizes
relationships between the most important entities. The graph model
describes which users JOINED which subreddit, which User POSTED a
submission, and which user posted a comment. It also associates in which
subreddit a submission or comment was posted and to which external
domain they link. This graph structure can be modified and extended
based on the needs of a specific experiment. Figure 2.3 shows a sample
of what evaluations we could do with the model. The red dots represent
subreddits, and the blue dots the users that posted into the subreddit. The
graph illustrates that the users in the central cluster were active in both
subreddits.
2.5 Actor Model
To support the current development workflows of developers writing for
concurrent and distributed systems, the Actor Model, defined in 1973
in a paper by Carl Hewitt, provides a higher abstraction level that lets
developers avoid complicated thread management and working with locks
to write concurrent and parallel systems. Ericsson has used the model to
build highly concurrent and reliable telecom systems and has benefited
immensely.
In computer science terms, actors are computational entities that encap-
sulate state and behavior and can additionally do the following units of
work, in no expected sequence, in response to the messages they receive
[23]:
• send a finite number of messages to other actors
15Figure 2.3: Sample graph displaying users (blue) that posted in subreddits
(red). The cluster in the middle is composed of users that posted in both
subreddits.
• create a finite number of new actors
• select behavior for next time a message is received
The model enables asynchronous communication by allowing each recipi-
ent of a message to be identified by a "mailing address," which can only be
obtained by the sender actor if it received it in a message or was the actor
that spawned the recipient. The actor system makes sure that each actor
processes a single message at a time. When the actor processes a message,
it can modify its state, switch to a new behavior for the following mes-
sage or send a message to another actor. Figure 2.4 illustrates this behavior
where the actors send messages to a recipient actor from whom they have
an address with no restriction on message arrival order.
In summary, the actor model is characterized by concurrency of compu-
tation within and among actors, dynamic creation of actors, actor addresses
in messages, and interaction only through direct asynchronous messages
[18] [17].
2.6 Akka Streams
Most of the popular services on the web require the streaming of data.
Typical examples are downloading Netflix movies or uploading youtube
content. Thus streaming data becomes necessary as most datasets are too
large to be processed as a whole. In order to spread these computations,
the datasets are broken down, fed sequentially, and processed, as streams,
through CPUs [22].
16Actor Mailbox /
Message Queue Actor
Actor
State
Behavior
Actor
Figure 2.4: Illustration of an actor with a state and behaviour and the
message queue.
Akka streams API offers an intuitive and secure way to create stream
processing setups that can efficiently execute and limit the usage of systems
resources. The API uses a feature called "back-pressure", a buffering
technique that slows down the producers if the consumers cannot keep up.
Back-pressure is a core characteristic of the "Reactive streams" initiative,
a standard for asynchronous stream processing with non-blocking back
pressure 2 .
Akka streams API and Reactive streams. Akka Streams API is decoupled
from the Reactive Streams interface specifications. Reactive streams
primary purpose is to provide interfaces that allow different streaming
implementations to interoperate and mechanisms to move data across
asynchronous boundaries without losses, buffering, or resource exhaustion
[22]. In contrast, Akka Streams API provides an end-user API that allows
the transformation of data streams by implementing the above-mentioned
Reactive Streams interfaces.
2.7 JGraphT
Over the last few decades, a wealth of large-scale societal, economic
network data has been collected and been available to different actors. At
the same time, the emergence of graph-theoretical problems in the fields
of network security, computational biology, chemistry, logistics, among
others, has been observed. Thus, there has been an increased interest in
mathematical graph analytical solutions that efficiently allow modeling,
analysis, and querying of large graphs. JgraphtT is a programming library
that does just that. The library is written in Java and consists of highly
efficient and generic graph data structures and algorithms implemented to
provide stability and performance while working with large-scale graphs.
2 Reactive Streams https://www.reactive-streams.org/
17Algorithms
1 «interface»
DjikstrasShortestPath Graph
PrimMST
...
Views
AsSubgraph
AbstractGraph Extends AsUnmodifiableGraph
AsUndirectedGraphs
...
«interface» Extends
GraphType Standard Graphs
SimpleGraph
PseudoGraph
AbstractBaseGraph Extends
MultiGraph
...
«interface»
IntrusicveEdgeSpecifics
«interface»
Specifics
DirectedSpecifics UndirectedSpecifics
Figure 2.5: JGraphT class diagram that shows the core structure of the
library [26].
One of JgraphT’s distinguishing features is that it allows users to use
custom objects as vertices and edges of a graph. The generic design
and versatility it provides make it easy to represent standard real-world
networks, such as social networks. Figure 2.5 shows the overall design
of the JgraphT library. The Graph interface is central to the library
and provides the necessary operations for construction and accessing the
elements of the graph. The interface receives two generic parameters
and , which can be any Java object, used as the vertices and
edges of the graph. A simple use case is "CampingSite" objects, where
each object contains information about the capacity and amenities of a
particular spot, used as vertices of a graph. Similarly, creating "Trail"
objects containing information about the route between two campsites,
such as trail type, length, trail condition, and other applicable properties,
adds to the versatility of the resulting graph. The library’s ability to
model any combination of objects as vertices and edges allows users to
express any relationship in a graph, increasing the versatility and making
its application endless.
Furthermore, the library is designed such that all interactions with the
graph happen only through the Graph interface, thus providing
a standard interface. All predefined classes implement the interface,
and the graph algorithms included in JgraphT expect an instance of
Graph to work. Commonly used graph types such as simple, multi,
18and pseudographs, where each graph can be undirected or directed and
weighted or unweighted, are included in the library for quick setup and
use. JgraphT also allows users to construct graphs using builder pattern
functionality, by which the library automatically chooses the most suitable
graph implementation from the user’s requirements.
Moreover, JgraphT provides built-in algorithms that can be run on
the graph. The library contains algorithms for various problems such
as connectivity, least common ancestor, cycles, shortest paths, node
centrality, spanning trees and spanners, recognizing graphs, matchings,
cuts and flows, isomorphism, coloring, cliques, vertex cover, and tours.
Furthermore, it comes with multiple graph generators, has the capability
to import and export graphs.
Thus, JgraphT is used in several commercial and scientific projects, one
notable example being Apache Cassandra [michail_jgraphtx2014java_2020].
2.8 Gephi
Gephi is an open-source software developed to provide interactive graph
exploration and network analysis capabilities to its users. These capabili-
ties facilitate the perceptual abilities of its users to identify peculiar network
features and improve the overall exploratory process by providing a com-
prehensive visual and tuneable toolbox. In order to achieve these goals, the
maintainers of Gephi, therefore, developed the software in separate, inter-
operable modules, with extensibility in mind. Furthermore, the software
has custom plugin support, allowing anyone to write custom filters and
layouts.
The user interface (UI) is designed around the real-time graph visualiza-
tion module while the exploration modules such as the layout algorithms,
data-filtering, annotation, clustering, and statistics surround it. The layout
took inspiration from editors like Adobe Photoshop, making it familiar to
new users, as illustrated in Figure 2.6.
The visualization module in Gephi uses a custom 3D rendering engine to
render networks in real-time and provides real-time data-filtering, layout
algorithms, clustering, and more. The 3D renderer uses the graphics card
to render the graphs, allowing the CPU to handle other computational
tasks such as layout algorithms and handling multiple Gephi projects
simultaneously. In addition, Gephi also has extensive functionality for
exporting graphs in different formats and customization of how the nodes,
edges, and labels should be colored and sized.
Finally, Gephi’s support for handling dynamic networks, where the
nodes and edges appear and disappear through time or change properties,
19Figure 2.6: Gephi user interface. In the center of the UI is the graph.
Currently, it shows a sample subreddit graph, where the nodes are colored
based on their modularity class. The toolbar on the left holds the
configurations for the graph appearance and the layout algorithms. The
right toolbar shows the graph context and the panels to filter the graph and
execute statistics.
is an essential and valuable feature. This feature allows network propaga-
tion, where new actors and relationships appear, to be visualized or, in the
case of a diffusion model, see how a rumor spreads across time [3].
2.9 Gradle
Modern-day software builds requirements exceed the much simpler
compiling and packaging requirements of the past. Today’s projects require
tools that incorporate multiple languages, various software stacks, and the
capacity to apply a range of testing strategies, and at the same time, support
early and frequent delivery of code into test and production environments
[28].
Gradle is JVM native build tool that has these capabilities and resembles
established tools like Maven and Ant. Gradle follows a build-by-
convention approach and allows declaratively modeling the problem
domain using a domain-specific language (DSL) implemented in Groovy.
Gradle is Java Virtual Machine (JVM) native, allowing one to write custom
build logic in either Java or Groovy. Gradle also includes a highly
configurable dependency management tool, allowing artifacts downloads
20from remote repositories. The dependency management is not restricted
to external sources; it supports the definition and organization of multi-
project build and modeling dependencies between projects [14].
Google uses Gradle as Android’s build tool since its design and model
allow extensibility and support for native C/C++ development and
expansion to other ecosystems. Gradle also performs twice as fast as
Maven in most build scenarios and has received consistent support from
IDEs, which has greatly improved usability and adaption [14].
2.10 sbt
sbt is an open-source build tool created for Scala and Java projects. It is
the build tool of choice for over 90 % of Scala developers as of 2019 [41].
Some of the main features of sbt are native support for compiling Scala
code, continuous compilation, testing, and deployment, support for mixed
Java/Scala projects, dependency management, and others. Other Scala-
specific abilities that sbt has, which are among the main reasons for its
wide adoption, is that sbt allows users to cross-build their project against
multiple Scala versions, incremental compilation, and the interactive
shell. Similar to Gradle, sbt has support for DSL used by writing build
description files in Scala [42].
2.11 Named Pipes
Standard pipes are a mechanism for Inter-process communication (IPC).
The output of a process/program can be "piped" as an input of another to
chain the processing; these pipes live temporarily in the kernel [23].
FIFO stands for first-in-first-out and is a queuing technique where the
oldest queued item or job is processed first. Unix named pipes, also known
as FIFO, use this concept to create files in secondary storage. Named pipes
contents reside inside the main memory and are not saved to the disk. For
the contents of a named pipe to be passed/processed, both the input and
output end needs to be in use. This capability allows named pipes to be
used in ways that standard files would not be efficient [16]. Named pipes
also require surprisingly little resources for writing to them.
2.12 Experimental Infrastructure for Exploration of
Exascale Computing (eX³)
The exponential and ever-increasing need for computing power for
scientific and commercial interests have sparked research and development
of technologies capable of performing billion billion (1018 ), also know
as exascale, floating-point operations per second. The high-performance
21computing (HPC) machines of the future will consist of sophisticated,
heterogeneous, tailored processing nodes of large scale, with deep memory
hierarchies and complex infrastructural topologies each targeted, for
example, a specific set of algorithms or machine learning techniques [27].
One such example is the eX³ project, a collaborative effort between Sim-
ula Research Laboratory and their partners to further the national resource
and prepare researchers for exascale computing in Norway. The ex3 infras-
tructure is not an exascale computer but allows researchers to experiment
with upcoming hardware and software-based HPC technologies [27].
Users of eX³ can choose to develop for and use different processing
nodes, each consisting of processors from various manufacturers with
either x86 or ARM architectures, and set them up with primary and
secondary storages in unique configurations. A specific example from the
eX³ cluster is the AMD EPYC nodes configured as dual processors with
2 TB DDR4 main memory and 2.8TB local NVMe scratch storage. Other
nodes, namely the Intel Xeon and ARM-based Cavium Thunder X2, are
similarly configured with varying local memory solutions. In addition to
local secondary storage hardware, all nodes in the cluster have access to a
500TB NetApp Enterprise hybrid, i.e., combined HDDs and SSDs, storage
unit set up through the BeeGFS parallel file system. This storage is intended
as a temporary place to collect results from large-scale experiments and
simulations [40].
Numerous ongoing projects using the eX³ cluster and multiple journals
and papers published amplify the usefulness and benefit to future research
of the project [32].
2.13 Related work
Baumgartner et al. [4] describe in their article “The Pushshift Reddit
Dataset” how they overcame technical barriers to collect and archive
social media data from Reddit and what Data and APIs they provide for
researchers.
Holec and Mack [19] discuss “How new scholars navigate research
on digital platforms while remaining grounded in traditional disciplines”
based on two cases on the Reddit platform.
Tsugawa and Niida [47] conclude that several social network features
have significant effects on the survival of communities. The social network
features they investigated do not have a substantial influence on the growth
rate.
Singer et al. [45] show how Reddit has grown and changed over time,
based on an earlier version of the Pushshift Reddit dataset.
22Part II
The project
23Chapter 3
Approach
The approach discusses the concept of how to build a graph between
subreddits on Reddit.
Constructing graphs with the size of Reddit is a challenge - The most
obvious reason why is because of the sheer size of the dataset (over
900 GB compressed). There are constraints in the available compute
resources like CPUs, Memory, and Storage. Then there is the data structure.
Reddit subreddits are independent topics. The dataset does not directly
indicate which subreddits are in relation to each other. A method of
identifying relationships between subreddits is required. However, just
building a graph would result in a huge graph, which most likely hides the
information we actually want to look at. So a method to weigh and filter
relationships between subreddits needs to be developed. A fundamental
challenge of building a comprehensive graph is to find a edge weighting
function that promises comprehensive results.
In order to tackle this task, the problems can be broken down into
manageable size steps. The results of each step can be directly piped into
one run, but to cut down on compute time, they also shall be saved to reuse.
Overall the processing pipeline can be divided into three stages and
programs, as illustrated in Figure 3.1. One to read and transform the
dataset and make it reusable for graph building and other projects. Another
one to create the graph, work with it—furthermore, the last one for
analyzing the graph and experiments.
In the first stage , a method to efficiently read the dataset needs to be
developed in order then to determine the top n subreddits. Knowing the
top n subreddit makes it possible to create subsets of the dataset containing
those subreddits. This will limit the number of subreddits and, therefore,
reduce the complexity and memory usage. This is ok because subreddits
with just a few contributors will not tell much about the overall structure
of Reddit. The focus is set on the top 10k subreddits. The CSV results will
be written to named pipes or zstandard compressed archives. To perform
experiments over time, yearly subsets will be created using the same steps
but filtered by each year.
25You can also read


