OPTIMIZATION ANALYSIS OF SECOND-LIFE BATTERIES INTEGRATION IN FAST-CHARGERS FOR ELECTRIC VEHICLES IN SPAIN - DIVA
←
→
Page content transcription
If your browser does not render page correctly, please read the page content below
Optimization analysis of second-life batteries
 integration in fast-chargers for electric
 vehicles in Spain

 Pasquale de Maio

 Master of Science Thesis
 KTH School of Industrial Engineering and Management
 Energy Technology EGI-2016-MSc
 Division of Energy and Climate Studies
 SE-100 44 STOCKHOLM
Master of Science Thesis
 EGI_ 2017_0100_MSC

 Optimization analysis of second-
 life batteries integration in fast-
 chargers for electric vehicles in
 Spain

 Pasquale de Maio
 Approved Examiner Supervisor

 2017-09-25 Semida Silveira Maria Xylia
 Commissioner Contact person

 SEAT, S.A Antonio Merino Rodriguez

 Abstract
This project investigates the viability of using reconditioned batteries, which have lost part of their original
capacity while powering electric vehicles (EVs), to minimize the expenses of fast-charging infrastructures
under the three charging scenarios where fast-charging mode is likely to be needed the most. The analysis
is conducted for the Spanish scenario and considers the retail electricity tariff that best suits the requirements
of a FCS. The economic analysis is performed on an annual basis and is tackled with an optimization
algorithm, formulated as a mixed-integer linear programming problem and run on MATLAB. The expected
lifetime of the ESS, being made of reused automotive cells, is estimated with a semi-empirical approach,
using an iterative process and implemented in MATLAB. A sensitivity analysis is conducted on three input
parameters that were identified to have a considerable impact on the system design and performance.
Overall, results show that with current figures energy storage integration in FCSs is viable as it effectively
reduces the infrastructure expenses in all scenarios. Peak-shaving is identified as the main source of cost
savings while demand shifting is not effective at all. The latter is further discussed in the sensitivity analysis
and some considerations are elaborated. The most profitable scenario for storage integration is the case of
a fast-charger located in a urban environment while, surprisingly, the lowest cost savings are obtained in the
highway case. The sensitivity analysis illustrates the impact and effects that electricity prices and specific cost
of both the power converter and the second-life batteries produce on the optimal system design. Moreover,
charging demand profiles are deeply analyzed and their main implications highlighted.

Keywords: fast-charging station, electric vehicle, energy storage system, second-life batteries, electricity tariff, Spain

 -II
-III
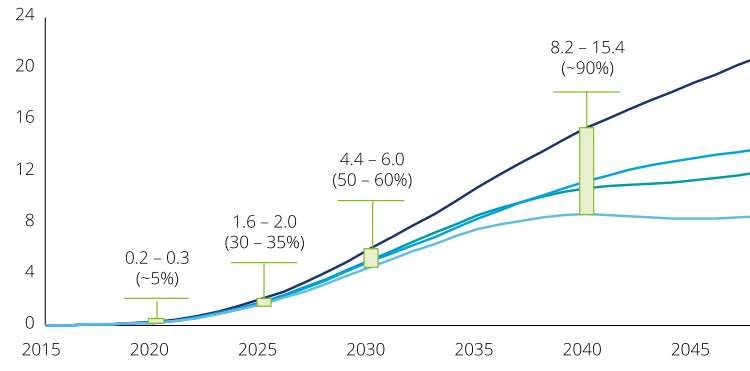
Table of Contents
Abstract ..........................................................................................................................................................................II
Table of Contents ....................................................................................................................................................... IV
List of Figures ............................................................................................................................................................. VI
List of Tables............................................................................................................................................................. VII
List of abbreviations ............................................................................................................................................... VIII
 Introduction .......................................................................................................................................................... 1
 1.1 Background information ............................................................................................................................ 1
 1.2 Motivation .................................................................................................................................................... 5
 1.3 Objectives ..................................................................................................................................................... 6
 1.4 Methods and analytical framework .......................................................................................................... 6
 Literature review ................................................................................................................................................... 9
 State-of-the-art technologies ............................................................................................................................14
 3.1 Plug-in electric vehicles ............................................................................................................................14
 3.2 EV charging station standard and classification...................................................................................15
 3.2.1 Plug-in charging ...............................................................................................................................16
 Energy storage technology................................................................................................................................18
 4.1.1 Energy storage applications ............................................................................................................18
 4.1.2 Energy storage classification ..........................................................................................................19
 4.1.3 Lithium-ion batteries .......................................................................................................................21
 Electricity market in Spain ................................................................................................................................23
 5.1 Regulatory framework ..............................................................................................................................23
 5.2 Market structure ........................................................................................................................................23
 5.3 Network access tariffs ..............................................................................................................................25
 5.3.1 Tariff 3.0 A........................................................................................................................................27
 5.3.2 Tariff 3.1 A........................................................................................................................................29
 5.3.3 Tariff 6.1 A........................................................................................................................................30
 5.4 A new market actor: “El gestor de carga” .................................................................................................31
 Optimization model ...........................................................................................................................................32
 6.1 System’s layout...........................................................................................................................................32
 6.2 Assumptions and limitations ...................................................................................................................35
 6.3 Mathematical formulation........................................................................................................................36
 6.3.1 Constraints ........................................................................................................................................39
 6.4 Battery degradation ...................................................................................................................................41
 Case study ............................................................................................................................................................45
 7.1 Identification of charging demand scenarios ........................................................................................45
 7.1.1 Urban .................................................................................................................................................46

 -IV
7.1.2 Highways ...........................................................................................................................................48
 7.1.3 Workplaces ........................................................................................................................................49
 7.1.4 Future scenarios ...............................................................................................................................50
 Simulations ..........................................................................................................................................................52
8.1 Input parameters .......................................................................................................................................52
8.2 Results .........................................................................................................................................................53
8.3 Sensitivity analysis .....................................................................................................................................62
 8.3.1 Specific cost of the power converter ............................................................................................62
 8.3.2 Battery price influence.....................................................................................................................65
 8.3.3 Electricity tariff investigation .........................................................................................................67
8.4 Results discussion......................................................................................................................................69
 Conclusions .........................................................................................................................................................73
9.1 Future research ..........................................................................................................................................75
 Bibliography ........................................................................................................................................................77
 Appendices ..........................................................................................................................................................82
11.1 Appendix I: Cell specifications ...............................................................................................................82
11.2 Appendix II: Power consumption profiles of three BEVs ................................................................82
11.3 Appendix III: Load profiles ....................................................................................................................83
11.4 Appendix IV: Characteristics of the inverter of the fast-charger ......................................................85

 -V
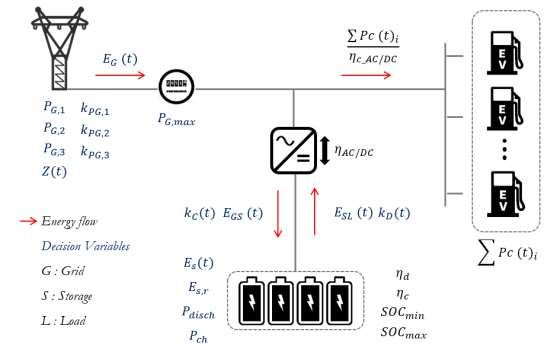
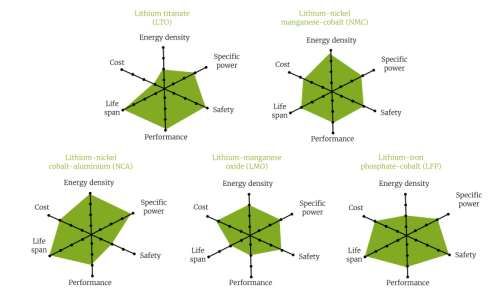
List of Figures
Figure 1 - Deployment scenarios of electric cars in the vehicle stock SOURCE: (International Energy
Agency, 2016b) .............................................................................................................................................................. 2
Figure 2 - EV sales and market share in a selection of countries and regions, 2015 Source: (International
Energy Agency, 2016b) ................................................................................................................................................ 3
Figure 3 - Evolution of battery energy density and cost Source: (International Energy Agency, 2016b) ....... 4
Figure 4 - Sunbatt project demonstrator at SEAT facilities in Martorell, Catalunya, Spain .............................. 5
Figure 5 – Visual representation of the implemented methodology with its main phases ................................ 6
Figure 6 – Left: Conventional AC bus distribution architecture. Right: Common DC bus distribution
architecture Source: (Bai, Du and Lukic, 2010) ......................................................................................................10
Figure 7 - Powertrain archetypes: Left: PHEV – Right: BEV .............................................................................15
Figure 8 - Classification of electrical energy storage system SOURCE: (IEC, 2011).......................................19
Figure 9 – Comparison of the five major Li-ion battery chemistries SOURCE: (Reid G.Julve, 2016) ........21
Figure 10 - Main activities of the electricity sector in Spaim ................................................................................24
Figure 11 – Schematic representation of the Spanish electricity sector structure SOURCE: (RED
ELECTRICA GROUP, 2014) ..................................................................................................................................24
Figure 12 – Overview of the Spanish electricity markets .....................................................................................25
Figure 13 –Electricity tariffs structure of the regulated market ...........................................................................25
Figure 14 – Reference architecture of the FCS with low voltage connection (Tariff 3.0A) ...........................33
Figure 15 – Left side of the green line: Adjusted electricity and capacity prices for winter; Right side of the
green line: Adjusted electricity and capacity prices for summer. .........................................................................35
Figure 16 – Energy flow diagram of the FCS .........................................................................................................37
Figure 17 – Visual representation of the iterative process for calculating the battery expected lifetime ......44
Figure 18 – Time of Day Use of a FCS in a urban environment ........................................................................48
Figure 19 – Time of Day Use of a FCS on highways ............................................................................................48
Figure 20 – Time of Day Use of a FCS located at a workplace ...........................................................................49
Figure 21 – Total number of EV in millions in Spain; in brackets electric vehicle sales as a percentage of
total sales .......................................................................................................................................................................50
Figure 22 – Case 1. Power flow diagram: The first half (00:00 – 24:00) corresponding to a typical winter day;
the second half (24:00 – 48:00) corresponding to a typical summer day ...........................................................55
Figure 23 – Case 2. Power flow diagram: The first half (00:00 – 24:00) corresponding to a typical winter day;
the second half (24:00 – 48:00) corresponding to a typical summer day. For legend, see Table 14 ..............57
Figure 24 – Case 3. Power flow diagram: The first half (00:00 – 24:00) corresponding to a typical winter day;
the second half (24:00 – 48:00) corresponding to a typical summer day. For legend, see Table 14 ..............58
Figure 25 – Case 4. Power flow diagram: The first half (00:00 – 24:00) corresponding to a typical winter day;
the second half (24:00 – 48:00) corresponding to a typical summer day. For legend, see Table 14 ..............59
Figure 26 – Case 5. Power flow diagram: The first half (00:00 – 24:00) corresponding to a typical winter day;
the second half (24:00 – 48:00) corresponding to a typical summer day. For legend, see Table 14 ..............60
Figure 27 – Case 6. Power flow diagram: The first half (00:00 – 24:00) corresponding to a typical winter day;
the second half (24:00 – 48:00) corresponding to a typical summer day ...........................................................61
Figure 28 – Power flow diagram obtained from simulating Case 1 with Conv.160 .........................................63
Figure 29 – Power flow diagram obtained from simulating Case 2 with Conv.160 .........................................65
Figure 30 – Power flow diagram obtained from simulating Case 2 with Batt.50 .............................................67
Figure 31 – Active power consumption profiles of three popular BEVs ..........................................................82
Figure 32 – Two-day load profile of a FCS located in a urban environment ....................................................83
Figure 33 – Two-day load profile of a FCS located on highways........................................................................83
Figure 34 – Two-day load profile of a FCS located at a workplace ....................................................................83
Figure 35 – Two-day load profile of a FCS located in a urban environment (FUTURE SCENARIO) ......84
Figure 36 – Two-day load profile of a FCS located on highways (FUTURE SCENARIO) ..........................84
Figure 37 – Two-day load profile of a FCS located at a workplace (FUTURE SCENARIO).......................84

 -VI
Figure 38 – Real measurement of the input DC power and the output AC power of the inverter of the fast-
charger ...........................................................................................................................................................................85

The image on the thesis’ cover was taken from (IRENA, 2017)

 List of Tables
Table 1 - Electric vehicle powertrain portfolio ......................................................................................................14
Table 2 – Charging mode specifications ..................................................................................................................16
Table 3 – Network access tariffs ...............................................................................................................................26
Table 4 – Energy and capacity charges of tariff 3.0A ............................................................................................27
Table 5 – Periods distribution during the two electric seasons ...........................................................................27
Table 6 – ENDESA possible tariff designs SOURCE: (ENDESA, 2017) .......................................................28
Table 7 – Iberdrola tariff design SOURCE: (IBERDROLA, 2017) ...................................................................28
Table 8 – SomEnergia tariff design SOURCE: (Som Energia, 2017b) ..............................................................29
Table 9 - Grid connection costs................................................................................................................................29
Table 10 – Energy and capacity charges for tariff 3.1A ........................................................................................29
Table 11 – Billing periods distribution of tariff 3.1A ............................................................................................29
Table 12 – Endesa tariff 3.1A design .......................................................................................................................30
Table 13 – Energy and capacity charges for tariff 6.1 A .......................................................................................30
Table 14 – Billing periods distribution along the year of tariff 6.1A ..................................................................31
Table 15 – List of the decision variables .................................................................................................................38
Table 16 – Summary of the system parameters ......................................................................................................38
Table 17 – Main characteristics of the BEVs and the related fast charge of their batteries ...........................46
Table 18 – Utilization of a fast-charger in Barcelona SOURCE: (Evectra mobility services, 2016) .............47
Table 19 – Energy needs of the FCS in a urban environment.............................................................................47
Table 20 – Energy needs of the FCS on highways ................................................................................................49
Table 21 – Energy needs of the FCS at a workplace .............................................................................................49
Table 22 – Initialized parameters to the mathematical model .............................................................................52
Table 23 – Abbreviations of load profiles and of some design parameters.......................................................53
Table 24 – Main results from the simulation of Case 1 ........................................................................................54
Table 25 – Main results from the simulation of Case 2 ........................................................................................56
Table 26 – Main results from the simulation of Case 3 ........................................................................................57
Table 27 – Main results from the simulation of Case 4 ........................................................................................58
Table 28 – Main results from the simulation of Case 5 ........................................................................................60
Table 29 – Main results from the simulation of Case 6 .......................................................................................61
Table 30 – Main results obtained from the sensitivity analysis done on the specific cost of the power
converter: Case 1 under Conv.160 and Conv.330 .................................................................................................62
Table 31 - Main results obtained from the sensitivity analysis done on the specific cost of the power
converter: Case 1 under Conv.160 and Conv.330 .................................................................................................64
Table 32 – Main results obtained from simulating Case 2, Case 3 and Case 4 with Batt.100 and Batt.50. ..66
Table 33 – Capacity charges of the analyzed tariff and their related share over the total ...............................68
Table 34 – Electricity prices of the analyzed tariff design and potential related savings under demand shift
........................................................................................................................................................................................68
Table 35 – Electricity prices of the new tariff design and potential related savings under demand shift .....68
Table 36 – Main design parameters obtained by simulating Case 1, Case 4 and Case 5 with the new electricity
prices..............................................................................................................................................................................69
Table 37 – Main cost parameters obtained by simulating Case 1, Case 4 and Case 5 with the new electricity
prices..............................................................................................................................................................................69
Table 38 – Cell and module specifications ..............................................................................................................82

 -VII
List of abbreviations
2DS Two-Degrees Scenario
AC Alternating Current
BEV Battery Electric Vehicle
CAES Compressed Air Energy Storage
CCS Combined Charging System
Chademo Charge de Move
CO2 Carbon Dioxide
COP21 21st Conference of the Parties
DC Direct Current
DOD Depth of Discharge
DSO Distribution System Operator
ESS Energy Storage System
ETP Energy Technology Perspectives
EU European Union
EV Electric Vehicle
EVSE Electric Vehicle Supply Equipment
FCS Fast Charging Station
GHG Greenhouse Gas
HC Hydrocarbons
ICE Internal Combustion Engine
IEA International Energy Agency
Li-ion Lithium-Ion
LP Linear Programming
MILP Mixed-Integer Linear Programming
NOx Nitrogen Oxides
PHEV Plug-in Hybrid Electric Vehicle
PHS Pumped Hydro Storage
PV Photovoltaic
PM Particulate Matter
RDE Real Driving Emission
TSO Transmission System Operator
USD United State Dollar

 -VIII
VOC Volatile Organic Compounds
WHO World Health Organization
kWh Kilowatts-hour

 -IX
Master of Science Thesis
KTH School of Industrial Engineering and Management
 Energy Technology EGI-2016-MSc
 Division of Energy and Climate Studies
 SE-100 44 STOCKHOLM
Introduction

 This chapter offers a panorama of the major environmental issues the transport sector is responsible
 for and continues with a description of the motivations that have brought electric vehicles back into the
 spotlight. The reader is then introduced to the main barriers currently limiting a large deployment of
 electricity-powered vehicles and is provided with an overview of the most relevant initiatives
 implemented to overcome them. The last part of this chapter intends to explain the motivations behind
 the development of this project and clarifies the questions the author aims at answering. The chapter
 ends with the description of the methodology implemented to investigate the research topic.

1.1 Background information
A distinctive feature of our civilization today is doubtless the spread use of mechanical power. For long
time, man’s muscles, trained animals, wind and running streams represented the primary sources of power
before the invention of the engine, a machine capable of converting one form of energy to another. In
particular, in transport on land, sea and air, the internal combustion engine (ICE) has been the dominating
technology thanks to its capability to convert the thermal energy released by the combustion of a fuel into
mechanical power (Sierzchula et al., 2012) (McGraw, 2012). This has not been always true, though. In fact,
during the early stages of the automobile development, ICE vehicles competed with electric powered cars
in the race for dominance. During the 1900’s, some of the most famous scientists and innovators such as
Ferdinand Porsche, Tomas Edison and Henry Ford strongly supported the concept of electric-motion and
worked to build a competitive electric vehicle. However, ICE vehicles finally imposed thanks mainly to their
lower cost and to the abundance of gasoline (Matulka, 2014) (Sierzchula et al., 2012).
What made the ICE a success at that time is today its major drawback. In fact, these devices use the energy
contained into a fuel that, through a thermo-chemical reaction with an oxidizer (typically air), produces high-
pressure products that are expanded through a piston or a turbine to produce the desired propulsion force.
However, this chemical process commonly called “combustion” also produces air pollutants such as carbon
monoxide (CO), volatile organic compounds (VOCs), hydrocarbons (HCs), nitrogen oxides (NOx) and
particulate matter (PM), contained in the exhaust gases and considered harmful for human health
(Nederhoff, 2009).
Transport is of vital importance in our society and represents the backbone of our economies. It stimulates
growth and employment and connects people, cities, countries and economies all around the world
(Alexander and Gartner, 2012a). However, due to its polluting nature, it is also responsible for damaging
the environment, the human health and the climate. In the last decades, while all the major economic sectors
have managed to reduce the greenhouse gases (GHG) emissions, those produced by the transport sector
have increased. GHG emissions from road vehicles are 17% higher respect to the 1990 level, while the
contribution of the transport sector to the total European GHG emissions has increased from 13% in 1990
to almost 20% in 2014 (Alexander and Gartner, 2012a).
Despite the technology has experienced major improvements achieving significant reduction in the amount
of (GHG) emissions (Alexander and Gartner, 2012a), the transport sector is still responsible for around
23% of global energy-related GHG emissions (International Energy Agency, 2016). Emissions from road
transport sector are particularly harmful for human health since vehicles are intensively driven in very
populated regions, releasing the air pollutants at ground level and consequently leading to inhabitants
suffering the most from their related harmful effects. In many European cities, the air quality standards set
by the European Union (EU) and the World Health Organization (WHO) are often not met due mainly to

 -1
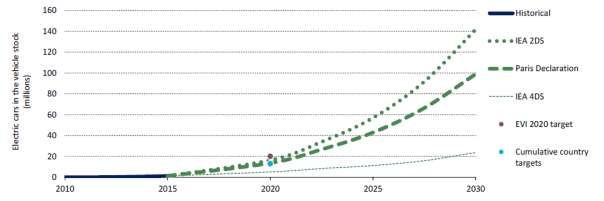
emissions from road vehicles (European Environment Agency, 2016). According to the 2DS1 of the IEA
Energy Technology Perspectives (ETP) series setting the targets of GHG emission reduction, the urgent
need to respond to the threat of climate change requires the transport sector to evolve and to reduce its
environmental footprint. In fact, in order to limit the temperature increase to 2°C, the IEA 2DS indicates
that the emissions from the transport sector should contribute to about one-fifth of the total energy-related
GHG emissions reduction in 2050 (International Energy Agency, 2016b).
In this context, electric vehicles2 (EVs) have appeared again on the spotlight. They have proven themselves
to be a valid alternative to conventional vehicles running on polluting engines and to be able to offer a low
or zero-emission mean of transport while satisfying the needs of the users (Falvo et al., 2014). According to
the ambitious emissions reduction targets described in the IEA ETP, limiting the temperature increase to
2 °C requires the stock of EVs to reach 150 million (10% of the total) by 2030, as depicted in Figure 1, and
nearly 1 billion by 2050 (International Energy Agency, 2016b). Despite the market of EV has experienced
a massive boost during recent years, there are still several barriers impeding such technology to express its
full potential. Moreover, the extent to which a widespread use of EVs will contribute to reducing emissions
significantly depends on where the electricity required to recharge their batteries is produced from - e.g.
renewables, fossil fuels, or nuclear (Alexander and Gartner, 2012a). It is estimated that net CO2 savings will
only be possible in countries with an emission intensity of the electricity mix below 700 grams of CO 2 per
kilowatt-hour (700 g of CO2/kWh) (International Energy Agency, 2016b).

 Figure 1 - Deployment scenarios of electric cars in the vehicle stock
 SOURCE: (International Energy Agency, 2016b)

The importance of removing the barriers to electrification of the transport system is reflected by the several
“market pull” policies put in place during recent years. Regulatory measures including fuel economy
standards and tailpipe emissions regulations as well as financial levelers such as differentiated vehicle
taxation have been implemented in different countries for favoring EVs penetration (International Energy
Agency, 2016b). In Europe, the strategy for improving fuel economy of cars sold into the European market
is gradually forcing the automotive industry to change the nature of the vehicles, imposing stricter and
stricter mandatory emissions reduction targets. From 2015 onwards, all new cars must comply with the 130
grams of CO2 per kilometer (130 g of CO2/km) emission limit; a limit that will drop to a maximum of 95
g of CO2/ km by 2021. Automakers whose fleet’s average CO2 emissions exceeds the limit value in a given
year have to pay an excess emissions premium for each car registered (European Commission, 2016).
The first emission standards were implemented in California in 1960 and were a consequence of the elevated
air pollution levels produced mainly by road vehicles, making it necessary for the United States to limit
emissions in urban areas. Since then, regulatory programs for tailpipe emissions as well as low-sulfur fuel

1 2DS = 2°C scenario: It represents the most optimistic scenario where the emission trajectory of the energy system
leads to a 50% chance of limiting average global temperature growth to 2°C.
2 Generally, the “electric vehicle” category includes Battery Electric, Plug-in Hybrid Electric and Fuel Cell Electric

Vehicles (BEVs, PHEVs and FCEVs). However, for the scope of this report, the EVs category will only include BEVs
and PHEVs.

 -2
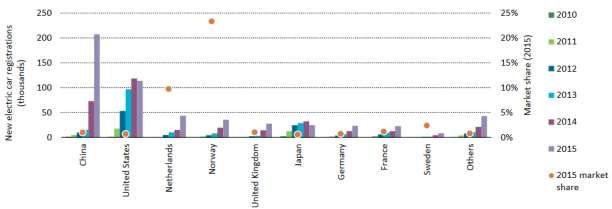
requirements have been developed in many countries all around the world (International Energy Agency,
2016b).
At European level, the “Euro 6” standard for light-duty vehicles (cars and vans) currently regulates
emissions of PM, NOx, HC, CO and CO2. The regulation has been generally successful in limiting exhaust
emissions from road transport in cities and urban agglomerations but seems to have failed in reducing NOx
emissions. In fact, a significant discrepancy has been identified between NOx emissions measured with
laboratory tests (especially for diesel vehicles) and in real-life driving conditions. As a matter of fact,
transport sector was responsible for 46% of total NOx emission in the European Union in 2013. To deal
with this issue, a Real Driving Emissions test procedure (RDE) will enter in force on September 2017 with
the aim of better reflecting the actual emission on road (European Commission, 2016). What led the
European Commission to introduce a stricter and more precise test procedure lies mainly on the effect that
NOx have at environmental level. In terms of Global Warming Potential3 (GWP), NOx are around 300
times more polluting than CO2 (U.S. Environmental Protection Agency, 2002), are toxic for human health
and can lead to the formation of particulate matter and ozone (International Energy Agency, 2016a).
At the same time, governments are complementary stimulating the spread of EVs with various financial
support mechanisms. According to (Nemry and Brons, 2011), purchase incentives have been identified to
be the most effective instrument for promoting electric car sales in the United States. At national level,
buyers of EVs can benefit from tax credits capped at 7.500 USD for BEVs and 4.000 USD for PHEVs.
Moreover, other types of financial incentives are available regionally. As shown in Figure 2, in 2015, the
largest market for EVs was China overtaking the US with 200.000 new registrations. In the same year,
Norway reached the highest market shares for electric cars globally (23%) and showed the best policy
framework in terms of financial support with a purchase tax exemption reaching 12.000 USD. In addition,
BEVs are also exempt from paying the value-added tax (VAT) set to 25% of the vehicle price before tax
(International Energy Agency, 2016b).

 Figure 2 - EV sales and market share in a selection of countries and regions, 2015
 Source: (International Energy Agency, 2016b)

Although there are many different ways to store electricity, nowadays, the tendency is to use lithium-ion (Li-
ion) batteries as energy storage system (ESS) in EVs. Similarly to what stopped the adoption of EVs back
in in the 1990’s, the primary issue limiting a large deployment of EVs today is the trade-off between battery
performance (lifespan and driving range) and price (Sierzchula et al., 2012).
With the launch of the first models of BEVs, what discouraged users from buying electric cars was the high
vehicle cost and the so-called “range anxiety”, issues that can be both attributed to the high cost of the ESS.
Thanks to “Technology push” actions including technology learning, direct research, development and
demonstration (RD&D) and mass production, battery cost dropped from around 1.000 USD/kWh in 2008

3 It is defined as the cumulative radiative forcing - both direct and indirect effects - integrated over a period of time
from the emission of a unit mass of gas relative to CO2

 -3
to around 268 USD/kWh in 2015 corresponding to a 73% reduction in 7 years (International Energy
Agency, 2016b). The other issue was related to the distance a BEV could drive before requiring a recharge,
which was considered too short for most drivers (Knutsen, 2013). Recent improvements in battery energy
density, which went from around 60 Wh/L in 2008 to 295 Wh/L in 2015 representing a 400% increase (see
Figure 3), seem to have alleviated the range anxiety issue; however, there still exist another one: the “charging
anxiety”. The expression commonly refers to the lack of charging infrastructure and to the fear of not
finding a charging spot when needed. In addition, most of the existing infrastructures require quite long
time to add consistent additional range to the EV battery. From a technological perspective, currently very
few batteries can support high voltages when recharging - e.g. most EV batteries have a rated voltage of 350
V (Hydro Quebec, 2015), limiting the charging power and making the charging process consequently much
longer than a conventional refueling of a petrol or diesel engine car.

 Figure 3 - Evolution of battery energy density and cost
 Source: (International Energy Agency, 2016b)

When a battery reaches its end of life, it does not necessarily mean that it can no longer be used. The loss
of performance of batteries (also called “aging process”) has two origins: one is related to the use (the cycle
fade) and another happening with time (calendar fade). Both effects degrade the battery as result of internal
resistance increase, leading to higher energy losses, lower energy efficiency and reduced peak power, and
loss of usable capacity (Julien et al., 2016). Since these phenomena affect the performance of the EV itself
and car manufacturers prefer to give a good image rather than a mediocre experience to their clients, it is
generally recognized that EVs batteries should be retired when they have reached approximately 70-80% of
their initial state of health (SOH), corresponding to the end of the battery 1st life and the beginning of its
2nd (Saez-de-Ibarra et al., 2015) (Cready et al., 2003). Therefore, while they are not suitable for electro-
mobility applications anymore, they can still work in less-demanding applications where energy and power
density are not as critical as in motion applications (Cready et al., 2003). What was considered as a product
at its disposal stage can actually become a business opportunity. For this reason, different automakers are
showing interest in the topic since these batteries could still have a residual value and could represent an
unexpected source of revenues. Of particular interest is the pilot project SUNBATT (see Figure 4)
(Movilidad Electrica, 2016) launched in 2016 by SEAT where 4 PHEV batteries contained into a 15 m2
maritime container are integrated into a micro-grid, also composed of PV panels, grid connection and EV
chargers.

 -4
Figure 4 - Sunbatt project demonstrator at SEAT facilities in Martorell, Catalunya, Spain

At domestic level, Renault has recently signed up an agreement with the British company Powervault where,
during the one-year project, the French car manufacturers will supply 50 rehabilitated batteries that will be
installed together with PV panels in households’ homes (Movilidad Electrica, 2017). Of totally different
nature and size is the project announced by the group Renualt-Nissan in which reused batteries will be used
to build one of the largest ESS aiming at giving support to the power grid (Noya, 2017b). Beyond a purely
economic perspective, giving automotive batteries a second-life brings along indirect benefits since, being a
valid alternative to other ESS, their reuse would mitigate the batteries’ environmental footprint (Martinez-
Laserna et al., 2017). In addition, an extra revenue stream coming from the reuse of automotive batteries
can help to reduce the price of the EV itself making it more attractive and competitive respect to its direct
competitor.
Many projects and studies investigating if and how reused batteries can serve other purposes at the end of
their 1st life have been done so far. The topic can be analyzed from different perspectives including how
batteries degrade after their 1st life, what second-life application would allow obtaining the highest benefits
in terms of both economic and environmental terms, and what business models automakers should embrace
in order to make the concept of battery second-life feasible and sustainable.

1.2 Motivation
An adequately designed infrastructure of fast-chargers is indispensable factor for quick EV acceptance in
the society. With current EV market penetration level, private fast-charging stations are not considered
profitable businesses due to the high cost of the charger itself, to the characteristics of its operation and to
the scarce charging request (Noya, 2017a) (CIRCE, 2015). From here arises the need to minimize the
expenses of such infrastructures in order to stimulate their deployment by both private and public entities.
The introduction of an energy storage system has the potential to reduce the operational costs of fast-
chargers by both enabling the system to carry out a cost-effective energy management responding to
electricity price variations and to reduce the peak power demand without affecting the reliability of their
operation. Moreover, such control strategy is also beneficial for the power distribution network since the
increase of power demand would be mitigated. Lithium-ion battery appears to be the most promising
technology; however, its high specific cost is still a challenge that has needs to be overcome. Similarly, the
deployment of EVs is being contained by the high price of batteries and their relatively short lifespan. The
latter also means that, if a large deployment of EVs is to be achieved, a huge amount of batteries would
have to be produced, recycled and disposed in the coming years; and concerns should arise regarding their
related environmental footprint. So, what if all these issues had a common link?
Repurposing EVs batteries at the end of their automotive life to serve less demanding (stationary)
applications can represent a solution to many of the aforementioned problems. During the last decade,
research centers, industries and universities have invested both time and financial resources in investigating
the feasibility of reusing automotive batteries after their 1st life. Many different types of studies have been
conducted on the topic; however, very few of them have addressed the reuse of repurposed batteries in EV

 -5
fast-charging stations (FCS). And those few limited the analysis to very specific cases without properly
considering altogether the electricity tariff structure, the implementation of an optimal control strategy and
the evaluation of the residual useful life of batteries at the beginning of their 2nd life.

1.3 Objectives
Therefore, this project proposes the use of batteries, which have lost part of their original performance
while power electric vehicles, for minimizing the capital and operational costs of EV fast-charging
infrastructures. The study aims at answering the question on whether the trade-off between the reduced
cost of such batteries and their residual performance at the beginning the 2nd life effectively reduces the
costs of the station’s operation. The investigation is conducted for the Spanish scenario and takes into
account a related electricity tariff design. Different charging demand scenarios, corresponding to the cases
where fast-charging is likely to be most needed, are analyzed with the aim of evaluating which case is the
most viable in terms of potential savings. The analysis is conducted by means of an optimization algorithm
that calculates the optimal ratings of the system’s elements while considering capital and operational costs.
The project aims at answering the following questions:
 1. Could an ESS made of second-life automotive batteries minimize the capital and operational costs
 of an EV FCS located in Spain? If yes, what economic impact does its integration have in the three
 main scenarios where fast-charging mode is likely to be needed the most?
 2. Considering the design of the Spanish electricity tariff that best suits this application, what services
 should the ESS provide in order to minimize the infrastructure expenses?

1.4 Methods and analytical framework
The project objective is to evaluate whether second-life batteries having reduced lifetime and performances
are suitable to serve as on-site ESS in FCSs. The economic analysis considers the cost of the relevant
system’s elements as well as the design of the Spanish electricity tariff that best suits such application. Any
cost a potential station’s owner would have to borne regardless the integration of an ESS is not taken into
account. To conduct the economic analysis is developed an optimization algorithm built as a mixed-integer
linear programming problem and implemented in MATLAB. The mathematical model is used to evaluate
the economic feasibility of introducing an ESS in a FCS located in three of the most significant locations.
Six charging demand scenarios in total are analyzed. A sensitivity analysis is also conducted with the purpose
of evaluating how different input parameters affect the results.
All the phases along the project development required an extensive research and collection of data and
document analysis. Different sources such as academic papers, company’s reports, interviews with
companies’ experts as well as professors and other fellow students were consulted in order to gather the
required information. The analytical framework with its main phases implemented to face the research
problem is shown in Figure 5

 Simulations &
 Literature Optimization Sensitivity
 review model analysis

 Legislative Charging
 framework demand
 analysis scenarios

 Figure 5 – Visual representation of the implemented methodology with its main phases

 -6
LITERATURE REVIEW
This phase is of fundamental importance along the project development as it enabled to identify the research
gap and the theoretical and methodological approaches to fill it. The research aimed at gaining an overall
understanding on the research topic and at having a broader vision of what researchers have done in the
fields of charging infrastructures, energy storage systems and second-life automotive batteries. Of particular
importance are (Corchero et al., 2012; Gunter et al., 2013; Gunter, Afridi and Perreault, 2013; Negarestani et
al., 2016) where the authors present different methodologies, all based on optimization algorithms, to
evaluate the profitability of introducing an ESS into a FCS. Some of them also contemplates the possibility
of coupling the charging infrastructure with a renewable energy generation unit. Similarly, the publications
(Canals-Casals, Amante-García and Castellà-Dagà, 2016) and (Reid G.Julve, 2016) enabled to identify the
main factors influencing the battery degradation. The development of the methodology for estimating the
expected lifetime of the second-life cells was finally possible thanks to what described in (Canals Casals and
Amante García, 2017) and (Canals Casals, Amante García and González Benítez, 2015) and to interviews
with one of the authors. Moreover, it is important to mention the contribution of (Saez-de-Ibarra et al.,
2015; Martinez-Laserna et al., 2017) that allowed to gain a better understanding on how battery aging can be
implemented in an optimization problem.
ANALYSIS OF THE SPANISH LEGISLATIVE FRAMEWORK
A fundamental phase of the project development is the investigation of the electricity market along with its
related legislative framework. In the first part, the analysis enabled to collect all the relevant information
regarding the electricity market structure and the main regulatory bodies and laws. Then, the focus moved
to the electricity network access tariffs and, more specifically, to the identification of the most suitable ones
for a FCS. This phase enabled to identify the tariff that best suits the FCS considered in this project with all
its features. The suitability of the selected tariff was confirmed by the analysis of the project SIRVE4 (Econ
et al., 2011). Finally, it was analyzed the ministerial order regulating the activity of “el gestor de carga”, the
new and only market player allowed to resell electricity for providing EV with charging services.
DEVELOPMENT OF THE OPTIMIZATION MODEL
The development of the mathematical model was only possible thanks to the information gathered in the
previous phases. The problem is addressed with a mathematical optimization approach seeking to minimize
the annual costs of the station considering capital costs (i.e. cost of the equipment, grid connection cost)
and operational costs (i.e. cost associated with purchasing electricity from the grid). The optimization
algorithm is developed as a mixed-integer linear programming (MILP) problem and its formulation is
implemented in MATLAB. Such programming approach was preferred over others since it allows to
properly considering the operation of the battery. The algorithm only considers those costs that are
susceptible to vary across different system designs and therefore does not include the expenses that a
potential station’s owner should cover regardless the presence of an ESS. The model is built is such a way
that it permits to calculate the annual expenses of the FCS with and without an ESS and to evaluate the
viability of energy storage integration under different charging demand scenarios. The battery degradation
is evaluated through an iterative method using the outputs of the optimization algorithm.
IDENTIFICATION OF CHARGING DEMAND SCENARIOS
After interviewing some experts at SEAT, it was commonly agreed to use the optimization model to
investigate the viability of introducing an ESS in those FCSs where fast-charging modes are likely to be most
needed. Therefore, three locations where the deployment of fast-chargers is likely to increase consistently
in the following years were selected. The development of different charging demand scenarios was based
on different publications such as (CIRCE, 2015), (Celli et al., 2015), (Chen et al., 2016) and (Simpson and

4Project SIRVE integrates a renewable generation unit, an ESS and different EV chargers into a single system. It aims
at creating a platform to facilitate the recharge of EVs and at reducing the impact that EV chargers have on the power
network. The system was deployed in 2014 in the CIRCE facility close to Zaragoza, Spain. More information is
available at https://www.urbener.com/sirve/

 -7
Markel, 2012) where the authors evaluate the daily probability distribution of quick charges at different sites.
Concerning the charging scenario at a work site, the daily distribution of charging events was built with the
help of experts at SEAT since no information was found in the literature. The active power consumption
curves of three BEVs (Nissan Leaf, Tesla model S 90D and Peugeot Ion) were obtained from both literature
and SEAT. Particularly, the first two were retrieved from other studies (Sbordone et al., 2016; Nyland, 2017)
and the last one was provided by SEAT. Three future scenarios are also built and investigated with the
model. Data and insights on current utilization of fast-chargers in Barcelona was provided by the company
EVECTRA, an engineering firm active in the field of charging infrastructures.
SIMULATIONS & SENSITIVITY ANALYSIS
The optimization algorithm was implemented to evaluate the economic impact of ESS integration under
different demand scenarios. The analysis of the results enabled to identify that some input parameters
strongly affect the economic feasibility of installing an ESS (i.e. power converter specific cost, electricity
prices) while the value of others might not be well-founded (specific cost of second-life batteries). Therefore,
a sensitivity analysis aiming at determining their influence on the simulation results was conducted.

 -8
Literature review

 The first step of all investigations consists of exploring what other researchers have achieved before in
 the fields related to the research topic; and this is what this chapter contains: a review of some relevant
 studies and projects with comparable objectives that are necessary to understand the purpose and value
 of this particular thesis. Therefore, the content of this chapter should be understood as the backbone of
 this project, providing background information, state-of-the-art knowledge as well as methodological
 and theoretical approaches to the researched topic.

The last decade has witnessed the beginning of a new era for the transport sector with EVs leading the
change. Much research has focused on the many challenges limiting a large deployment of EVs and many
solutions have been proposed so far. The availability of an adequate public network of recharging
infrastructure is a key element for reaching high EVs market penetration (Gong, Fu and Li, 2016). FCSs
have gained particular attention thanks to their capability to drastically reduce the charging time, which in
turn increases the competitiveness of EVs over the conventional ones. The optimization of such
infrastructures is of fundamental importance and can be studied from different angles. The technology is
still at its early stages of development and various aspects such as the optimal planning and operation of
FCSs, the optimization of EVs charging strategy, business models, and optimization of a power network’s
operation under different penetration levels of EVs still need to be deeply assessed (Gong, Fu and Li, 2016).
The optimal planning of charging stations was investigated by (Andrews et al.). They studied how EVs would
perform in meeting the driving needs of vehicle owners and created a user charging model considering all
the trips a vehicle is supposed to drive and the availability of charging infrastructure. The first interesting
result was obtained from the statistical analysis of the data on driving patterns of vehicles in Chicago and
Seattle. The authors point out that the range of some mass produced EVs such the Nissan Leaf is actually
greater than the average distance travelled by conventional vehicles and therefore range anxiety may not be
well founded sometimes. Other outcomes indicate that an appropriate planning practice for placing charging
station on public ground can drastically reduce the probability that an EV fails in completing a trip and can
help to minimize the investment cost of installing charging infrastructures.
Similarly, (Gong, Fu and Li, 2016) proposed an abstract-map-based, multi-layer strategy to optimally plan
public FCSs including locating their sites and assigning their capacities while reducing the infrastructure
costs and mitigating the negative effects on the local grid and on the transportation system. The authors
claim that the proposed integrated approach can achieve better results compared to other planning strategies
and seem to be a promising method for optimally placing charging infrastructures. A Similar study was
conducted by (Andrenacci, Ragona and Valenti, 2016) where they propose a strategy for optimal allocation
of charging infrastructure. The methodology is based on real information on conventional private vehicle
usage in the urban area of Rome and it is assumed a complete switch from conventional vehicles to an
equivalent fleet of electric ones. In the conclusions, it is highlighted that having information about real
driving patterns is a valuable resource in this type of analysis.
Another interesting work was done by (Di Giorgio et al., 2016) where they present a real time control strategy
for integrating an ESS into an EV FCS. They implemented a model predictive control methodology aiming
at optimally distribute the power available at the station among the charging spots while managing the
different priorities of the plugged vehicles and controlling the storage for efficiently sustaining the charging
process.
(García-Triviño et al., 2016) proposed a new decentralized strategy for controlling the power sources in an
EV FCS equipped with PV panels and a battery storage system. The main contribution of this paper is the

 -9
You can also read