GOLD Survey 2013 uPDATe 1 - Prepared by Thomson Reuters GFMS
←
→
Page content transcription
If your browser does not render page correctly, please read the page content below
GOLD Survey 2013
                                                                                        UPDATE 1
                                                                                        Prepared by Thomson Reuters GFMS

©2013 Thomson Reuters. All rights reserved. Republication or redistribution of
Thomson Reuters content, including by framing or similar means, is prohibited without
the prior written consent of Thomson Reuters. “Thomson Reuters” and the Thomson
Reuters logo are trademarks of Thomson Reuters and its affiliated companies.
The cover of Gold Survey 2013 Update 1 is sponsored by the following companies:
METALS FUNDAMENTALS DATABASE
FIND DATA FAST AND REACT COMPREHENSIVE COVERAGE
The Thomson Reuters Metals Fundamentals Database provides The Thomson Reuters Metals Production Database provides you
essential, up-to-date global statistics for all known primary with an unrivalled range of content, including:
aluminium, copper, zinc, lead, nickel, platinum and gold operations
• Historical and projected capacity of base metal and gold
around the world.
operations, split by country, region, plant and metal
Compiled by our specialist global team through close consultation • Detailed information on each individual mine, refinery or smelter,
with leading industry analysts, it’s a unique and unmatched source including historical and future production & capacity estimates,
of data. Get the deep insight into the metals market you need – ownership structures and labor negotiations
all from one place.
• Regular updates during the business day
So whether you’re a trader, broker or an analyst with an interest • News on developments at individual facilities
in the mining sector, the Thomson Reuters Metals Production
• New Projects reports detailing recent metals and mine projects
Database provides all the information you need to stay ahead.
or those planned for the next few years
TANAKA PRECIOUS METALS • Archived metals stories from specialist Reuters reporters
SAVE TIME, SEE FURTHER
Tanaka Precious Metals is Japan’s leading precious metals refiner and manufacturer. Although best known • See information in context. Examine the relationship between
internationally for its high specification industrial products, used in various applications ranging from semiconductors NAVIGATE SWIFTLY THROUGH IN-DEPTH CONTENT
to communications, the company is also a producer and trader of a wide range of gold bullion bars and coins. Tanaka market events and production/capacity statistics
bars are acceptable “good delivery” on the London gold market.
Find what you want quickly through intuitive navigation and see
• Save time. The Reuters Metals Production Database provides
it clearly. Search using a wide range of criteria, including metal or
production statistics and global metals news in one place so
plant type, country, company, shareholding, production and capacity
there’s no need to search multiple sources
parameters, or display a summary page for any selected plant.
• Stay up-to-date. The database shows changes in capacity and
production as they happen • View detailed plant, country or metal summaries
• Base your decisions on the very latest news from around • Plot a historical production graph by metal type, region or country
the world. Our global team of 220 seasoned commodities • Identify the top ten producers or countries for a given year by
journalists delivers breaking news and exclusives on metals metal type
and other factors affecting the commodities markets • Easily export data to Excel for further analysis
EASY ACCESS
All this information is directly
accessible from your Thomson Reuters
desktop. No need to hunt through
different websites or applications.
• There is a link to the Metals
Fundamentals Database in the
Metals Home page. (Look for the
Valcambi is a leader in precious metals refining and operates one of the world’s largest and most efficient integrated Metals Quick Links.)
precious metals plants situated on a 33 hectare site, at Balerna, Switzerland.
• Or you can simply search for
We are also one of the world’s largest manufacturers of minted ingots. Reacting to the demands of investors in
different markets around the globe we continuously carefully developing within the size range from 0,5 g to METALS FUNDAMENTALS
1000 g, gold, silver, platinum and palladium minted bars in different forms and new designs. For our clients, according DATABASE
to their wishes we customize individually obverse and reverse of the bars, certificates and tailored packaging solutions.
All products produced in our foundry and minting facilities are certified by our laboratory, carefully inspected by our
operators, individually packed and controlled before shipment. The Hallmark is not only a guarantee for quality of
Swiss workmanship, it guarantees also the fineness of the most sought after bars in the world, desired by precious
metals connoisseurs and investors alike.
A Valcambi manufactured bar is not only sold at an outstanding price but is synonymous with unique craftsmanship,
guaranteed fineness, transparency and reliability.
NAVIGATE STRAIGHT TO MEANINGFUL INFORMATION
A clear, intuitive interface enables you to drill down quickly to explore by commodity or date – and immediately view
meaningful graphs and tables, or download to Excel.
Visit thomsonreuters.com
For more information, contact your representative or visit us online.
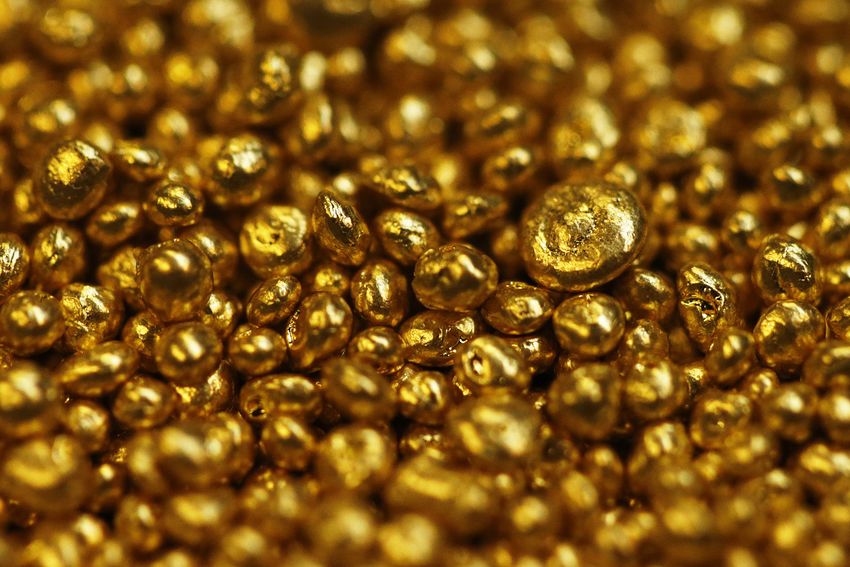
The cover of the Gold Survey 2013 Update 1 features: twelve 500 gramme Tanaka cast bars, twenty nine 50 gramme © Thomson Reuters 2013. All rights reserved.
Tanaka minted bars, nine 500 gramme Valcambi minted bars, nine 50 gramme Valcambi CombibarsTM and fifteen Republication or redistribution of Thomson Reuters content, including by framing or similar means, is prohibited
50 gramme Valcambi minted bars. without the prior written consent of Thomson Reuters. ‘Thomson Reuters’ and the Thomson Reuters logo are
registered trademarks and trademarks of Thomson Reuters and its affiliated companies. 9484083 0813.
Cover designed by Russell Miller and Matt Cleveland, photography by Henrik Andersen
GOLD SURVEY 2013
UPDATE 1
BY:

Rhona O’Connell, Head of Metals Research & Forecasts
Cameron Alexander, Manager, Regional Demand
Andrew Leyland, Manager, Regional Demand
William Tankard, Manager, Supply
Junlu Liang, Senior Analyst
Matthew Piggott, Senior Analyst
Marcin Szczypka, Senior Analyst
Johann Wiebe, Senior Analyst
George Coles, Analyst
Saida Litosh, Analyst
Sudheesh Nambiath, Analyst
Janette Tourney, Analyst
Ryan Cochrane, Analyst
Sara Zhao, Analyst

PUBLISHED SEPTEMBER 2013 BY THOMSON REUTERS GFMS

The Thomson Reuters Building, 30 South Colonnade
London, E14 5EP, UK
E-mail: gfms@thomsonreuters.com
Web: https://thomsonreuterseikon.com/markets/metal-trading/
THOMSON REUTERS GFMS GRATEFULLY ACK NO
    THE FOLLOWING COMPANIES FOR THIS YE AR

 www.pamp.com                     www.gold.org

www.goldcorp.com                 www.pretivm.com

www.cmegroup.com                  Italpreziosi SPA

                   www.moro.si
CK NOWLEDGE THE GENEROUS SUPPORT FROM
YE AR’S GOLD SURVEY AND ITS TWO UPDATES

      TANAKA PRECIOUS METALS

         Barrick Gold Corporation                    www.standardbank.com/cib

          www.randrefinery.com                            www.igr.com.tr

                                    www.cyplus.com
TABLE OF CONTENTS
1. Summary and Price Outlook                                                                                                           5
      • Supply 6 • Demand 6 • Market Outlook 7

2. Gold Prices in 2013                                                                                                                 8
      • Price Outlook 10

3. Investment                                                                                                                         11
      •   Implied Net Investment 12 • Investment in Exchange Listed Structured Products 13
      •   Exchange Traded Funds 13 • Commodities Exchange Activity 13
      •   Over-the-Counter Market 15 • Physical Bar Investment 15
      •   Official Coin Sales and Fabrication 17 • Medals and Imitation Coins 17

4. Mine Supply                                                                                                                        18
      • Mine Production 18 • Production Costs 22 • Producer Hedging 24

5. Supply From Above-Ground Stocks                                                                                                   25
      • Official Sector 25 • Scrap Supply 27

6. Fabrication Demand                                                                                                                29
      • Europe 29 • North America 31 • Middle East 32 • Indian Sub-Continent 34 • East Asia 35

6. Price Appendix                                                                                                                    38

Focus Boxes
      • Investment in Commodities 14 • Corporate Activity 21
      • A Market Rarity; Gold in Backwardation 26 • Industrial Demand 37

ACKNOWLEDGEMENTS
The estimates shown in this Update for the main components of mine production, scrap, fabrication and investment demand are calculated
on the basis of a detailed supply/demand analysis for each of the markets listed in the main tables. In the vast majority of cases, the
information used in these analyses has been derived from visits to the countries concerned and discussions with local traders, producers,
refiners, fabricators and central bankers. Although we also make use of public domain data where this is relevant, it is the information
provided by our contacts which ultimately makes this Update unique. We are grateful to all of them.

© THOMSON REUTERS 2013.
All content provided in this publication is owned by Thomson Reuters and/or its affiliates (the “Thomson Reuters Content”) and protected
by United States and international copyright laws. Thomson Reuters retains all proprietary rights to the Thomson Reuters Content. The
Thomson Reuters Content may not be reproduced, copied, manipulated, transmitted, distributed or otherwise exploited for any commercial
purpose without the express written consent of Thomson Reuters. All rights are expressly reserved.

TRADEMARKS
“Thomson Reuters” and the Thomson Reuters logo are trademarks of Thomson Reuters and its affiliated companies. The third party
trademarks, service marks, trade names and logos featured in this publication are owned by the relevant third parties or their affiliates.
No use of such mark, names or logos is permitted without the express written consent of the owner,

DISCLAIMER OF WARRANTIES AND NO RELIANCE
This publication is provided by Thomson Reuters on an “as is” and “as available” basis. Thomson Reuters makes no representations or
warranties of any kind, express or implied, as to the accuracy or completeness of the Thomson Reuters Content.

Thomson Reuters is an aggregator and provider of information for general information purposes only and does not provide financial or
other professional advice. Thomson Reuters is not responsible for any loss or damage resulting from any decisions made in reliance on the
Thomson Reuters Content, including decisions relating to the sale and purchase of instruments, or risk management decisions.
GOLD SURVEY 2013 - UPDATE 1
1. SUMMARY AND PRICE OUTLOOK
The first eight months of 2013 saw a major rebalancing in Global mine production in the first half of 2013 increased
the gold market with an exodus of professional investors by 3% to 1,416 tonnes. The number and scale of mines
SUMMARY AND PRICE OUTLOOK
countered by an explosion in grass roots demand. From that have been placed on care and maintenance due
their peak at the start of the year through to early August, to lower gold prices has as yet been modest, and is
Exchange Traded Fund (ETF) holdings fell by 26% and likely to remain so in the near term. Cost containment
this, coupled with the withdrawal of momentum-driven is emerging, though, notably through reduced capital
money, contributed to a 30% intraday price decline from expenditure budgets and slowing project development.
the high of $1,696/oz in January to a low of $1,181/oz at
end-June. The price fall triggered a huge leap in physical Gold movements have also been heavily affected by
bar-hoarding and coin demand, while also marking a monetary policy particularly in the United States. Now,
possible end to the decade-long substitution away from however, professional investors have priced in the
gold in the jewellery market. tapering of monetary stimulus and the private buyer is
centre stage. The counterbalance between physical and
The first half of 2013 saw an increase of more than 550 professional demand will help to give gold some renewed
tonnes of gold offtake in jewellery, investment bars, relative price stability to refresh its appeal as an asset
coins and medals. This helped to reverse the price fall, class to longer-term investors as a portfolio balancer.
prompting a recovery towards $1,440 by end-August.
The rebound in demand was widespread, through the We expect gold to edge higher through the rest of 2013
Middle East and South and East Asia, and highlighted and towards $1,500 in early 2014, before a gentle decline
the Indian government’s continued concern about the thereafter. The falls in the second quarter of 2013 have
contribution of gold imports to the country’s trade deficit. flushed out many weak-handed holders, but it remains
This year looks set to be the first year in modern times questionable as to whether there will be sufficient
when China will overtake India as the metal’s number one investor appetite to absorb large quantities of gold at
consumer, by as much as 100 tonnes. prices much above $1,400.
WORLD GOLD SUPPLY AND DEMAND
Change Change Change
(tonnes) 2012 2013F y-o-y 12.H1 12.H2 13.H1 y-o-y 13.H2F y-o-y
Supply
Mine production 2,864 2,917 1.8% 1,374 1,490 1,416 3.0% 1,501 0.8%
Old gold scrap 1,591 1,397 -12.2% 772 819 662 -14.3% 736 -10.2%
Net producer hedging - - n/a - - - n/a - n/a
Implied net disinvestment - 213 n/a - - 456 n/a - n/a
Total Supply 4,455 4,527 1.6% 2,146 2,309 2,533 18.0% 2,237 -3.1%
Demand
Fabrication
Jewellery 1,896 2,137 12.7% 926 970 1,137 22.8% 1,000 3.1%
Other 718 823 14.6% 363 356 454 25.2% 369 3.8%
Total Fabrication 2,615 2,960 13.2% 1,289 1,326 1,591 23.5% 1,369 3.2%
Net official sector purchases 544 361 -33.6% 281 263 191 -32.0% 170 -35.3%
Physical bar investment 945 1,166 23.4% 477 468 725 52.0% 441 -5.7%
Net producer de-hedging 40 40 -0.2% 9 30 26 177.2% 14 -54.1%
Implied net investment 312 - n/a 90 222 - n/a 243 9.4%
Total Demand 4,455 4,527 1.6% 2,146 2,309 2,533 18.0% 2,237 -3.1%
London PM fix, US$/oz 1,668.98 1,446.00 -13.4% 1,651.34 1,686.34 1,523.29 -7.8% 1,369.00 -18.8%
Source: Thomson Reuters GFMS
Totals may not add due to independent rounding. Net producer hedging is the change in the physical market impact of mining companies’
gold loans, forwards and options positions. Implied net investment is the residual from combining all other Thomson Reuters GFMS data
on gold supply/demand as shown in the Summary Table. As such, it captures the net physical impact of all transactions not covered by the
other supply/demand variables.
5GOLD SURVEY 2013 - UPDATE 1
SUPPLY DEMAND
——Mine production was 3% higher in the first half ——Jewellery fabrication jumped by 22.8% in the first
compared with the first half of 2012 half, in response to a marked decline in gold prices.
—— Global scrap supply fell 14% to an estimated 662 ——First half industrial demand slipped by 1.3%.
SUMMARY AND PRICE OUTLOOK
tonnes chiefly as a result of weaker gold prices. ——Net official sector purchases dropped by 32.0% to
191 tonnes in the first half of 2013.
Global mine production in the first half of 2013 increased ——Producers’ dehedging increased, with some miners
by 41 tonnes or 3%, to total 1,416 tonnes. Geographically, taking advantage of lower prices to close positions.
gains were diverse, with notable increases in China, the ——World Investment plunged by 28.3% to 517 tonnes.
Dominican Republic, Canada and Russia. In several
instances, especially the Dominican Republic and Jewellery fabrication in the first half of 2013 rose by a
Canada, these gains were driven by capacity additions substantial 22.8% year-on-year and, in terms excluding
from new projects ramping up output. Production that scrap, by an even more buoyant 42.8%. It should be of
has been put onto care-and-maintenance as a result of little surprise to see such a strong performance, given the
lower gold prices has been modest and we expect little 8% decline in the average gold price, with gains largely
change to this in the near term. Mining companies are, driven by a surge in demand for jewellery across much
though, implementing cost containment measures, via of the key consuming markets in the developing world
the reduction of capital expenditure and the slowing in response to the gold price correction. Much of the
of project development, this has been accompanied by first half growth of 211 tonnes, however, was the result of
large-scale asset impairment charges recorded by many gains in China and India, which saw combined demand
of the major producers. rise by over 170 tonnes, representing approximately 80%
of the period’s total gains. Excluding these two countries
Global scrap supply fell by 14% in the first half of 2013 from the global total shows that jewellery offtake in the
to an estimated 662 tonnes. A declining price trend in rest of the world grew by 10.2%.
the first quarter followed by the acute price correction in
mid-April and again in June led to a notable reduction Indian jewellery fabrication jumped by 25% in the first
in recycling across most key regions. Sizeable falls half of the year to almost 350 tonnes, as demand for
were recorded in both the industrialised and developing jewellery soared in the second quarter in response to the
world with double digit declines commonplace across price retreat. Similarly, lower gold prices were the main
most markets. The largest drop was recorded in India driver behind a notable growth in China, which enjoyed
where scrap supply slumped by 45% for the period due a 41% or near 100 tonne rise, to a record of 345 tonnes.
to a weaker rupee gold price, assisted in the main by a Elsewhere, given its historical price sensitivity, it is not
near 70% year-on-year decline in the second quarter. surprising that jewellery fabrication in the Middle East
Elsewhere, scrap recycling followed a similar trajectory rose by 19% year-on-year, with double-digit percentage
with first half supply dragged down by a 22% year-on- gains across much of the region.
year drop in global return in the second quarter. Scrap
from Europe and East Asia fell by 13% year-on-year, while Turning to the industrialised world, jewellery fabrication
supply from the Middle East retreated 15% from last year. in the United States was up by 8% in the first half, due
to a combination of weaker gold prices and improving
GOLD PRICE AND TRADE WEIGHTED DOLLAR consumer sentiment. By contrast, European jewellery
Ch1 Gold price and TW$
fabrication continued to decline, registering a 5% drop
2000 60 in the first half, as a result of ongoing structural changes
Trade Weighted Dollar Index (H1.03=100, inverted)
Gold Price
(such as a shift from plain jewellery pieces towards
1600 70
gemset) and a still challenging economic environment,
US$/oz (period average)
although weaker gold prices helped to mitigate the
1200 80
Trade Weighted Dollar
losses somewhat.
800 90
Industrial fabrication dropped by 1.3% in the first half;
much of that was driven by the 9.2% drop in dental
400 100
offtake due to ongoing substitution. Demand for
0
electronics and other industrial & decorative uses
110
H1-03 H1-05 H1-07 H1-09 H1-11 H1-13 remained flat year-on-year.
Source: Thomson Reuters GFMS
6GOLD SURVEY 2013 - UPDATE 1
Producer de-hedging contributed a net 26 tonnes of MARKET OUTLOOK
demand in the first half-year. While it could be assumed
that as the price fell steeply gold miners would have Notable improvements in gold’s underlying supply/
moved to hedging, so far they have largely kept clear. demand fundamentals, and a rush to physical gold in
Indeed, many Australian focused producers took the particular, have been among the key factors to provide
SUMMARY AND PRICE OUTLOOK
opportunity actively to close out hedges as prices fell, some cushion to gold following two price crashes in the
continuing the global trend of overall reductions. second quarter. Nevertheless, while we remain generally
positive about physical demand, such heightened
Net official sector purchases slowed notably in the volumes will prove hard to sustain for the rest of the
first six months of 2013, falling by 32.0% to 191 tonnes. year. Furthermore, while we have witnessed widespread
Nevertheless, it is important to stress that, despite the gains in physical offtake in the year-to-date, the gold
hefty drop, the absolute total stayed relatively high market has still relied heavily on India and China, with
by historical standards, as the argument for reserve their combined share of global gold demand standing
diversification for developing countries remained in at 54% in the first half. With a weakening Indian rupee
place. Consistent with the trend in the previous year, the and a series of measures by the government to curb gold
bulk of gross official sector purchases was accounted for imports, demand in India is forecast to be some way short
by emerging market countries, although the sharp rise of the elevated level in the second quarter. Turning to
in gold price volatility seems to have deterred certain China, the prospect for local demand is more promising,
central banks from making fresh purchases. but growth is expected to cool down once the general
public starts to become accustomed to new price levels
World Investment slumped by 28.3% year-on-year to and bargain hunting recedes.
517 tonnes in the first half of 2013, the lowest figure
since 2009. If measured in dollar terms, the fall was While demand from the key consuming markets may
even steeper, with the equivalent value of this demand well slacken somewhat, we expect restrained supply
dropping by almost 34% to roughly $25 bn. to remain in place in the second half. Our forecast is
primarily based on an assumption that scrap supply
Such a considerable fall was almost entirely a result of will fall by 12.2% on a year-on-year basis, as a return to
heavy liquidation by institutional investors. Illustrative of mid-$1,400s will not be sufficient to stimulate a wave of
the trend was implied net disinvestment, which reached recycling. At the same time, mine production is expected
456 tonnes in the first half. There were several reasons to rise marginally. More importantly, despite a hefty
behind this growing disenchantment with gold. First price decline, producers have so far remained resistant to
and foremost, increasing perceptions that the decade- engaging in hedging as a strategy for preserving revenue.
long gold bull market would soon come to an end seems
to have encouraged a wave of profit taking, especially The underlying surplus in the gold market (which has
in light of improving yields in traditional assets such as ballooned in recent years) is therefore likely to shrink
equities. While the initial selling was relatively modest, by a fair amount this year. This, along with a probable
investor sentiment was soon hit by the news in mid-April recovery in buy-side interest from professional investors
that the European Commission had suggested that and ongoing central bank purchases, should pave the
Cyprus sell gold reserves to raise funds. The situation way for a decent price recovery later this year.
was then exacerbated by rising expectations that the
WORLD GOLD FABRICATION LESS SCRAP SUPPLY
Federal Reserve would soon begin tapering its QE
programme, further reducing gold’s safe haven appeal. 1600 2100
Gold Price 1800
While the first half witnessed substantial selling from
1200
institutional investors, this was more than offset by a 1500
surge in bargain hunting from small retail investors in *
1200
US$/oz
Tonnes
almost every key market, led by China and India. For 800
900
instance, bar investment jumped by 52% to a new
record of 725 tonnes, while demand for official coins 600
400
and medals & imitation coins also reported heavy gains. *
300
Nevertheless, as demand in many regional markets tends
to be price sensitive, volumes started to ease following 0 0
H1-03 H1-05 H1-07 H1-09 H1-11 H1-13
the buying frenzy in late April and early May. Source: Thomson Reuters GFMS
*Forecast; Fabrication excludes all coins
7GOLD SURVEY 2013 - UPDATE 1
GOLD PRICES, 2012 - 2013
2. GOLD PRICES IN 2013 % change
y-o-y 13.H1
12.H1 12.H2 13.H1 average intra-year
• Gold showed a two-legged violent correction in the first US$/oz 1,651.34 1,686.34 1,523.29 -7.8% -29.6%
half-year, driven by emerging profit taking after a 13-year Euro/kg 40,913 42,584 37,339 -8.7% -25.9%
bull run, in combination with a strengthening US economy. Yen/g 4,231 4,324 4,671 10.4% -17.8%
Yuan/g 335.62 341.31 302.61 -9.8% -30.7%
• The price fell 30% year-on-year in the first half to an Rand/kg 420,921 459,761 450,637 7.1% -14.7%
intra-day low of $1,181/oz in June, stimulating further large A$/oz 1,597.17 1,623.50 1,513.63 -6.1% -17.7%
UK-led ETF outflows. Demand for physical metal surged, Rouble/g 1,621.45 1,711.56 1,500.34 -6.7% -22.2%
particularly from Asia, providing a floor for the falling price. TL/g 95.35 97.35 88.66 -7.0% -23.6%
Rps/10g 28,579 30,873 28,734 0.5% -18.0%
Gold opened the year at $1,694/oz, a level almost Rph/g 486,474 517,906 476,289 -2.1% -25.1%
$96/oz above that recorded in 2012. However, the Source: Thomson Reuters GFMS
relatively positive year-on-year comparison was not
matched by an equally strong performance, as the
opening of the year turned out to be just $3/oz shy of the Gold prices in virtually every other currency saw large
first half peak. Indeed, gold was trending in a downward declines on an intra-year basis, with the Euro/kg, Yuan/g
channel that started in October the prior year and tested and Rph/g falls all considerable at 26%, 31% and 25%
GOLD PRICES
the upper parallel during January 2013. However, in respectively. Year-on-year, gold prices in most currencies
February, gold showed considerable weakness by falling fell between 2-10%, except in Japan and South Africa.
$90/oz towards the channel’s floor at $1,555/oz, which
turned out to be a presage of what was about to come. Gold started 2013 with a modest rally driven in part by
the ongoing difficulties surrounding the fiscal cliff in
Indeed, after various failed attempts to regain some of the US. However, the upturn turned out to be of short
its lost ground in March, gold fell off a cliff and recorded duration as various gold-negative factors bit by bit
its largest two day decline in its recent bull-run, shaving started to unwind. Indeed, the year began with increased
off nearly $228/oz or 28% from the annual high to a low wariness among investors who were concerned about
of 1,321/oz in mid-April. In the following two months gold’s ability to stage another year of price increases
a bounce emerged forming, from a technical point of following a 13-year bull run. As a consequence, some
view, a cup-and-handle formation, which implied that profit taking emerged, driven also by largely diminished
another correction was on the horizon. Consequently, concerns over the European sovereign debt crisis, in
gold proceeded with a second leg to the downside, albeit combination with a rising risk-on attitude from investors,
less pronounced than the previous one, falling another allocating increased funds into rising equity markets.
$156/oz from the previous low to $1,181/oz by end-June,
representing a total first-half high-to-low price decline of This development was particularly reflected in gold ETFs,
$374 or 30%. which slowly but surely started to witness outflows across
GOLD PRICE AND TRADE-WEIGHTED DOLLAR (INVERTED) - DAILY
2000 90
Fed says interest FOMC minutes Mario Draghi pledges Indian goverment raises President Obama
rates to stay low released, no sign to do “whatever import tax on gold and platinum signs into effect
until at least 2014 of QE3 FED announced
it takes” to save from 4% to 6% spending cuts
Spain seeks it could start slowing
1800 the euro known as sequester
banking rescue asset purchases 95
EC annouces by end-2013
(Inverted, 3rd Jan=100)
Trade Weighted Dollar
Gold Price Cyprus to sell depending on
1600 €400mn worth economic
of gold conditions
US$/oz
Trade Weighted 100
Dollar
Fed launches QE3 and anticipates
1400
S&P downgrades low interest rates to mid-2015
9 Eurozone German court ratifies
Francois Hollande
nations, 14 put on elected as
Eurozone permanent FED will keep int rate 105
1200 negative outlook French President rescue fund near zero until unplment ECB cuts int
ECB announces Barack Obama falls below 6.5% rate to new low India raises
ECB launches Fed extends “Operation “unlimited” bond re-elected President Obama signs 0.5% amid region’s import duty
second round of LTRO Twist”until year-end buying scheme US President bill to avoid “fiscal cliff” ongoing worries on gold to 10%
1000 110
Jan-12 Feb Mar Apr May Jun Jul Aug Sep Oct Nov Dec Jan-13 Feb Mar Apr May Jun Jul Aug Sep
Source: Thomson Reuters GFMS
8GOLD SURVEY 2013 - UPDATE 1
VOLATILITY (US$ SPOT)
the board. Indeed, in the first quarter, various funds such
as SPDR, iShares Gold Trust and ETFS Physical Gold all 2007 2008 2009 2010 2011 2012
recorded net outflows of 10%, 3% and 7% respectively. 15.8% 31.7% 21.4% 15.9% 21.4% 16.5%
On Comex also, sentiment turned sour with a record- 12.Q1 12.Q2 12.Q3 12.Q4 13.Q1 13.Q2
breaking build in speculative short positions, which 20.0% 19.8% 14.3% 11.7% 11.9% 10.7%
totalled some 447 tonnes in mid-July.
GOLD PRICE CORRELATIONS*
By now, sentiment clearly had turned bearish which 12.Q3 12.Q4 13.Q1 13.Q2
stimulated a nervous sentiment in the market. Therefore, US$/Euro Rate 0.53 0.21 0.09 0.37
when the European Commission suggested that the Silver 0.69 0.50 0.51 0.78
Cypriot central bank should sell €400M (equivalent to Oil (WTI) 0.24 0.26 0.25 0.40
ten tonnes at that point) of its gold holdings to finance CRB Index 0.12 0.18 0.12 0.47
part of its European rescue package, the gold price S&P 500 0.27 0.11 0.11 0.31
started to drop and this quickly developed into a violent Comex ‘Investor’ 0.83 0.75 0.88 -0.15
move down, as hoards of investors and speculators *basis daily log-returns, save for non-commercial & non-reportable
net Comex positions where weekly.
headed for the exit. In the grand scheme of things,
Source: Thomson Reuters GFMS
Cyprus’ potential gold sale of 10 tonnes was almost
negligible; what spooked investors was the possibility
that the independence of various European-based central
GOLD PRICES
banks would become jeopardised, particularly if ‘The ETF outflows continued throughout the second quarter,
Troika’ were to obtain authority to force cash strapped with holdings falling 22% over the half. Meanwhile what
nations to sell gold holdings in order to receive funding. had become obvious was the strong divergence between
Were Italy or Spain forced to take similar measures, for the paper and the physical market. Indeed, as bearish
example, the impact on the market would be far more sentiment prevailed in digitally traded gold, physical
pronounced. demand such as bars, coins and jewellery surged,
particularly from the Far East. Strong trade flows were
However, the central bank of Cyprus kept its recorded between the UK and Switzerland, where Good
independence and the country received its bail-out Delivery metal was refined to smaller bars and shipped
without having to sell any of its gold reserves. This to India and China.
was well received by the market and gold bounced
accordingly, from an intermediate low of $1,321/oz to as This development, however, was not well received by
high as $1,488/oz during early May. Investors, however, the Indian government, which was suffering from a
continued allocating their funds into higher yielding burgeoning current account deficit. Duty on gold imports
assets, mainly driven by a series of optimistic US data was raised several times, eventually reaching 10%,
releases, which in turn fuelled the debate at the Fed which did slightly curb the balance, but also stimulated
to start tapering later in the year. Consequently, gold unofficial inflows. However, all negative spill-over effects
plateaued in a range of $1,400-1,440/oz, then shortly aside, the strength in physical demand did eventually
after started its second leg to the downside in mid-June. provide a price floor above $1,180/oz at the end of June.
PRODUCTION & CONSUMPTION-WEIGHTED GOLD PRICES DAILY GOLD PRICE VOLATILITY & LEASING RATES
200 40 0.5
Rolling 1-month volatility (%, annualised)
Real Gold Price
Leasing Rate
175
30 0.0
Index, January 2009 = 100
1-month Leasing Rate (%)
150
20 -0.5
Consumption Price
125
10 -1.0
100
Production Price
Volatility
75 0 -1.5
Jan-09 Jan-10 Jan-11 Jan-12 Jan-13 Jan-10 Jul Jan-11 Jul Jan-12 Jul Jan-13 Jul
Source: Thomson Reuters Source: Thomson Reuters
9GOLD SURVEY 2013 - UPDATE 1
GOLD, OIL AND THE CRB INDEX GOLD
Ch2PRICE AND
Gold price andUS$/EURO
US$/euro
125 2000 1.6
Gold
1800 1.5
Index, 4th January 2012= 100
Gold Price
Oil
100
1600 1.4
US$/oz
US$:€
US:€
1400 1.3
CRB
75
1200 1.2
50 1000 1.1
Jan-12 Apr Jul Oct Jan-13 Apr Jul Jan-12 Apr Jul Oct Jan-13 Apr Jul
Source: Thomson Reuters Source: Thomson Reuters GFMS
PRICE OUTLOOK as the country’s underlying economy is still fragile with
only moderate inflation pressures. We expect very loose
Following the strong price correction in the first half-year, monetary policies to remain in place for an extended
gold showed considerable resilience by staging a 21% period with the low interest environment extending
recovery from June lows to as high as $1,433/oz by the throughout 2015.
GOLD PRICES
end of August. Much of the increase was supported by a
professional investor-led short-covering rally, on top of Elsewhere, central banks in other key economic countries
strong physical demand from Asia and the Middle East. have also stated a preference towards maintaining
This in conjunction with restrained supply pushed gold loose policy in order not to choke off their improving
into backwardation, a phenomenon last witnessed in economies. In addition, as we head into festival periods
1999 when, as part of the Central Bank Gold Agreement, for jewellery purchases (particularly in China and India)
the signatories stated that they would not be expanding further interest for physical demand in Asia is likely.
their existing lent gold positions. However, recent geopolitical tensions regarding Syria
could lead to a wider Middle East conflict, which could
Gold’s ability to stage further price gains for the in turn stimulate another short covering rally as net
remainder of the year will largely depend on positions on Comex have left room for that to emerge.
developments in the US and its labour market which,
while still fragile, has shown improvements in recent In summary, the argument for investing in gold should
months. Indeed, particularly since the Fed has tied its QE remain in place for long-term investors, although short
mandate towards developments in the unemployment term challenges remain on the horizon. Taking all into
rate, the FOMC meetings and the non-farm payroll consideration, gold should continue its upward trend in
releases have almost become price trend determining the fourth quarter and test $1,480/oz, the level where
events. Consequently, despite stock markets around the the second major correction started to decelerate back
world having shown signs of considerable weakness at in May of this year. With a little bit of momentum,
times, the general trend is still up and new highs are still gold could test the psychologically important $1,500/
being recorded. It looks unlikely that this will change oz level and possibly have a look at the major $1,526/
much this year, particularly if the US continues to present oz resistance area in as early as the first quarter of the
solid underlying macroeconomic figures with the dollar next year, being it mainly due to seasonal reasons. This
consequently remaining resilient. In general, we remain scenario would be most likely in the event that the Fed
of the view that the gold market remains cautious. held off tapering until at least late 2014, as we imply
above. If tapering were announced sooner rather than
Be that as it may, there are several factors still present later, gold would likely stage another leg to the downside
in the market that support a case for a stronger gold potentially testing the June lows, which would not be a
price. Indeed, despite the labour market improving, particularly bright start to the New Year.
investors might argue that the current unemployment
rate of 7.4% is still well away from the 6.5% threshold
level that the Fed has indicated as a starting point for
a more dovish macroeconomic course. And even when
stimulus is scaled back, the exit will be long and gradual
10GOLD SURVEY 2013 - UPDATE 1
3. INVESTMENT
• World Investment weakened by 28% to 517 tonnes in back into the equity market. Supporting the view was a
the first half of 2013, with the fall in the equivalent value of generally disappointed gold investor community, which,
this demand even steeper. after the summer rally in 2012, generally had been
expecting gold to breach the $1,800 mark, and which
• The hefty decline was due entirely to 456 tonnes of instead was faced with a poorly performing yellow metal.
implied net disinvestment, reflecting aggressive selling from As expectations grew that the decade-long bull market
institutional investors over the period. might soon come to an end, a rising number of funds
took profits in gold with a view to moving back to high-
Investment demand remained the main driver of price yielding assets.
fluctuations throughout the first half of 2013. At present,
World Investment is estimated to have tumbled by 28% Another key factor that encouraged funds to cut their
to 517 tonnes in the first half of 2013, the lowest half- exposure to gold was the yellow metal’s fading appeal
yearly figure since the onset of the global financial crisis. as a safe haven. In part, this reflected an absence of
The picture is even more disappointing if measured in imminent inflationary pressure in the key economies and
dollar terms, with the approximate value of this demand growing expectations that the Fed would start to taper
plunging by 34% to $25 bn. its asset purchase programmes sooner than had been
expected. Even though real interest rates remained
The fall was largely attributable to heavy investment negative in many countries, improving returns on
outflows from institutional players, especially mutual traditional assets raise the opportunity cost of carrying
and hedge funds. This is highlighted in our implied bullion. Also of importance have been less acute fears
net investment figure, a proxy for institutional investor about the sovereign debt situation in Europe.
activity, which shifted to negative territory and hit minus
456 tonnes in the first half. By contrast, interest in A generally more cautious attitude towards the overall
gold from retail investors (who historically dominate commodities complex among institutional investors
purchases of physical bullion products) soared in the first also restrained gold investment in the first half of the
half, with our estimates for both bars and coins reaching year. Apart from a relatively strong dollar, a slowdown in
record highs in our data series (on a half-yearly basis). emerging market countries and increasing concerns that
the commodity supercycle could soon come to an end
INVESTMENT
With regard to the drivers of gold investment demand, seems to have weighed on investor sentiment.
economic developments in the United States were
probably the single most important factor at play, That said, it is of note that the bulk of these
particularly in relation to their impact on the Fed’s aforementioned outflows in the first half stemmed
monetary policy and professional investors’ assessment from loose-handed investors, particularly those that
of risk. Indeed, as the “fiscal cliff” was avoided at the were technically driven. By contrast, substantial core
start of 2013 and the country’s economy continued to long positions were maintained by long-term investors,
gain momentum, asset managers started to pile money despite increasing headwinds on the gold price.
WORLD INVESTMENT KEY MARKET INDICATORS
(tonnes) 12.H1 12.H2 13.H1 13.H2F (end-period) August Change Intra-
Implied Net Investment* 90 222 -456 243 2012 2013 y-o-y year
Physical Bar Investment 477 468 725 441 S&P 500 1,426 1,633 16% 12%
Official Coins 104 93 179 127 CRB Index 484 473 -4% -2%
Medals and Imitation Coins 49 64 69 40 XAU Index 166 103 -39% -39%
Total 721 847 517 851 US 30-year Bond 2.94% 3.68% n/a n/a
Indicative Value US$ (bn)** 38 46 25 37 Gold Price $/oz 1,657.50 1,394.75 -15% -18%
*Implied net investment is the residual from combining all of the Contango (3-mth) 0.35% 0.03% n/a n/a
other Thomson Reuters GFMS data on gold supply/demand as US$ Libor (3-mth) 0.31% 0.26% n/a n/a
shown in the Summary Table. Source: Thomson Reuters
As such it captures the net physical impact of all transactions not
covered by the other supply/demand variables.
**Indicative values calculated using average gold prices.
11GOLD SURVEY 2013 - UPDATE 1
It is also interesting to note that while the first half of IMPLIED NET INVESTMENT
2013 witnessed considerable selling from institutional
investors, appetite for physical gold investment products ——Substantial ETF outflows, combined with heavy
at the “gross roots” level showed an extraordinary rise liquidation of investor positions on Comex, saw
over the same period. Such a divergent outcome is implied net disinvestment of 456 tonnes in the first
largely related to the fact that small retail investors, half of 2013.
particularly those in the developing world, tend to be
price sensitive. As the gold price recorded its largest one- The implied net (dis)investment figure is not
day drop in more than three decades in mid-April, it is not independently calculated, but derived as the item which
surprising that bargain hunting exploded in almost every brings gold supply and demand into balance. The
major consuming market across Asia and the Middle figure should therefore not be seen as an exact tonnage
East. Nevertheless, as gold prices continued to weaken equivalent but instead an indication of investment activity
and bearish sentiment started to develop, demand for separate from retail bar and coin demand. Additionally,
bullion coins and bars in response to the second price although a substantial majority of this tonnage will
dip in late June was more restrained, although volumes reflect such activity, implied net (dis)investment could
were still healthy. Turning to western markets, retail also include other flows that, technically, are outside the
investment also posted healthy gains in the first half. definition of investment. One example is the impact of
Notably weaker prices were obviously important to the any central bank activity that is not being picked up in
rise, but a more fitting interpretation of these gains is our official sector figures and that would, as a result, be
that ongoing uncertainty regarding the economic and absorbed within our implied net (dis)investment category.
fiscal situations encouraged certain “buy-and-hold” Despite this caveat, implied net (dis)investment typically
investors to take advantage of lower prices to add gold does provide a clear indication of the overall impact of
holdings as a means of wealth preservation. investor activity on the market for the period discussed.
Furthermore, using information collected through field
Looking ahead, although an improving outlook for the research and publicly available data, Thomson Reuters
US economy has raised the probability that the Fed GFMS performs a ‘reality check’ on these values.
will start to scale back its stimuli after its September
FOMC meeting, the majority of the negative factors have Our implied figure turned negative in the first half of
already been “priced in” by the market. Furthermore, we this year, with net disinvestment totalling 456 tonnes,
would expect major central banks, including the Fed, to a sharp contrast to the same period of last year when
maintain accommodative monetary policy, while liquidity the market saw implied net investment of 90 tonnes. A
INVESTMENT
will remain ample for an extended period. The argument close analysis of quarterly developments suggests that
for gold investment therefore should remain intact for this was, in some part, due to a higher disinvestment
long-term investors. In addition, as the new round of figure in the first three months of 2013 compared
debt negotiations starts in the United States, the scope with the corresponding period in 2012. The majority,
for a further rise in the equity market could be somewhat however, took place in the second quarter, which saw net
limited. As the bulk of the speculative froth has already disinvestment of close to 330 tonnes, a dramatic change
been removed from the market, this leaves plenty of from a year earlier, with 112 tonnes of positive demand.
room for a decent rebound in investment inflows to gold.
WORLD INVESTMENT GOLD AND THE BENCHMARK YIELD CURVE
1500 Coins** 2000 3.0 2000
Gold Price
Physical Bar Investment
1250
Implied Net (Dis)investment 1800
1000 2.5
*
1600 1500
750
Benchmark curve
US$/oz
*
Tonnes
US$/oz
(2yr-10yr spread)
500 1400 2.0
%
250
1200 1000
0 1.5
1000 The Benchmark yield curve reflects
-250 inflationary expectations
Gold price
-500 800 1.0 500
H1-09 H1-10 H1-11 H1-12 H1-13 Jan-10 Jan-11 Jan-12 Jan-13
Source: Thomson Reuters GFMS
Source: Thomson Reuters
*Forecast; **Official coins and medals & imitation coins
12GOLD SURVEY 2013 - UPDATE 1
GOLD ETFS AND OTHER SECURITISED PRODUCTS
The key driver behind the selling in the first half of the
2800 2000
year was growing optimism that the US economy was Other
gaining traction, which generated concerns that the Fed 2400 iShares Gold
1600
could end its bond purchase programme sooner than 2000
SPDR Gold Shares
previously expected and which thus significantly reduced NewGold
1200
1600
investor appetite for safe haven assets. This translated GBS (LSE listed)
US$/oz
Tonnes
into dramatic selling on Comex, with net positions 1200
Gold Price 800
dropping to a multi-year low by end-June, coupled with
800
heavy outflows from gold ETFs. 400
400
It is interesting to examine how the implied figure 0 0
compares with information on activity within the Jan-04 Jan-06 Jan-08 Jan-10 Jan-12
Jan-13
different arenas of gold investment (although given Source: Thomson Reuters GFMS, collated from respective ETF issuers’ data
aforementioned limitations in this information, it is not
possible to disaggregate accurately the implied figure net daily dollar outflow was $27.4 billion. While the
into these components). Due to the nature of gold ETFs first three months of the year registered heavy outflows,
and other similar products, we are certain that the near the bulk of the first half’s drop was concentrated in
580-tonne decline in ETF holdings had a one-to-one the second quarter, which saw the largest quarterly
impact on the volume of investment. The picture is redemption of over 400 tonnes since the launch of the
somewhat more opaque when it comes to the futures first gold ETF in early 2003.
and OTC markets. As for the former, at end-June, non-
commercial and non-reportable net positions in Comex The key reason behind the selling at the start of the
futures were 477 tonnes lower than the end-2012 figure. year was growing speculation that the Fed may end
Turning to the OTC market, however, the first half-year its monetary stimulus earlier than expected as the US
saw robust volumes of investment. economy continued to show signs of improvement, which
reduced gold’s safe haven appeal. As we moved further
INVESTMENT IN EXCHANGE LISTED into the second quarter, the fall was exacerbated by
STRUCTURED PRODUCTS politicians’ suggestions in mid-April that Cyprus should
sell from its national gold reserves to help its fiscal
——Demand for exchange listed structured products situation, which translated into heavy ETF outflows of
remained lacklustre in first half of 2013. some 175 tonnes during the month. While the pace of
INVESTMENT
selling then somewhat abated, investors remained firmly
Investor interest in certificates and warrants was once on the sell-side, driving total ETF holdings to a multi-
again limited in the first half, particularly when it came to year low of 2,112 tonnes at end-June. The largest decline
its net impact on the physical market and the gold price. during the first half was registered by SPDR Gold Shares,
As we have discussed in previous Surveys, this is strongly which saw an outflow of some 380 tonnes, representing
related to a structural issue with the market in recent almost two-thirds of the period’s total losses.
years, as small retail investors interested in the yellow
metal have tended to shy away from leveraged paper COMMODITIES EXCHANGES ACTIVITY
products and opted for the more conservative option such
as physical bullion bars and coins. ——Trading volumes on major commodity exchanges
posted strong performance in the first half of 2013.
EXCHANGE TRADED FUNDS
COMEX
——Total ETF holdings dropped by 22% in the first half of
2013, to its lowest level since June 2010. Total volumes in gold futures traded on Comex in the
first half of 2013 rose by 10% to just above 26 million
Combined ETF holdings dropped by nearly 580 tonnes contracts, equivalent to a nominal daily average of
during the first half, to 2,112 tonnes at end-June, down 653 tonnes. Open interest (409,081 contracts) by end-
by 22% from a record high of almost 2,700 tonnes at the June was down 2% against a year previously. Analysis
start of the year. In value terms, the decline was even of the data published by CFTC in its weekly reports
more material at 44%, with total holdings at end-June on non-commercial and non-reportable net positions
amounting to approximately $80 billion, while the total in Comex futures can be used as a proxy for investor
13GOLD SURVEY 2013 - UPDATE 1
INVESTMENT IN COMMODITIES Since this time, and as shown in the chart below, the net-length
seen in the gold market has recovered in value terms, and gold
The chart below illustrates quarterly data that Thomson Reuters still remains second only to crude oil on this basis. Indeed it is
GFMS has compiled on net investor positions in 22 futures the more liquid asset classes that have picked up most net-
contracts using CFTC data (non-commercial and non-reportable length since a significant pullback in the second quarter saw
categories). Although this captures only a partial view of 33% of the value of Comex positions lost, equivalent to $24 bn.
the commodities universe, it nonetheless provides a useful
indication of prevailing market trends. The major change in the commodities investor space has been
the large crude oil positions built up in the energy sector, as
So far 2013 has seen a lack of investor confidence across asset a tentative economic recovery has gained traction along with
classes and this has seen a number of swings in investment a substantial risk premium associated with the Middle East.
flows both into and out of commodity markets. In gold the Concern over Iranian, Iraqi and Libyan supply and the possibility
net speculative long position was in July at its lowest since of a regional conflagration stemming from the Syrian conflict
2001 as record short positions were built. During this time have all weighed heavily on markets.
Comex speculative shorts reached all-time highs, equating to
447 tonnes, before a subsequent short-covering rally helped Those that have fallen from favour appear to be the less liquid
prices to recover. The short positions were built alongside the asset classes that had attracted investor interest throughout the
689 tonne exodus from ETF holdings seen between January and credit crisis and recession as capable of providing a short-term
August that saw gold’s thirteen year bull run come to an end. return. Net-length in our Other (primarily soft commodity) and
Livestock categories have seen net-speculative length fall from a
peak of $56 bn late 2010 to $17.8 bn in late August 2013. Those
VALUE OF NON-COMMERCIAL & NON-REPORTABLE NET
commodities still carrying significant speculative long-positions
POSITIONS IN 22 COMMODITY FUTURES CONTRACTS
include soybeans ($12.4 bn), cotton ($3.3 bn) and cocoa ($1.6
140 Other*
bn).
Livestock
120
Energy
100 Silver Many funds have re-weighted towards equity markets in 2013
Gold and this trend is thought likely to continue. Investor interest in
80
US$ Billion
commodities has grown substantially since the commodities
60
boom began however and lack of investment on the supply side
40
of many markets being seen today is already sowing the seeds
20 of the next market shortages. Likewise the potential for higher
INVESTMENT
0 cyclical demand growth in both the developed economics and
-20 developing markets is likely to see continued investor interest in
Q1-08 Q1-09 Q1-10 Q1-11 Q1-12 Q1-13 commodities markets moving forward.
Source: Thomson Reuters GFMS
*Other includes soft, agricultural and dairy commodities, platinum, palladium
and copper
activity on the exchange. The first half of the year was OTHER EXCHANGES
characterised by aggressive long liquidation coupled
with a rapid expansion in gross short positions. From an While global futures trading has been for long dominated
opening of 555 tonnes, net “investor” positions tumbled by Comex, the last few years have witnessed strong
by 80% to below 110 tonnes by late June (the lowest level investor activity on a number of other commodity
since September 2002), and this was a key factor behind exchanges around the world, particularly in China and
the dramatic fall in the gold price over the period. The India, helped by market liberalisation and an increase in
main driver of heavy sell-offs seen in the first half was an investor interest in commodities.
improving US economy along with growing speculation
that the Fed could start to taper its stimulus programme The first half of 2013 saw a significant rise in trading
sooner than expected, which weighed heavily on investor volumes on the Shanghai Gold Exchange (SGE).
attitude towards gold. Meanwhile, an absence of near- Turnover for the spot contract (AU9999 and AU9995)
term inflation pressure and less acute concerns about the more than doubled to reach 1,981 tonnes in the first half
sovereign debt situation in Europe and the United States year. Along with this was a massive increase in delivery
also further undermined gold’s safe haven appeal. of physical gold out of the exchange’s vault and a sharp
rise in daily premia, which hit an all-time-high of $56/oz
14GOLD SURVEY 2013 - UPDATE 1
COMEX, NYSE, LIFFE & TOCOM FUTURES GOLD TRADED ON OTHER EXCHANGES
(total volume in nominal tonne equivalents) (total volume in nominal tonne equivalents)
11.H2 12.H1 12.H2 13.H1 11.H2 12.H1 12.H2 13.H1
Comex 80,914 73,845 62,679 80,981 SGE Spot 942 970 931 1,981
Tocom 8,517 5,940 5,955 7,510 SGE AU(T+D) 3,474 2,176 2,049 3,055
NYSE Liffe* 1,341 631 496 711 SHFE 12,501 6,414 5,420 7,301
*Includes both the 100-ounce and 33.2-ounce contracts. MCX 11,032 6,562 6,042 7,033
Source: Thomson Reuters DGCX 133 257 295 258
Source: Respective exchanges
on 13th May. As will be discussed in detail in the relevant published by the LBMA all indicate that a substantial
parts of this report, such heightened turnover was driven amount of large gold bars (from redemptions of ETFs
by robust physical demand in response to a weakening and sales from unallocated accounts) were shipped to
gold price. Meanwhile, speculative interest was also Switzerland from mid-April to be converted to small bars
elevated, as turnover of SGE’s AU(T+D) contracts posted for markets in Asia and the Middle East. Meanwhile,
a double-digit increase in the first half. China’s Shanghai direct shipments, albeit more restrained, from the United
Futures Exchange registered a 14% year-on-year growth Kingdom to the Far East also jumped, as refineries
in turnover. Furthermore, following a rapid expansion reached full capacity.
of trading volumes in recent years, both exchanges in
Shanghai launched additional evening trading sessions Metal accounts held by western high-net-worth investors
to boost market liquidity more recently. also posted a net rise, largely reflecting gold’s traditional
role as a means of wealth preservation. This was also
India’s Multi-Commodity Exchange (MCX) remained an partly related to the ongoing shift out of gold ETFs, as
important commodity exchange for gold futures trading metal accounts offered lower fees, while transactions
on a global basis. Total volumes in the first half of 2013 in the OTC market were less transparent than in ETFs.
saw a 7% year-on-year increase, which was largely a Interest in gold deposit accounts (a product that targets
reflection of frequent policy changes resulting in a build- retail investors and is not included in our bar and coin
up of speculative and hedge positions by investors. estimates) was also apparent in Turkey and China where
the price fall sparked a robust response. The process was
OTC MARKET also facilitated with ongoing promotion of gold accounts
by local banks, which helped to raise gold’s appeal.
INVESTMENT
——The OTC market witnessed robust volumes of
purchases on a net basis over the January-June PHYSICAL BAR INVESTMENT
period.
—— Price declines push up bar investment by 52%.
As mentioned above, an analysis of components of our
implied net figure indicates that sizeable net investment World demand for physical bars increased a staggering
occurred in the OTC market in the first half of 2013. This 52% during the first half, mainly driven by strong bargain
might seem surprising given that trading in the OTC hunting across all regions on the major price correction.
market is dominated by institutional investors, who
were the key elements behind the steep price retreat. NET “INVESTOR” POSITIONS IN COMEX FUTURES
Nevertheless, this should be viewed within divergent
400 2000
trends in OTC products over the period. Our information Non-reportable
suggests that heavy liquidation in conjunction with a Non-commercial
Net positions (contracts, thousands)
Settlement price
1800
sharp rise in short-side interest were observed from 300
shorter term investors, particularly after the price fell
1600
below the physiologically important $1,500 mark.
US$/oz
200
1400
Over the same period, as a shortage of bullion rapidly
developed in many regional markets and local premia 100
1200
jumped, transactions that were related to physical gold
transfer jumped in the London market. Feedback from 0 1000
our contacts, gold trade data and clearing statistics Jan-10 Jul Jan-11 Jul Jan-12 Jul Jan-13 Jul
Source: CFTC, Thomson Reuters
15You can also read