THE TRANSITION REFERENCE SCENARIOS FOR FINANCIAL ANALYSIS
←
→
Page content transcription
If your browser does not render page correctly, please read the page content below

Supported by:

THE TRANSITION
RISK-O-METER
 REFERENCE SCENARIOS
 FOR FINANCIAL ANALYSIS

 1
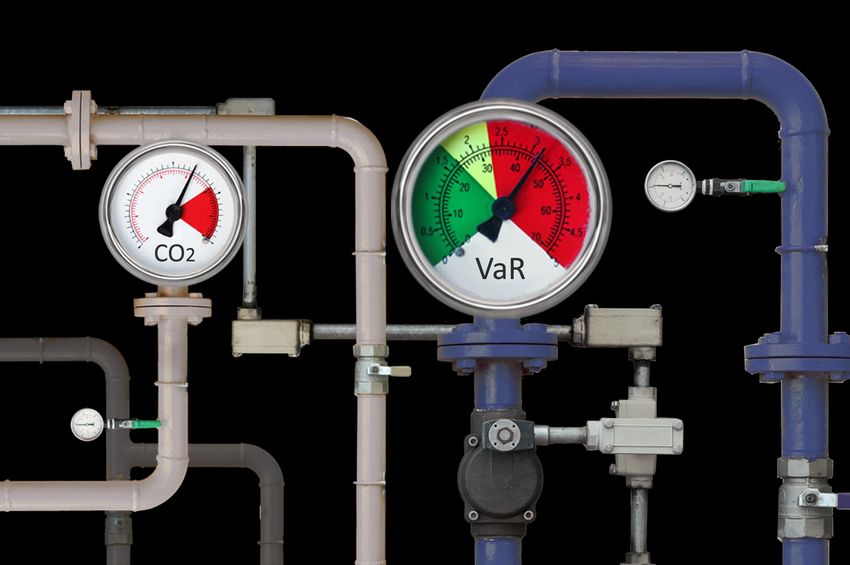
TABLE OF CONTENTS

 EXECUTIVE
EXECUTIVE SUMMARY
 SUMMARY 3 4 STEEL SECTOR 43

PART I : TRANSITION RISK SCENARIOS FRAMEWORK Overview 43
 4.1 Steel production 44
1 INTRODUCTION 7 4.2 Steel share primary and secondary steel 46
 4.3 Energy intensity 47
1.1 The 2°C scenario / transition risk toolbox 8 4.4 CO2 intensity 48
1.2 Risk scenarios vs. traditional scenarios 9 4.5 Crude steel price 49
 4.6 Raw material prices 50
2 DESIGNING 2°C AND TRANSITION RISK 10 4.7 Allocation of free CO2 allowances 51
 SCENARIOS
 5 CEMENT SECTOR 52
2.1 From traditional transition to transition 10
 risk scenarios Overview 52
2.2 Transition scenarios in practice 12 5.1 Cement production 53
2.3 Indicators out of scope 15 5.2 Clinker to cement ratio 55
 5.3 Energy intensity for clinker production 56
3 USE CASES 16 5.4 Share of alternative fuel use 57
 5.5 CCS deployment 58
3.1 Overview 16 5.6 CO2 Intensity 59
3.2 Alternative use cases 18 5.7 Secondary fuel prices 60
 5.8 Allocation of free CO2 allowances 61
4 CONCLUSION 19
 6 AVIATION SECTOR 62

PART II : SECTOR SCENARIOS’ VALUES FOR RISK ANALYSIS Overview 62
 6.1 Demand 63
1 CROSS SECTOR INDICATORS 21 6.2 Fuel Efficiency 65
 6.3 Biofuel penetration 66
 Overview 21 6.4 Jet fuel prices 67
1.1 Crude oil prices 22 6.5 Carbon credit mandate 68
1.2 Natural Gas prices 23 6.6 Fuel efficiency standards 69
1.3 Coal prices 24
1.4 Electricity prices 25 7 SHIPPING SECTOR 70
1.5 Carbon prices 26
 Overview 70
2 POWER UTILITIES SECTOR 27 7.1 Shipping transport demand 71
 7.2 Fuel efficiency 73
 Overview 27 7.3 Alternative fuels penetration 74
2.1 Electricity Generation 28 7.4 Marine fuel prices 75
2.2 Electricity Capacity 30 7.5 Efficiency standards – EEDI 76
2.3 Levelised Cost of Electricity 32 7.6 Efficiency standards – GHG Rating 77
2.4 Subsidies 34
2.5 Effective carbon rates 35 8 BIBLIOGRAPHY 78

3 AUTOMOTIVE SECTOR 36 NOTES 81

 Overview 36 ANNEX 1 Commodity Demand Projection 82
3.1 Sales by Powertrain 37 ANNEX 2 Electricity Generation And Capacity 84
3.2 Low-weight composites costs 39 ANNEX 3 Levelised Cost Of Electricity 86
3.3 Battery costs 40 ANNEX 4 Subsidies In Power Generation 87
3.4 Fuel Efficiency Standards 41 ANNEX 5 Calculation Of CORSIA Offsets 88
3.5 Effective Carbon Rates 42

2
EXECUTIVE SUMMARY
This report constitutes the first attempt to develop transition scenarios involving over 30
parameters across 8 sectors directly tailored for financial risk and scenario analysis by
companies, equity and credit research analysts, and financial institutions.
The report contains two transition risk scenarios – a limited climate transition (LCT) scenario associated with 3°-4°C
decarbonisation range and an ambitious climate transition (ACT) scenario, seeking to approximate an outcome
associated with a 2°C transition and building in particular on the 2°C scenarios of the International Energy Agency
(IEA). The report develops over 30 individual risk parameters across 8 sectors (fossil fuels, electric power, automobile,
cement, steel, aviation, and shipping). You can get access to the dynamic version of the indicators through the ET Risk
project Scenario Selector online tool here. Part I presents the analytical framework for the scenarios. Part II provides
the detailed parameters and indicators for use in financial modelling.

The report responds to the fact that traditional reference decarbonisation scenarios are
not designed for financial analysis.
‘Traditional’ reference decarbonisation scenarios are a core staple of climate policymaking and the dialogue around
climate goals. There are a range of actors involved in developing these scenarios in the annual reports of private and
public companies or as part of commissioned research. Notable examples include the scenarios of international
organizations (e.g. IEA), NGOs (e.g. Greenpeace, WWF), and the private sector (e.g. Shell, Enerdata). The challenge
with these so-called traditional decarbonisation scenarios however is that they have not been designed with the
question of risk analysis at company or financial market level in mind. By extension, they exhibit a number of key
challenges with regard to their use for risk analysis, in particular in regard to the design of the indicators, their
coverage and scope, their lack of country-level specificity, as well a lack of agreement on a common reference
scenario.

The report overcomes this constraint by enhancing and enriching decarbonisation
scenarios. It can be used for free by any third party seeking to respond to the Financial
Stability Board Task Force on Climate-related Financial Disclosures recommendations,
shareholder pressure on scenario analysis, and potential regulatory guidance.
The report creates a framework around this process that can be replicated by interested third-parties, by defining a
five step approach (visualized below). This approach uses traditional decarbonisation scenarios as a base, determines
the scope of indicators and sectors (as well as country granularity), and then determines the scenario belief with
regard to the trade-offs between policy and market drivers, as well as the associated ambition associated with each. It
then defines the key sources for enhancement used to expand and, where required, independently model missing
indicators. The objective with this framework is thus not to build a general equilibrium, cross-sectorially consistent
climate scenario, but rather to collate the best evidence for each sector as to its potential evolution over time.

The next two pages summarize the modelling choices of each scenario, as well as the scope of indicators and
geographic granularity provided for each. For indicators values refer to Part II.

 3
TABLE 0.1. MODELLING PRINCIPLES OF THE TRANSITION SCENARIOS

 Risk factor Limited Climate Transition Scenario (LCT) Ambitious Climate Transition Scenario (ACT)
 • Relies in the first instance on the IEAs Energy • Relies on the IEA ETP 2D scenario for
 Technology Perspectives (ETP) 4DS Scenario for parameters across all industries, where
 parameters across all industries, where available, as available, as well as the IEA WEO 450 scenarios
 well as the IEA WEO NPS scenario where required. where required.

 • Additional parameters are sourced from third-party • Additional parameters are sourced from third-
 literature on an ad-hoc basis. party literature on an ad-hoc basis based.

 • Where IEA figures are not provided at country level, • Country estimates are reconstructed using
 country estimates are reconstructed using estimates country level estimates from third-party
 Production &
 from third-party sources and internal modelling. sources, where figures are not provided with
 technology the necessary granularity.
 NB: Since the LCT doesn’t explicitly solve for a specific
 temperature limit of global warming, a range of NB: The ACT Scenario can use a range of
 decarbonisation scenarios (e.g. Greenpeace) can be decarbonisation scenarios without prejudice to the
 used without prejudice to the other assumptions, other assumptions. Any user can thus replace the
 assuming policy targets are integrated. Any user can IEA with an alternative reference model if desired,
 thus replace the IEA with an alternative reference assuming it also solves for an ambitious climate
 model if desired, assuming it also solves for an limited outcome (e.g. 2°C or less)
 climate outcome (e.g. 3°C to 4°C )

 • Uses conservative assumptions around technology • Uses the most optimistic assumptions around
 development curves that can be identified in technology development curves that can be
 industry and / or academic literature. These can identified in industry and / or academic
 either be directly sourced from third-party cost literature.
 curves or modelled after historical examples of cost
 curves (e.g. fall in the cost of solar PV 2010-2015). • Commodity price assumptions are largely taken
 from the IEA, although ‘alternative’
 Market prices • Commodity price assumptions are largely taken assumptions may be provided based on third-
 from IEA as well as country-specific energy prices party literature.
 where available.
 • For commodity price curves not directly
 • ‘Alternative’ assumptions may be provided based on provided in the IEA published material, third
 third party literature. party literature is applied.

 • Concrete policies and measures are derived for each • The scenario generally does not differ from the
 sector individually based on IEA’s indications (e.g. policy mandates elaborated in the LCT.
 subsidies in accordance with climate targets, However, in some cases, it provides an
 National Determined Contribution targets additional assumption around policy
 integration into the model), where available, and convergence to the most ambitious policy
 complemented with expert interviews and third- mandates. The exception to this approach
 party literature. involves carbon prices, which are significantly
 more ambitious.
 Policy mandates,
 • It is assumed that policy makers will continue with
 incentives & taxes “carrots and sticks” and will only use command and • In terms of incentives and taxes, the scenario
 control measures when targets are not reached. In will be limited to modelling those policy
 this way, market intervention is limited while still incentives and taxes that accrue directly to the
 complying with country-specific climate targets. companies, for which risks are modelled,
 assuming that the impact of all ‘consumer
 demand’ incentives (e.g. subsidies on electric
 vehicle purchases, etc.) are captured in the
 production & technology parameters.
 • Limited to a qualitative approach, with no quantitative elements. This will cover other macroeconomic
 trends and other types of risk (e.g. litigation). A separate paper has been developed in partnership with
 Unconventional the law firm Minter-Ellison on litigation risks in financial markets.
 risks

4
TABLE 0.2: KEY INDICATORS

 Sector Type Indicator Page Geography Main Sources
 Crude oil price (USD/bbl) 22 World IEA ETP
 Natural gas price (USD/MBtu) 23 US, EU IEA ETP
 Market Pricing
 Coal prices (USD/ton) 24 World IEA ETP
Cross-sector
 Electricity prices (2015 EUR/MWh) 25 BR, MX, USA, FR, DE, IT IEA WEO, Third-party source
 Policies costs and
 Carbon prices (2015 USD / T-Coeq) 26 US, EU, BR IEA WEO
 incentives

 Production & Electricity generation (TWh) 29 World, BR, MX, USA, FR, DE, IT IEA ETP, EC Trends 2050
 Technology
 Power Electricity capacity (GW) 31 World, BR, MX, USA, FR, DE, IT IEA ETP, EC Trends 2050
 Utilities Market Pricing Levelised costs of electricity (€/MWh) 32 World, BR, MX, USA, FR, DE, IT NREL
 Policies costs and Subsidies (€/Mwh) 34 US NREL
 incentives Effective carbon rates ($/tCO2) 35 BR, MX, USA, FR, DE, IT IEA WEO
 Production &
 Sales by powertrain (%) 38 World IEA
 technology
 Carbon fibre (USD/pound) 39 World NREL
Automotive Market Pricing
 Battery costs (USD/kWh) 40 World Third-party source, BNEF
 Policy costs and Fuel efficiency standards (%) 41 BR, MX, USA, EU ICCT
 incentives Effective carbon rates(EUR/tCO2) 42 World, BR, MX, USA, FR, DE, IT OECD, Third-party source
 Crude Steel production (Mt) 45 World, BR, MX, USA, FR, DE, IT IEA ETP, EC
 Production & Share of primary/secondary steel(%) 46 World, BR, MX, USA, FR, DE, IT IEA ETP, EC
 technology Energy Intensity (GJ / t crude steel) 47 World, BR, MX, USA, FR, DE, IT IEA ETP
 Carbon Intensity (t CO2 / t crude steel) 48 World, BR, MX, USA, FR, DE, IT IEA ETP
 Steel
 Crude Steel Price (USD / ton) 49 World Third-party source
 Market Pricing
 Raw Materials Prices (USD / ton) 50 World Third-party source
 Policy costs and Allowances of free CO2 allowances(%
 51 BR, EU, MX, USA Third-party source
 incentives of total CO2 direct emissions)
 Cement production (Mt) 54 World, BR, MX, USA, FR, DE, IT IEA ETP, EC Trends 2050
 Clinker to cement ratio (%) 55 World, BR, MX, USA, FR, DE, IT IEA ETP
 Energy intensity for clinker production
 Production & 56 World, BR, MX, USA, FR, DE, IT IEA ETP
 (GJ / t clinker)
 technology
 Share of alternative fuel use (%) 57 World, BR, MX, USA, FR, DE, IT IEA ETP
 Cement
 CCS deployment (%) 58 World, BR, MX, USA, FR, DE, IT IEA ETP
 CO2 Intensity (t CO2 / t cement) 59 World, BR, MX, USA, FR, DE, IT IEA ETP
 Market Pricing Secondary Fuels (USD/ton) 60 World Third-party source
 Policy costs and Allowances of free CO2 allowances(% IEA ETP and Third-party
 61 BR, EU, MX, USA
 incentives of total direct emissions) source
 IEA ETP and Third-party
 Demand (passenger-km) 64 World, BR, MX, USA, EU
 source
 Production & Fuel efficiency (g fuel burned /revenue
 65 World ICCT
 technology passenger-km)
 Aviation ICAO IEA ETP and Third-party
 Biofuel penetration (%) 66 BR, MX, USA, FR, DE, IT
 source
 Market pricing Jet fuel prices (USD / gallon) 67 World IEA ETP
 Policy costs and Carbon credit mandates (USD/tCO2) 68 World ICCT, ENVI
 incentives Fuel efficiency standards (kg/km) 69 World ICCT
 Shipping Transport Demand (G ton km
 72 World IMO
 Production & / year)
 technology Fuel efficiency (kJ/tonne-km) 73 World Third-party source
 Alternative fuels penetration (%) 74 World Third-party source
 Shipping
 Marine Fuel prices (fraction to 2010
 Market Pricing 75 World Third-party source
 HFO price) and (USD/GJ)
 Policies costs and Efficiency Design Regulations 76 World Third-party source
 incentives Emission/Fuel standard 77 World Rightship

 5
PART I

 TRANSITION RISK
SCENARIOS FRAMEWORK

 6

1 INTRODUCTION

This report constitutes the first attempt to develop transition scenarios directly tailored for financial risk and
scenario analysis by companies, equity and credit research analysts, and financial institutions.

The report contains two transition risk scenarios – a limited climate transition (LCT) scenario associated with 3°-4°C
decarbonisation range and an ambitious climate transition (ACT) scenario, seeking to approximate an outcome
associated with a 2°C transition and building in particular on the 2°C scenarios of the International Energy Agency
(IEA). The report develops over 30 individual risk parameters across 8 sectors (fossil fuels, electric power, automobile,
cement, steel, aviation, and shipping). Section 1 presents the analytical framework for the scenarios. Section 2
provides the detailed parameters and indicators for use in financial modelling.

Parameters for both transition risk scenarios were developed on the basis of best available public information from
multiple sources including academic literature, industry experts, government announcements and commercial
databases. The objective was not to build a general equilibrium, cross-sectorially consistent climate scenario, but
rather to collate the best evidence for each sector as to its potential evolution over time. The objective was not to
build a general equilibrium, cross-sectorially consistent climate scenario, but rather to collate the best evidence for
each sector as to its potential evolution over time. The transition risk scenarios can be used by companies for internal
scenario analysis as well as scenario analysis performed as part of their disclosing obligations for key business
segments, equity and credit research analysts, as well as portfolio managers for portfolio risk assessments. All
information contained in this report is also available on www.et-risk.eu in combination with a transition risk scenario
selector tool.

The development of this report and scenario was fundamentally driven by a recognition of the fact that the current
suite of decarbonisation scenarios, as developed by the International Energy Agency and others, are not designed for
risk analysis. In focusing on GHG emissions and technology pathways, they lack a range of key parameters that would
be required to understand both the volume and price impacts that companies across a range of sectors may face
under a 2°C transition. As such, this report does not stand in competition to existing modelling frameworks, but simply
seeks to reframe them to make them usable for financial risk and in particular scenario analysis.

The creation of transition risk scenarios for scenario analysis responds to a range of drivers pushing for scenario
analysis by companies and financial institutions.

• First regulatory initiatives are calling for climate scenario analysis in reporting, notably the French Energy
 Transition for Green Growth Law (2015), which calls on investors to disclose “any element enabling a relevant
 assessment of the entity's exposure to climate change-related risks and its contribution to compliance with the
 international objective to limit global warming...” (Article 173 2015). Best disclosure practices were later, in 2016,
 highlighted through the International Award on Investor Climate-related Disclosures co-organized by the French
 Environment Ministry, the French Treasury, and 2° Investing Initiative. Since then, other governments have
 explored the possibility of adapting such frameworks to their national context.

• Investor networks and coalitions are urging companies to conduct and disclose 2°C scenario analysis, notably
 through the Aiming for A coalition and engagement by US investor association Ceres.

• Working transversally, the recommendations of the Task-force on Climate-related Financial Disclosures (TCFD) of
 the Financial Stability Board have escalated internationally the discussion around scenario analysis for companies in
 both the financial and non-financial sectors. The recommendations conclude that “The Task Force believes that all
 organizations exposed to climate-related risks should consider (1) using scenario analysis to help inform their
 strategic and financial planning processes and (2) disclosing how resilient their strategies are to a range of plausible
 climate-related scenarios.” (TCFD 2017)

• International standardization bodies are exploring avenues towards defining a common framework for assessing
 and reporting investments and financing activities related to climate change. This is the case of the recently
 launched ISO 14097 working group, which is also set to reference scenario analysis.

 7
1.1 THE 2°C SCENARIO / TRANSITION RISK TOOLBOX

 2°C and transition risk scenario analysis requires three types of tools.

 The first step to understanding how transition risk scenarios operate involves understanding how they fit into the
 general scenario and risk analysis framework. From a transition risk perspective, this framework involves three
 elements that together constitute what the authors of this report call the Energy Transition Risk Toolbox (2dii 2016a).
 These three elements are: i.) transition risk scenarios, ii.) transition risk data (company, financial, and asset level), and
 iii.) transition risk models (see Fig. 1.1):

 Transition risk scenarios. The first tool is the definition of the actual external risk driver or shock i.e. the transition risk
 scenario that generates the risks for companies. This tool is at the focus of this report. Developing transition risk
 scenarios that are actually usable and material for risk analysis requires enhancing traditional decarbonisation
 scenarios, which as a rule are not designed with risk management considerations in mind.

 The Energy Transition Risk Toolbox developed by the ET Risk consortium and outlined in this report frames two types
 of transition risk scenarios: i) an ambitious climate transition scenario designed to mirror or approximate a 2°C
 transition and using as its base or reference the ‘~2°C scenarios’ of the IEA (2D & 450 scenario); and ii) a limited
 climate transition scenario representing a world with extended current and planned policies and technology trends
 and using as its basis the IEA (New Policy Scenario & 4D scenario). Scenarios are set to cover a set of key indicators,
 notably policy costs and incentives, market pricing, and production & technology. They also situate themselves in the
 context of broader macroeconomic and social trends. Sectors covered in this report include fossil fuels (cross-sectoral
 indicator), cement, steel, electric power, automobile, shipping, and aviation.

 Transition risk data. The second tool is transition risk data at sector, company, and asset levels in order to inform the
 exposure to transition risk scenarios by companies, their potential impact, and the ability of companies to mitigate
 this impact. Notably, these data include asset-level production and investment data, company-level data (e.g. R&D
 expenditures), and financial data. A sister paper is planned developing on the question of asset-level data as part of
 the ET Risk project that is set to be launched in Q3 2017.

 Transition risk models. The final tools are the models that combine transition risk scenarios and transition risk data to
 calculate financial risk. Partners for transition risk models in the context of the project are S&P Global in its credit risk
 model, Kepler-Cheuvreux in its equity valuation models, the CO-Firm in its company financial risks CIimateXcellence
 Model and 2°ii in its existing 2°C portfolio scenario analysis model.

 FIG 1.1 ASSESSING TRANSTION RISK SCENARIOS ACROSS THE INVESTMENT CHAIN (SOURCE: AUTHORS)
 SECNARIO

 Macroeconomic
 trends // Policy costs and Production &
 Market pricing
 Legal & incentives technology
 reputational

 Adaptive capacity
 DATA

 Company level
 Asset level data / Dynamic Financial data
 data
 capabilities
 MODELS

 Company level
 Portfolio models
 Valuation models Credit risk models impacts (Climate
 & analytics
 Xcellence Model)

8

1.2 RISK SCENARIOS VS. TRADITIONAL DECARBONISATION SCENARIOS

Traditional decarbonisation scenarios are not designed for financial analysis.

‘Traditional’ decarbonisation scenarios are a core staple of climate policymaking and the dialogue around climate
goals. There are a range of actors involved in developing these scenarios in annual reports of private and public
companies or as part of commissioned research, notably international organizations (e.g. IEA), NGOs (e.g.
Greenpeace, WWF), and the private sector (e.g. Shell, Enerdata).

The challenge with these so-called traditional decarbonisation scenarios however is that they have not been designed
with the question of risk analysis at company or financial market level in mind. By extension, they exhibit a number of
key challenges with regard to their use for risk analysis:

• Indicators not designed for risk assessment. Most of the current economic decarbonisation scenarios are designed
 to show the technical feasibility and / or economic viability of various roadmaps that solve for a climate-related
 constraint (e.g. carbon budget). They are thus more interested in indicators that speak to that constraint, rather
 than risk-related production metrics that reflect demand changes. One example is the International Energy Agency
 annual updates on the evolution of the automobile sector where indicators are reported as ‘stocks’ of cars on the
 road (relevant for the carbon budget), rather than annual production (relevant from a risk perspective). It is critical
 to note here that frequently these scenarios will solve for the relevant indicators, but not communicate them (e.g.
 the IEA provides for annual production figures in their model, but doesn’t integrate these figures into the
 publication).

• Coverage on indicators incomplete. Given the focus on economic pathways, decarbonisation scenarios may miss
 indicators that are relevant from a risk perspective. For example, battery costs or electricity prices are a critical
 component for understanding the margin impacts of decarbonisation scenarios on automobile manufacturers or
 cement companies respectively. These indicators however are lacking in most if not all reported scenarios.

• Lacking country-level specificity. Bottom-up risk analysis will involve looking at country-specific trends in order to
 understand specific risks to companies. Many scenarios lack this granularity and provide – for most countries – only
 regional or in some cases only global figures.

• Lack of agreement on common reference scenarios. Finally, for some use cases related to risk analysis (e.g.
 comparability of disclosures, stress-testing of market and network risks), ‘standardized’ (i.e. indicators covered and
 granularity) reference scenarios may be desirable. At this stage, these standards do not exist even within the most
 commonly used reference scenarios such as the IEA.

This gap creates a significant challenge for stakeholders wishing to respond to the growing momentum around 2°C
scenario and risk analysis highlighted in the beginning of this report.

In response, this research stream on the Energy Transition Toolbox seeks to develop publicly-available 2°C aligned and
‘limited climate transition’ decarbonisation scenarios that can be used for risk analysis. These scenarios will build on
and use as the starting point existing ‘traditional’ decarbonisation scenarios, notably in the two scenarios developed
here the work of the IEA, and then enrich and expand these scenarios to make them usable for risk analysis.

 9
2 DESIGNING 2°C AND TRANSITION RISK SCENARIOS

 2.1 FROM TRADITIONAL TRANSITION TO TRANSITION RISK SCENARIOS

 The following summarizes the key steps required to enrich and expand upon a traditional decarbonisation
 scenarios to make it usable as a risk scenario.

 • Choosing the scenario base. The first step, intuitively, is to choose the starting point in terms of the traditional
 scenario that should be enhanced and expanded for financial risk analysis. The choice of the scenario base depends
 on the sectors and geographies that the user wishes to cover, the analysts’ belief about the likely level of ambition
 desired for the use case (e.g. for stress-testing exercises, it may make sense to apply more ambitious scenarios, for
 normal market analysis, it may make sense to apply the ‘most likely’ outcomes), and the associated technology
 beliefs (e.g. views about the deployment of Carbon Capture and Storage (CCS) and nuclear). The table below
 summarizes some of the pros and cons of using different reference scenarios.

 Type of scenario Pros Cons
 • Historically misaligned with trends
 • Widely accepted by market
 International Energy Agency • High reliance on nuclear and CCS
 • Relatively comprehensive in terms of
 (annual) • Limited granularity for industry and
 sector coverage
 transport
 • More aligned with renewable trends • Not updated annually
 Greenpeace (2015) • Doesn’t rely on carbon capture and • Lack of market acceptance given branding
 storage • Limited sector coverage
 • Linked to bottom-up industry trends • Not directly connected to climate outcome
 BNEF (ongoing)1 • Higher reliance on ‘market optimistic (relevant for 2°C scenario analysis objective)
 trends’ around deployment • Limited to power and auto transport
 • High level of granularity for the
 shipping sector • Limited to shipping sector
 ICCT shipping (2013)
 • More closely aligned with indicators • Not updated annually
 relevant for risk analysis

 • Scope of indicators (sectors, type, geography, time horizon). The second choice once the scenario base has been
 identified is to decide on the scope of the indicators in terms of sectors and type. The sector indicators may be
 limited to one or more sectors, and may also include ‘cross-sector’ indicators that drive risk within the sector. This
 document is written very much for sector analysts and with sector focus. For example, understanding financial
 risk for the utility sector requires an understanding of fossil fuel prices and associated production plans, indicators
 that are risk indicators both for the fossil fuel sector itself and the utility sector. In addition to the choice of
 indicators, the scope also needs to be framed in terms of the types of indicators that are included. This depends on
 the sophistication and calibration of the risk analysis and the nature of the model that is being applied, as well as
 the capacity to correlate transition risk scenarios with company level data to identify their specific impacts.

10
Beyond macro trends and indicators that are implied in every model, there are four categories that can be
considered:

• Production & technology parameters relate to all parameters that comment both on the volume of goods and
 services bought and sold annually (e.g. electric vehicle vs. petrol vehicles) and the technologies / fuels associated
 with the production of these goods and services (e.g. renewable kWh vs. coal kWh, technology differences in
 cement production, etc.). Production in effect captures demand.

• Market price parameters relate to all parameters that comment on the expected evolution of non-policy related
 prices of goods and services, both for commodities (e.g. oil prices, gas prices, etc.) and various technology inputs
 in the production process (e.g. batteries, composite materials, etc.). As for most scenarios, technology input price
 shifts are exogenous as any indirect policy effects (e.g. R&D incentives) are assumed to be already captured. This
 category also covers carbon prices associated with emissions trading schemes, since these act technically as
 market-driven price parameters.

• Policy mandates, incentives & policy cost parameters relate to all policy-related performance standards and
 production standards (e.g. fuel efficiency standards, electric vehicle sale mandates), tax incentives as well as
 policy costs. These can be defined either as a specific incentive or as so-called ‘effective carbon rates’, which
 account for a range of policy instruments that can be aggregated to yield an effective cost on carbon.

• Unconventional parameters relate to all other parameters that may act as risk drivers for companies and financial
 assets. Notable examples include litigation risks and costs, as well as potential reputational assumptions.

In addition to identifying the scope of sector and types of indicators, the scenarios also need to be framed in terms
of their geographic granularity (and coverage) as well as their time horizon. The choice here similarly depends on the
type of companies and sectors covered in the risk analysis, with some sectors more globally integrated (e.g. oil & gas)
and others relatively local (e.g. electric power). As will be highlighted in the course of the scenario discussion, the key
challenge with geographic granularity is that the type of granularity generally required for risk analysis for some
sectors (e.g. country level) is rarely modelled and if it is modelled it covers only a sample of key geographies (e.g.
United States, China, etc.). The time horizon then depends on the time horizon of the model, which is three to five
years in some cases and +20 years in others. One critical issue to flag in the context of time horizons is the fact that
most scenarios exhibit limited ‘disruption’ in the short-term (e.g. next 5 years) as they orientate themselves at least in
part towards an existing pipeline of investment plans. This implies the need to either consider more disruptive short-
term scenarios or extend the time horizon of the model in order to capture fully the whole suite of transition risks.

• Policy vs. market. At this stage, the scenarios are prepared for enhancement and expansion in order to make them
 usable for financial analysis. The enhancement – beyond the technical and methodological choices inherent in the
 development of additional indicators – will in most cases need to emphasize ‘market pricing’ and ‘policy costs &
 incentives’ since those tend to be the indicators least developed in the ‘traditional’ decarbonisation scenarios or
 most poorly represented with regard to their usability as a next step. As the enhancement focuses on these two
 aspects, in addition to any potential missing indicators for the other two categories (e.g. production & technology
 and Unconventional), a conflict arises between the expected ambition of each. Thus, a scenario more optimistic in
 terms of the development of the levelised cost of solar PV electricity or battery prices would be expected to have
 lower levels of policy intervention, since less policy intervention is required as these technologies become cost-
 competitive. Similarly, higher levels of policy intervention may be expected should market prices and technology
 maturity with regard to low-carbon technologies evolve at a less ambitious rate. The following illustrative example
 demonstrates the interface between these two elements. To note, the ambitious climate transition scenario
 developed in this report seeks as a rule to align with a ‘market optimist’ view.

 Low-carbon technology High-carbon technology Remaining policy incentive
 (€/MWh) (€/MWh) (€/MWh)
 Expected costs of deployment –
 6 5 1
 Market optimist
 Expected costs of deployment
 10 5 5
 market pessimist

 11
• Sources for enhancement – consistency or detail. The majority of risk-related indicators identified in the research
 for this report are modelled by someone, somewhere, and in some cases by multiple different organizations. This
 implies a choice as to the indicators that will be used to enhance the scenario. The choice depends on the same
 type of factors highlighted earlier (i.e. scenario base, scope and type of indicators) with regard to the choice of
 scenario, notably the credibility of the organization that parametrized the indicator, its accessibility, and its
 alignment with the belief of the scenario (e.g. market optimist / pessimist). Crucially, unless a comprehensive
 general equilibrium model was designed to build both the scenario base and the enhanced indicators, these
 enhanced indicators may not even be consistent with the original scenario. Given that such a scenario doesn’t
 exist, transition risk scenarios either have to be limited to the indicators that do exist in the scenario base, making
 them only marginally useful for risk analysis, or they have to be enhanced, recognizing that this may generate
 inconsistency across sectors. Within a sector there is the most need for consistency and it is the sector level that
 counts in company analysis. At a second level, consistency across sectors is needed for portfolio analysis and
 assessment of multi-sector company exposure. This point is crucial to consider when reading the sector specific
 sections and is highlighted when relevant.

 • Modelling missing indicators. The final step then is to potentially model or interpolate any missing sector
 indicators not identified in the literature. This step depends on the extent to which indicators are covered in the
 literature. The types of choices here are obviously wide-ranging, from simple interpolation / extrapolation to more
 sophisticated models.

 2.2 TRANSITION SCENARIOS IN PRACTICE

 Ambition choice. This report develops two transition risk scenarios: An Ambitious Climate Transition (ACT) scenario
 designed to mirror or approximate a 2°C transition and a Limited Climate Transition (LCT) scenario representing a
 world with extended current and planned policies and technology trends. Both use the IEA scenarios as a base for
 enhancement. These two different visions of the world generally capture investors views on efforts made or to be
 made against climate change. A survey run by the authors to the investment community in December 2016 showed
 that 3 out of 39 participants believed that either the 2°C climate target was going to be met or was very likely to be
 met, while 36 participants expressed that high efforts were needed to meet the target (see Figure 2.1).

 Furthermore, a side event at the Industrial Summer Study 2016 hosted by the European Council for an Energy Efficient
 Economy (ECEE) was organized, a questionnaire listing three to five different developments of key indicators until
 2050 (i.e. CO2-allowances price, crude oil price, renewable electricity share, electricity share in energy for transport,
 share of CCS in electricity generation, share of CCS of total industrial CO2 emissions) was distributed among
 participants. No indication that some of the developments were derived from IEA data was provided. 22 of 57 valid
 responses found developments consistent with IEA 4DS as most probable for Europe. 18 of 57 valid found
 developments consistent with IEA 2DS as most probable for Europe. 17 of 57 valid responses, less the one third, found
 a development other than IEA data more probable (see Figure 2.2).

 FIGURE 2.1 SURVEY EXTRACT: PERCEPTION ON THE FIGURE 2.2 QUESTIONAIRE EXTRACT: CONSISTENCY OF
 PROGRESS TOWARDS A 2 DEGREE COMPATIBLE DEVELOPMENTS OF KEY INDICATORS UNTIL 2050 WITH
 WORLD (SOURCE: AUTHORS) IEA SCENARIOS (SOURCE: AUTHORS)
 A. Very good progess
 3% 5% and goals will be
 overshoot A. Consistent
 with respect to
 30% IEA 4DS
 B. Sufficient progress developments
 and are likely to meet 39%
 26% goals
 B. Consistent
 with respect to
 C. Insufficient IEA 2DS
 progress and some developments
 additional efforts are
67% needed to meet goals
 C. Other than
 D. Insufficient IEA data are
 progress and a 32% more probable
 disruptive change is
 needed to meet goals
12
Sector choice. The scenarios develop here focus on 8 GHG-intensive business activities, namely: oil&gas, coal, electric
power, automobile, aviation, shipping, cement and steel sectors. In addition, the scenario provides a range of cross-
sectoral indicators that act as risk drivers for these sectors and can be used for financial analysis for fossil fuel
companies (e.g. oil prices, oil production, carbon tax, etc.).

The choice of sectors is based on both technical feasibility and materiality questions. Thus, these sectors are among
those to which a typical financial institution will have the largest exposures in their credit and equity portfolios.
Moreover, they are those for which the IEA scenarios have the most developed base to build upon. In addition, from
an Energy Transition Risk Toolbox perspective, they can best be linked to asset level and financial data, as well as
mapped through supply chains. Arguably the biggest gaps in sector choice involve real estate, agriculture, and
forestry, areas that will require further research in the future. Scenarios are also missing for sectors for which no
traditional decarbonisation scenario exists (e.g. pharmaceuticals, IT).

Geography choice. The scenarios developed here present results for six countries: Brazil (BR), France (FR), Germany
(DE) and Italy (IT), Mexico (MX) and USA. In addition, global indicators are provided for all relevant parameters in
order to allow for both a more macro financial analysis (not considering geographic idiosyncrasies and exposures) as
well as a country level deep-dive. A survey run by the authors to the investment community showed that 6 out of 13
participants think that country granularity is needed in transition scenarios (see Fig 2.3).

The country selection was based on the most significant geographic exposures (at production and sales level) for the
companies in the key sectors covered in the scenarios in the MSCI World. Thus, despite their materiality for climate
change, China and India were not considered in terms of country level trends, although their demand profile will be
captured in the global indicators The limitation on country analysis provided here implies that for certain companies
these scenarios will only be of limited use, given that they may have exposures to other countries. Further analysis
across a broader set of countries is planned for 2018.

Time horizon choice. The scenarios developed here cover trends until 2040. The time horizon selection considered
current practices in financial risks analysis and the need to capture risks materializing in the medium-to-long-term
moving forward (2dii 2017a). A survey run by the authors to the investment community showed that 10 out of 13
participants think that the temporal resolution needed for transition scenarios should be either 5 or 10 years (see Fig.
2.4).

Part II provides the detailed scenario parameters derived based on the choices described above and the specific
modelling choices by type of indicator further detailed on the next page. Page 5 provides specific details as to the
indicators presented in Part II and where they can be found in the report.

FIGURE 2.3 SURVEY EXTRACT: GRANULARITY LEVEL FIGURE 2.4 SURVEY EXTRACT: TEMPORAL RESOLUTION
REQUIRED IN RISK ASSESSMENT (SOURCE: AUTHORS) REQUIRED IN TRANSITION SCENARIOS (SOURCE:
 AUTHORS)

 8%

 23%

 Country 23% 38% 5 year

 46% Regional 10 year

 Sub-national Annual

15% Other
 Global

 15% 31%
 13
 13
TABLE 2.1. MODELLING PRINCIPLES OF THE TRANSITION SCENARIOS

 Risk factor Limited Climate Transition Scenario (LCT) Ambitious Climate Transition Scenario (ACT)
 • Relies in the first instance on IEA Energy Technology • Relies on the IEA ETP 2D scenario for
 Perspectives (ETP) 4D Scenario for parameters parameters across all industries, where
 across all industries, where available, as well as the available, as well as the IEA WEO 450 scenarios
 IEA WEO NPS scenario where required. where required.

 • Additional parameters are sourced from third-party • Additional parameters are sourced from third-
 literature on an ad-hoc basis. party literature on an ad-hoc basis based.

 • Where IEA figures are not provided at country level, • Country estimates are reconstructed using
 country estimates are reconstructed using estimates country level estimates from third-party
 Production &
 from third-party sources and internal modelling. sources, where figures are not provided with
 technology the necessary granularity.
 NB: Since the LCT doesn’t explicitly solve for a specific
 temperature limit of global warming, a range of NB: The ACT Scenario can use a range of
 decarbonisation scenarios (e.g. Greenpeace) can be decarbonisation scenarios without prejudice to the
 used without prejudice to the other assumptions, other assumptions. Any user can thus replace the
 assuming policy targets goals are integrated. Any user IEA with an alternative reference model if desired,
 can thus replace the IEA with an alternative reference assuming it also solves for an ambitious climate
 model if desired, assuming it also solves for an limited outcome (e.g. 2°C or less)
 climate outcome (e.g. 3°C to 4°C )

 • Uses conservative assumptions around technology • Uses the most optimistic assumptions around
 development curves that can be identified in technology development curves that can be
 industry and / or academic literature. These can identified in industry and / or academic
 either be directly sourced from third-party cost literature.
 curves or modelled after historical examples of cost
 curves (e.g. fall in the cost of solar PV 2010-2015). • Commodity price assumptions are largely taken
 from the IEA, although ‘alternative’
 Market prices • Commodity price assumptions are largely taken assumptions may be provided based on third-
 from IEA as well as country-specific energy prices party literature.
 where available.
 • For commodity price curves not directly
 • ‘Alternative’ assumptions may be provided based on provided in the IEA published material, third
 third party literature. party literature is applied.

 • Concrete policies and measures are derived for each • The scenario generally does not differ from the
 sector individually based on IEA’s indications (e.g. policy mandates elaborated in the LCT.
 subsidies in accordance with climate targets, However, in some cases, it provides an
 National Determined Contribution targets additional assumption around policy
 integration into the model), where available, and convergence to the most ambitious policy
 complemented with expert interviews and third- mandates. The exception to this approach
 party literature. involves carbon prices, which are significantly
 more ambitious.
 Policy mandates,
 • It is assumed that policy makers will continue with
 incentives & taxes “carrots and sticks” and will only use command and • In terms of incentives and taxes, the scenario
 control measures when targets are not reached. In will be limited to modelling those policy
 this way, market intervention is limited while still incentives and taxes that accrue directly to the
 complying with country-specific climate targets. companies, for which risks are modelled,
 assuming that the impact of all ‘consumer
 demand’ incentives (e.g. subsidies on electric
 vehicle purchases, etc.) are captured in the
 production & technology parameters.
 • Limited to a qualitative approach, with no quantitative elements. As outlined above, this will cover other
 macroeconomic trends and other types of risk (e.g. litigation). A separate paper has been developed in
 Unconventional partnership with the law firm Minter-Ellison on litigation risks in financial markets.
 risks

14
2.3 INDICATORS OUT OF SCOPE

 In defining transition risk-related indicators for scenario analysis it is critical to distinguish indicators related to the
 transition to a low-carbon economy more generally, and those that specifically help to inform assessments around
 financial risk. Relevance of one indicator over another may change depending on the scenarios use case (see following
 section) (e.g. financial and company risks analysis, ESG analysis etc.), as well as the level of granularity in the analysis
 (e.g. top-down vs bottom-up). In general, indicators in which one or more of the following factors are applicable were
 not considered (see Table 2.3 for practical examples):

 Indicators that only inform on climate change. As highlighted before, traditional decarbonisation scenarios are
 generally tools used to provide policy guidance, and as such most of the indicators provided tend to inform more on
 the effects of climate change. From a risk perspective, the key question is how these indicators impact companies’
 value drivers, which requires in some cases to change the way they are presented (e.g. cars on the road vs. sales by
 powertrain). Some of these indicators in turn simply will never create financial risk for companies because of their
 macro nature that doesn‘t directly inform on the bottom line. These will frequently be GHG emissions indicators,
 whose materiality for companies only arises indirectly (e.g. through its impact on policy).

 GHG intensity and efficiency indicators in which no policy constraint is foreseen. It could happen that an indicator
 with no relation to company value drivers can become material due to the enforcement of future policy or standards.
 When these cases are not observed, the indicator is disregarded due to the lack of exposure to policy risks. For
 example, sectoral averages of GHG intensity are interesting from a climate change perspective, but when they are not
 ‘enforced’, they do not create financial risk by themselves.

 Lack of clarity on the specificities around the indicator’s impact in policy targets. To achieve policy targets, countries
 might set “sub-targets” on instruments/measures to promote the achievement of policy targets. Quantification of the
 sub-targets impact is generally difficult due to lack of disclosure around the implications in the overall policy. The
 indicators included in the scenarios developed here are thus focused on the overarching policy targets.

 Indicators are already embedded in more material ones. Sector trends can be captured in multiple indicators. When
 this is the case, the challenge is then to assess the indicators on three factors: i.) the ability to communicate on the
 trend; ii.) the materiality for risk analysis; and iii.) the ease with which the indicator can be integrated to risk analysis.

TABLE 2.3 OVERVIEW OF INDICATORS OUT OF SCOPE (SOURCE: AUTHORS)

 Factors
 Sector Indicator Embedded in
 Climate change Uncertain
 No Policy risks another
 indicator policy impact
 indicator
 CO2 emissions/ CO2 Intensity (g/kWh) x x
 Power utilities
 Energy efficiency certificates x
 Automotive CO2 emissions/CO2 Intensity (kg/tkm) x x
 Aviation CO2 emissions/CO2 Intensity (kg/pkm) x x
 Electricity intensity (kWh/t crude
 x
 steel)
 Steel
 Share of low carbon steel producing
 x
 incl. CCS (% of total production)
 Electricity intensity (kWh/t cement) x
 Cement Share of new low carbon cement (% of
 x
 total production)

 15
3 USE CASES 3.1 OVERVIEW This section explores the potential application of the risk scenarios developed in this report for different users. The scenarios developed here are in our view potentially of particular use for two types of applications: • 2°C scenario and transition risk analysis by companies as part of their internal risk management and reporting obligations (e.g. related to FSB TCFD recommendations); • Equity and credit risk research by buy-side and sell-side sector analysts in terms of implications of the transition for the price of and risk to financial securities; In addition to these two core use cases, they may also find use in more top-down portfolio analysis tools and by financial supervisory authorities as part of their regulatory activities. This section will provide three case studies on use case at company and security analysis and briefly discuss other potential uses. CASE STUDY 1: COMPANY-LEVEL CLIMATE RISK MODELLING BY THE CO-FIRM “Our ClimateXcellence model (see Page 18) integrates the risk drivers (i.e. cross-sector and sector-specific) presented herein in the modelling in various ways. In the utilities sector, cross-sector risk drivers include commodity and carbon prices (e.g. natural gas price) which serves a modelling input parameter for electricity generation costs of individual power plants. Sector-specific risk drivers comprise production and technology indicators such as electricity generation and electricity capacity which serve as target indicator for forecasting the structure of electricity markets. We carry out climate risk modelling in five subsequent tasks: FIGURE 3.1 MODEL DIAGRAM MODEL Asset model Supply & Demand Technologies INPUT Asset Model Supply & Demand Technologies Policies CO2 & fuel prices 1. Identification of consistent risk drivers describing transition risk INPUTS Cash flow streams included in operating c scenarios. The identified risk drivers are a subset of the input 1 Energy-only market L 3 parameters (see Point 2) that are required to model the sector. 260 h Residual load duration curve Price (€/MWh) 2,000 h 3,000 h 2. Integration of a comprehensive set of regulatory, market and 3,500 h Load (GW) Weig ave mar technology parameters in line with risk drivers. Detailed data on Peak Mid 1 Mid 2 Base settl price these parameters is derived on a risk driver’s basis e.g. the price for lignite and coke is based on cross-sector risk drivers such as coal tpeak = 260 h tmid1 = 2,226 h tmid2 = 5,260 h Tbase = 8,760 h Water Time (sorted) price. Information is needed as well on the outlook of the energy- 2 4x load segments 4 A only, long-term and short-term capacity markets today and until Price (€/MWh) Price Merit-order for Mid2 segment Price (€/MWh) Merit-order forfor each segment 2050 within the countries in focus. (€/MWh) Price (€/MWh) Merit-order each segment Merit-order for each segment Demand Demand Demand Market settlement price Demand Market settlement price Market settlement price MODEL 3. Techno-economic assessment of risk Asset mitigation model measures. Supply & Demand Here Technologies Policies CO2 & fuel prices Operating cashflow Operating cashflow Operating Market settlement price 5 R MODEL INPUT Asset model Supply & Demand Technologies Policies CO2 & fuel prices cashflow Operating parameters for risk mitigation INPUT measures like increased wind power Cash flow streams included in operating cash flow of electric utilities Water Water Nuclear Water Nuclear Nuclear Lignite cashflow Lignite Lignite Coal Coal Coal Gas Gas Gas Oil Oil Oil capacities are assessed from a technologicalCash (e.g.flow power, streams efficiency) included in operating cash flow of electric utilities Water Nuclear Lignite Coal Gas Oil 1 Energy-only market 3 Long-term capacity market and economical perspective 1 (e. g. capital Energy-only expenditure). market 3 Long-term MODEL capacity market Operating cash flow Price Net margin impact 260 h Residual load duration curve (€/MWh) 260 h 2,000 h Residual3,000 load duration curve OUTPUT Price (€/MWh) Total demand h 2,000 h Levelized cost of 4. Build-up of an asset-level database. The asset-level database 3,500 h Total demand Load (GW) 3,000 h Weighted electricity (LCOE) average Levelized cost of 3,500 h Capacity electricity market Load (GW) (LCOE) contains detailed information on technology type, location, owner Peak Mid 1 Mid 2 Weighted market average settlement market price payments Capacity market Peak Base payments structure, year of commission, capacity, efficiency and CO2 intensity Mid 1 Mid 2 Base settlement price Energy-only market payments Energy-only market at individual asset-level. tpeak = 260 h tmid1 = 2,226 h tmid2 = 5,260 h Tbase = 8,760 h Water Nuclear payments Lignite Coal Gas Oil MWh/a tmid1 = 2,226Time Water Nuclear Lignite Coal Gas Oil MWh/a tpeak = 260 h h (sorted) tmid2 = 5,260 h Tbase = 8,760 h Time (sorted) 2 4x load segments 4 Ancillary services payments 5. Modelling. The functional 2 relation of market Price loaddynamics 4xsegmentsegments and 4 Ancillary services payments Weighted av erage prices for ancillary serv ices Power gradients of thermal power plants Percent of scheduled load per technology Merit-order for Mid2 (€/MWh) Price in 2015 [EUR/M Wh] 1,9 1,7 DR Battery Merit-order climate-related impacts on capital expenditure, Merit-order Merit-order (€/MWh) for Price (€/MWh) Price each for for Mid2 (€/MWh) Price eachsegment operating segmentcash flow segment Demand 1,2 1,5 1,6 in 2015 [EUR/M Wh] 0,9 1,9 0,8 1,7 0,8 0,7 1,4 Weighted av erage prices for ancillary serv ices Flexible Gas CC Power gradients Stand. Gas of thermal CC Coal power plants 1% 16% Percent of scheduled load DR per technology Biomass 1% Battery Price 0,7 11% Coal Demand Merit-order forfor Merit-order Price (€/MWh) each foreach (€/MWh) segment each segment Demand 1,5 1,6 1,4 Flexible Gas CC Stand. Natural Gas 52% 1% 16%Biomass and net margin is modelled. SensitivityMerit-order segment (€/MWh) Demand 1,2 Gas Coal 1% analysis Merit-orderis forconducted each segment to test 0,9 CC 18% 0,8 0,8 0,7 0,7 Price Market settlement price Coal US ISO-NE US ISO-NE MEXICO MEXICO US CAISO US CAISO US MISO US MISO US SPP GERMANY GERMANY FRANCE US NYISO US NYISO ITALY US ERCOT US ERCOT 1% 11% US PJM DemandDemand Natural Gas 52% Hydro (€/MWh) Market settlement price Demand Light Oil 18% MarketMarket settlement settlement price price US SPP FRANCE ITALY US PJM 1% Hydro Demand the robustness of model. For electric utilities, we take into account Operating cashflow Operating cashflow Operating Market settlement price price Market settlement Market settlement price 5 Renewable energy subsidies Light Oil Operating cashflow cashflow Operating Market settlement price 5 Renewable energy subsidies Renewable technology LCOE Fossil fuel technology with lowest LCOE operating cash flow from four different sources, selling electricity Water Nuclear Operating cashflow Operating Lignite Coal Gas Oil Renewable subsidy EUR/MWh cashflow cashflow Renewable technology LCOE Fossil fuel technology with lowest LCOE Water Nuclear OperatingLignite Coal Gas Oil Water WaterNuclear Nuclear Lignite Lignite Coal Coal Gas Gas Oil Oil Renewable subsidy EUR/MWh cashflow on energy-only market, selling capacity as an ancillary service and Water Water Water NuclearNuclear Nuclear Lignite Lignite Lignite Coal Coal Coal Gas Gas Gas Oil Oil Oil 2015 2016 2017 2018 2019 2020 2021 2022 2023 2024 2025 2030 2040 Water Nuclear Lignite Coal Gas Oil to long-term capacity markets MODEL and renewable energy subsidies.” OUTPUTS 2015 2016 2017 2018 2019 2020 2021 2022 2023 2024 2025 2030 2040 Operating cash flow Net margin impact CAPEX Mt CO … MODEL Operating cash flow Net margin impact2 Policies CO2 & fuel prices OUTPUT Operating cash flow Net margin impact CAPEX Mt CO2 … OUTPUT 16
CASE STUDY 2: THE OPPORTUNITY COST OF E-MOBILITY BY KEPLER CHEUVREUX

 “Our Head of Thematic Auto Michael Raab investigated what the shift to e-mobility meant for suppliers and Original
 Equipment Manufacturers (OEMs). By forcing the auto sector into a phase of double spending, he believes that the
 long-term move to e-mobility raises fixed costs as well as operational gearing, and therefore uncertainty and earnings
 risk for the auto sector.

 He looked at OEMs' cost of opportunity represented by the expected spending on e-mobility for the coming years and
 how much of the present value of OEMs’ shares this removes relative to a scenario in which there is no structural shift
 to e-mobility. He finds that his target prices for OEMs could on average be 8% higher if he did not have to account for
 spending for the rollout of e-mobility.

 For suppliers he looked at the value at risk of the sales related to the combustion powertrain which needs to be offset
 by new products for e-mobility to avoid value destruction. He finds that on average 14% of the value per share of
 suppliers is at risk by the change to e-mobility.”

 FIGURE 3.2 OEM’s TP UPGRADE WIPED OUT BY E- FIGURE 3.3 SUPPLIERS’ VALUE AT RISK AS A
 MOBILITY INVESTMENTS PERCENTAGE OF TARGET PRICE
 11% 75% 65%
12% 10%
10% 8% 8% 8%
 8% 6% 50% 40%
 33%
 6%
 4% 2% 25% 16% 12% 19% 12% 11%
 18%
 2% 5%
 0% 0% 4% 2% 0% 0% 0% 0%
 0%
 BMW

 Renault
 Daimler

 Peugout
 FCA

 Volkswagen
 Ferrari

 Valeo
 Plastic Omnium
 Rheinmetal

 SHW
 Stabilus
 Autoliv

 Faurecia
 Hella
 Leoni
 Continental
 Durr

 Nokian
 Autoneum

 Michelin

 Norma
 ElringKlinger

 Schaeffler
 CASE STUDY 3: COMPANY-LEVEL CLIMATE RISK MODELLING BY KEPLER CHEUVREUX

 “Our Head of Banks Jacques-Henri Gaulard tested in January 2016 the potential impact of the energy transition on
 French Banks energy financing policy; using the following scenario:

 What would it mean financially if French banks had to give up all their fossil fuel financing (including oil) over a 20-year
 period and substitute oil & gas financing with renewable energies?

 To do so, he looked at the various analyses of the Banks’ fossil fuel commitments by groups such as Rainforest Action
 Network, BankTrack and Profundo and focus on the gross fossil fuel exposures given by the different reports.

 The negative Net Present Value (NPV) of the energy transition ranks FIGURE 3.4 IMPACT OF ENERGY TRANSITION
 between -EUR0.5bn for SocGen and -EUR4.1bn for CASA, but we ON ENERGY FINANCING POLICY
 expect the latter to become a global leader with a long-term ROE of 1 4%
 14% and profits in energy finance potentially reaching EUR2.5-
 0 3%
 3.0bn beyond the usual horizon.
 3%
 2%
 -1
 In a nutshell, the NPV impact as a percentage of share price hovers 1%
 between a manageable -2% for BNP and +3% for Natixis. He -2
 concluded that French banks announcements in the running up to 0%
 the COP 21 had thus more to do with a reputational damage -3 0%
 -1%
 limitation exercise than avoiding losses. -4 -1%
 -2%
 -2%
 Further analysis could involve testing the sensitivity of each bank -5 -3%
 being analysed according to various factors, including their BNPP CASA NX SocGen
 commitment to fossil fuels & renewables, but also the cost of risk NPV of Energy Transition (EURbn)
 and margins for O&G, coal and renewables.” As a % of target price
 17
You can also read