A REVIEW OF TRENDS AND DRIVERS OF GREENHOUSE GAS EMISSIONS BY SECTOR FROM 1990 TO 2018 - MPG.PURE
←
→
Page content transcription
If your browser does not render page correctly, please read the page content below
TOPICAL REVIEW • OPEN ACCESS

A review of trends and drivers of greenhouse gas emissions by sector
from 1990 to 2018
To cite this article: William F Lamb et al 2021 Environ. Res. Lett. 16 073005

View the article online for updates and enhancements.

                              This content was downloaded from IP address 136.172.151.5 on 19/07/2021 at 12:41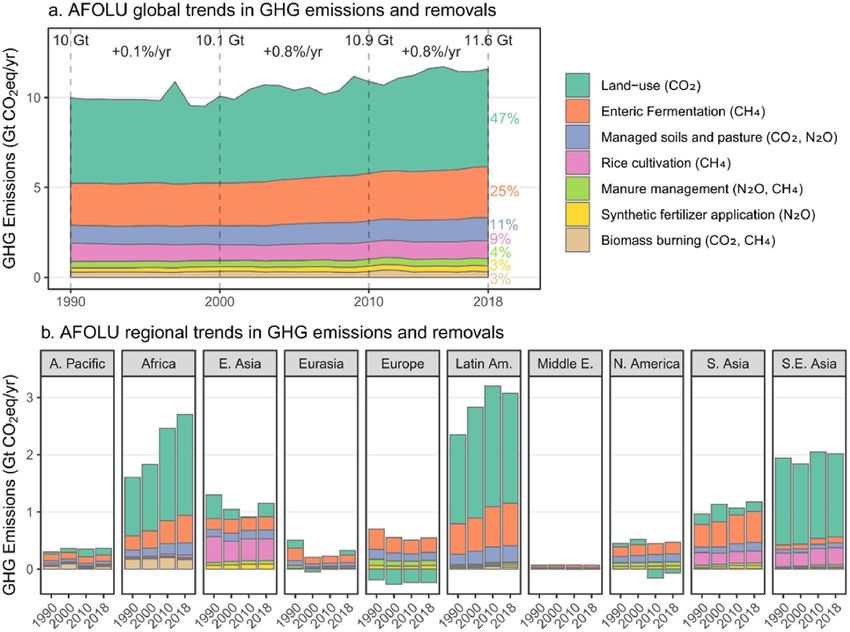
Environ. Res. Lett. 16 (2021) 073005 https://doi.org/10.1088/1748-9326/abee4e
TOPICAL REVIEW
A review of trends and drivers of greenhouse gas emissions by
OPEN ACCESS
sector from 1990 to 2018
RECEIVED
13 December 2020 William F Lamb1,2,∗, Thomas Wiedmann3, Julia Pongratz4,5, Robbie Andrew6, Monica Crippa7,
REVISED Jos G J Olivier8, Dominik Wiedenhofer9, Giulio Mattioli2,10, Alaa Al Khourdajie11, Jo House12,
4 March 2021
Shonali Pachauri13, Maria Figueroa14, Yamina Saheb15, Raphael Slade11, Klaus Hubacek16,
ACCEPTED FOR PUBLICATION
12 March 2021
Laixiang Sun17,18,19, Suzana Kahn Ribeiro20, Smail Khennas21, Stephane de la Rue du Can22,
PUBLISHED
Lazarus Chapungu23, Steven J Davis24, Igor Bashmakov25, Hancheng Dai26, Shobhakar Dhakal27,
29 June 2021 Xianchun Tan28, Yong Geng29, Baihe Gu28 and Jan Minx1,2
1
Mercator Research Institute on Global Commons and Climate Change, Torgauer Straße 12–15, 4 EUREF Campus #19, 10829 Berlin,
Original content from Germany
this work may be used 2
School of Earth and Environment, University of Leeds, Leeds LS2 9JT, United Kingdom
under the terms of the 3
Creative Commons Sustainability Assessment Program, School of Civil and Environmental Engineering, UNSW, Sydney, Australia
4
Attribution 4.0 licence. Max Planck Institute for Meteorology, Bundesstrasse 53, 20146 Hamburg, Germany
5
Any further distribution Ludwig-Maximilians-Universität Munich, Department of Geography, Luisenstrasse 37, 80333 Munich, Germany
6
of this work must CICERO Center for International Climate Research, Oslo, Norway
maintain attribution to 7
European Commission, Joint Research Centre, Ispra, VA, Italy
the author(s) and the title 8 PBL Netherlands Environmental Assessment Agency, Den Haag, The Netherlands
of the work, journal 9
citation and DOI. Institute of Social Ecology, University of Natural Resources and Life Sciences, Schottenfeldgasse 29, 1070 Vienna, Austria
10
Department of Transport Planning, TU Dortmund University, August-Schmidt-Straße 10, 44227 Dortmund, Germany
11
Centre for Environmental Policy, Imperial College London, London, United Kingdom
12
School of Geographical Sciences, University of Bristol, University Road, Bristol BS8 1SS, United Kingdom
13
International Institute for Applied Systems Analysis (IIASA), Schlossplatz 1, 2361 Laxenburg, Austria
14
Department of Management Society and Communication, Copenhagen Business School, Copenhagen, Denmark
15
Openexp, 17 Bd Lefebvre, 75015 Paris, France
16
Integrated Research for Energy, Environment and Society, University of Groningen, 9747AG Groningen, The Netherlands
17
Department of Geographical Sciences, University of Maryland, College Park, MD 20742, United States of America
18
School of Finance and Management, SOAS University of London, London WC1H 0XG, United Kingdom
19
Institute of Blue and Green Development, Weihai Institute of Interdisciplinary Research, Shandong University, Weihai 264209,
People’s Republic of China
20
Federal University of Rio de Janeiro (Universidade Federal do Rio de Janeiro—UFRJ), Transport Engineering Programme (Programa
de Engenharia de Transportes—PET), COPPE-UFRJ, Rio de Janeiro, Brazil
21
Energy and Climate Change Consultant, 25 Troubridge Walk, Rugby CV22 7LP, United Kingdom
22
Lawrence Berkeley National Laboratory, 1 Cyclotron Rd, Berkeley, CA 94720, United States of America
23
Great Zimbabwe University, School of Natural Sciences, Off Old Great Zimbabwe Road, Box 1235, Masvingo, Zimbabwe
24
Department of Earth System Science, University of California, Irvine, United States of America
25
Center for Energy Efficiency—XXI, Moscow, Russia
26
College of Environmental Sciences and Engineering, Peking University, Beijing, People’s Republic of China
27
Department of Energy, Environment and Climate Change, School of Environment, Resources and Development, Asian Institute of
Technology, Klong Luang, Pathumthani 12120, Thailand
28
Institutes of Science and Development, Chinese Academy of Sciences, No.15, Zhongguancun Beiyitiao, Haidian District, Beijing,
People’s Republic of China
29
School of International and Public Affairs, Shanghai Jiao Tong University, No. 1954 Huashan Road, Shanghai,
People’s Republic of China
∗
Author to whom any correspondence should be addressed.
E-mail: lamb@mcc-berlin.net
Keywords: greenhouse gas emissions, energy systems, industry, buildings, transport, AFOLU, trends and drivers
Supplementary material for this article is available online
Abstract
Global greenhouse gas (GHG) emissions can be traced to five economic sectors: energy, industry,
buildings, transport and AFOLU (agriculture, forestry and other land uses). In this topical review,
we synthesise the literature to explain recent trends in global and regional emissions in each of
these sectors. To contextualise our review, we present estimates of GHG emissions trends by sector
© 2021 The Author(s). Published by IOP Publishing Ltd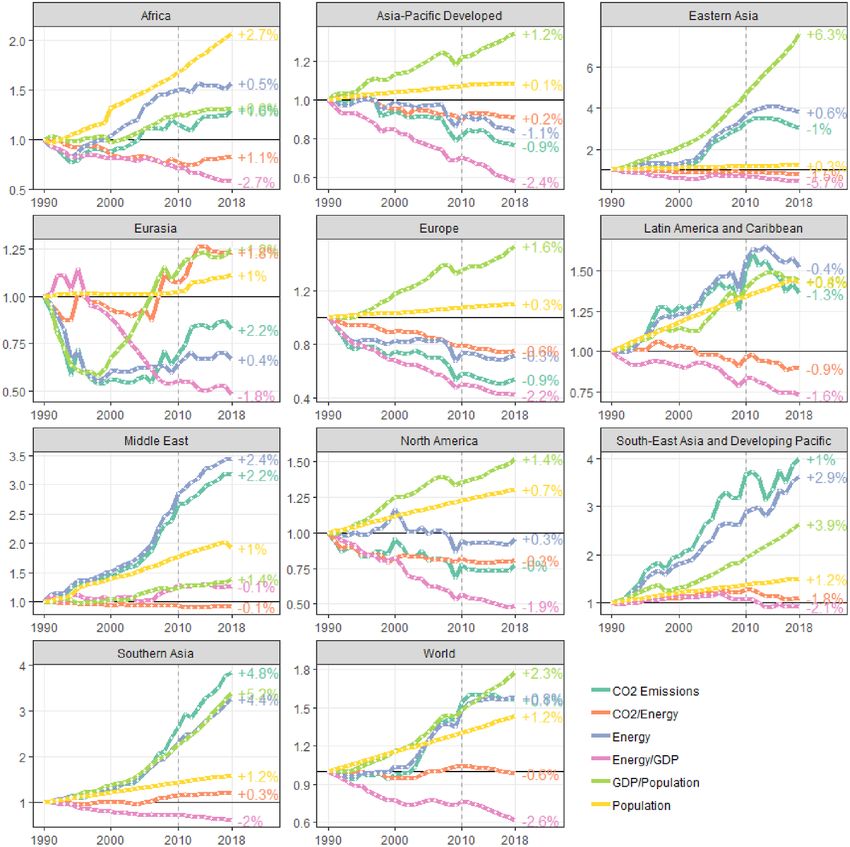
Environ. Res. Lett. 16 (2021) 073005                                                                 W F Lamb et al

from 1990 to 2018, describing the major sources of emissions growth, stability and decline across
ten global regions. Overall, the literature and data emphasise that progress towards reducing GHG
emissions has been limited. The prominent global pattern is a continuation of underlying drivers
with few signs of emerging limits to demand, nor of a deep shift towards the delivery of low and
zero carbon services across sectors. We observe a moderate decarbonisation of energy systems in
Europe and North America, driven by fuel switching and the increasing penetration of renewables.
By contrast, in rapidly industrialising regions, fossil-based energy systems have continuously
expanded, only very recently slowing down in their growth. Strong demand for materials, floor
area, energy services and travel have driven emissions growth in the industry, buildings and
transport sectors, particularly in Eastern Asia, Southern Asia and South-East Asia. An expansion of
agriculture into carbon-dense tropical forest areas has driven recent increases in AFOLU emissions
in Latin America, South-East Asia and Africa. Identifying, understanding, and tackling the most
persistent and climate-damaging trends across sectors is a fundamental concern for research and
policy as humanity treads deeper into the Anthropocene.

1. Introduction                                           AFOLU emissions and removals are linked to the
                                                          production of food, feed and timber production—a
Greenhouse gas (GHG) emissions from fossil fuels          particularly difficult sector as these are essential ser-
and land use have continuously grown since the 19th       vices, carried out by millions of actors, on a glob-
century, reaching their highest ever level in 2019. The   ally limited area of land with multiple competing
Paris Agreement in 2015 set out an ambition to limit      demands (IPCC 2019).
the global temperature increase to 1.5 ◦ C and 2 ◦ C           There have been few attempts to describe global
above pre-industrial levels. Yet, on the basis of cur-    and regional emissions trends and drivers on a con-
rent trends in emissions, planned infrastructure, and     sistent and comprehensive sectoral basis. There is
national policy commitments, the Paris targets are in     a substantive literature that compiles global emis-
jeopardy (Höhne et al 2020). The time window is nar-      sions inventories for carbon dioxide (CO2 ) (Grassi
rowing to counter these trends across all sectors and     et al 2018, Quéré Le et al 2018, Friedlingstein et al
global regions.                                           2019), methane (CH4 ) (Kirschke et al 2013, Saunois
    Global GHG emissions sources are usually              et al 2020), and nitrous oxide (N2 O) emissions
attributed to five broad sectors, characterised by        (Janssens-Maenhout et al 2019, Tian et al 2020).
the Intergovernmental Panel on Climate Change             There are also dedicated IPCC chapters and reports
(IPCC) Working Group III (WG3) as energy sys-             analysing the contributions of each sector, includ-
tems, industry, buildings, transport, and AFOLU           ing energy systems (Bruckner et al 2014), build-
(agriculture, forestry and other land uses). Together,    ings (Lucon et al 2014), transport (Sims et al 2014),
these sectors cover aspects of energy supply (energy      industry (Fischedick et al 2014) and AFOLU (Smith
systems), energy demand (industry, buildings and          et al 2014, IPCC 2019). And it is commonplace for
transport), non-energy related process emissions          national and regional studies to analyse sectoral emis-
(industry), and land-based emissions and removals         sions trends and drivers, such as for China (Guan
(AFOLU).                                                  et al 2018), the US (Feng et al 2015), or the EU
    Each sector encounters its own challenges in          (Spencer et al 2017). In this study, we aim to update
terms of climate change mitigation. GHG emissions         and synthesise these literatures, comprehensively and
from energy systems are dominated by coal-powered         consistently covering all sources of GHG emissions,
electricity generation, often from a limited number of    for all world regions and across all sectors, drawing
highly polluting units that are long-lived and polit-     from expertise in each area to explain key trends and
ically challenging to retire (Jakob et al 2020). Trans-   drivers. The core research questions of this review are
port and building emissions are more diffuse and          as follows:
spread across many actors; they are linked to urban
form, physical infrastructures and everyday beha-         (a) What are the recent trends in global, regional and
viour, thus involving non-trivial technological and           sectoral greenhouse gas emissions?
social challenges to mitigation (Creutzig et al 2015).    (b) What are the driving factors underlying these
Industry emissions are associated with the produc-            trends?
tion of metals, chemicals, cement and other basic
materials demanded by our economies. Many of these            In addressing these questions, we combine sev-
processes are inefficient and offer a large scope for     eral elements of analysis. First, we draw from a com-
rapid emissions cuts, although some are difficult to      prehensive GHG emissions dataset to describe recent
fully mitigate (Davis et al 2018, Rissman et al 2020).    global and regional trends in sector emissions. This

                                             2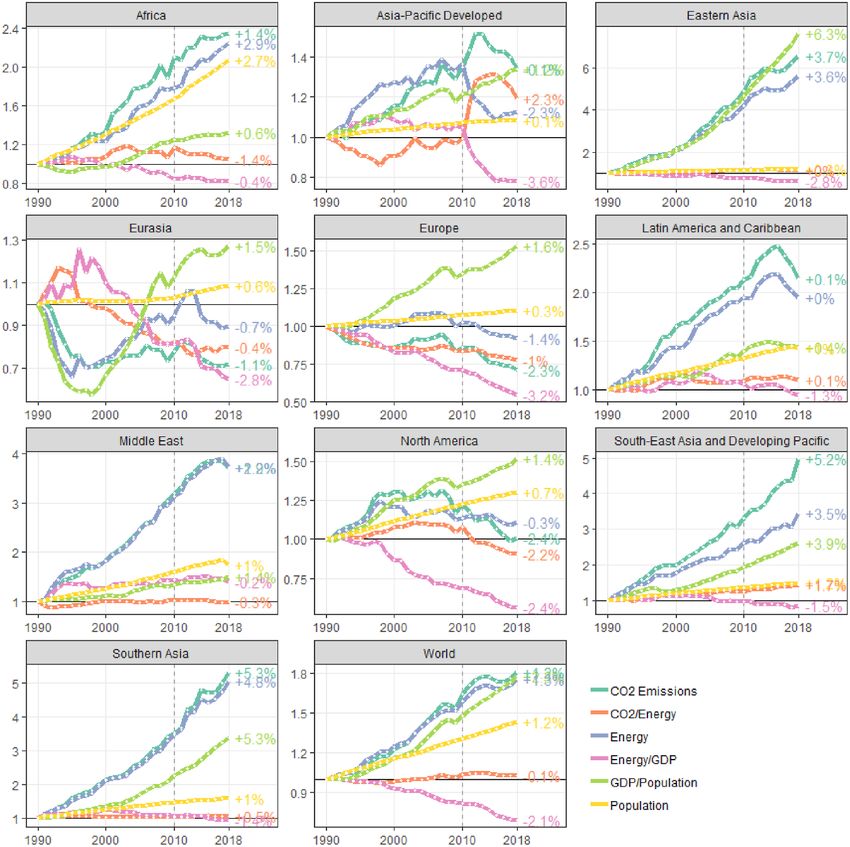
Environ. Res. Lett. 16 (2021) 073005                                                                    W F Lamb et al

provides the context for an in-depth review of the         International Energy Agency data (IEA 2020c), sup-
main drivers underpinning sector emissions trends.         plemented with CH4 and N2 O emissions from
We further support this review with sector specific        savannah burning sourced from the Food and Agri-
Kaya decompositions, and other relevant descriptive        cultural Organisation of the United Nations (FAO
data. Our aim is to provide a summary of the main          2019), and CH4 and N2 O from forest and peat
trends and challenges, sector by sector, which collect-    fires taken from the Global Fire Emissions Database
ively shape our prospects for a rapid and deep trans-      (GFED v4.1s; van der Werf et al 2017).
ition to avoid dangerous climate change.                        EDGAR does not include land-use change and
                                                           management CO2 emissions and removals (here-
2. Methods and materials                                   after ‘land-use CO2 ’ emissions). We therefore source
                                                           these separately, using the average of three global
This article is a literature review supported by several   bookkeeping models (Hansis et al 2015, Houghton
elements of empirical analysis. Here we briefly sum-       and Nassikas 2017, Gasser et al 2020) in a con-
marise our approach to literature identification, data     vention established by the Global Carbon Project
sources and analysis, with further details provided        (Friedlingstein et al 2019). These include CO2 emis-
in the supplementary materials (available online at        sions from peat burning and draining from FAO and
stacks.iop.org/ERL/16/073005/mmedia).                      GFED.
                                                                Land-use CO2 estimates follow the approach
2.1. Literature search and inclusion                       of the global modelling community, which attrib-
This topical review provides a targeted review of          utes anthropogenic CO2 fluxes based on underly-
the literature on emission trends and their underly-       ing drivers, not where they occur (Friedlingstein
ing drivers across different sectors of the economy        et al 2019). In other words, fluxes caused by direct
(energy systems, industry, buildings, transport and        land-use change and land management processes are
AFOLU). Due to the broad scope and a potentially           accounted for, while fluxes driven by, e.g. indirect
very expansive literature base, we inform and focus        anthropogenic effects of changes in environmental
our review in each sector with a supplementary data        conditions on land not subject to modelled manage-
analysis on global and regional emissions trends. This     ment activities, are excluded (Grassi et al 2018, Jia
analysis (described in the following section) brings       et al 2019). (Note that the latter would be included
forward the main and fastest growing sources of            in the AFOLU flux under UNFCCC reporting, if they
GHG emissions in each sector, as well as the regional      occurred on what countries define as ‘managed land’
profiles of these emissions. It further identifies on      for reporting, which is a larger area of forests than
going trends in key driving forces, elaborated in Kaya     considered as subject to management by the mod-
decompositions.                                            els. Thus National Greenhouse gas Inventories sum
    Based on these analyses, teams of sector experts       to larger CO2 removals (and thus smaller net global
determined the scope of their review, structured into      CO2 emissions) than the global models because of the
common components across sectors. These include            net effects of CO2 -fertilisation, N fertilisation and cli-
drivers of global and regional demand, and factors         mate change on the larger areas of ‘managed forests’
that influence emissions intensity and efficiency. We      (Grassi et al 2018)).
rely on the deep sectoral knowledge of our sector               We use 100 year global warming potentials as
teams for the identification of the relevant literat-      updated for the IPCC 6th Assessment Report (AR6)
ure. We also conducted targeted keyword searches           to facilitate comparability between the different gases
on the Web of Science and Google Scholar platforms         in this data set (CO2 , CH4 , N2 O and fluorinated
to inform our selection of literature. These include,      (F-)gases). Emissions are presented as global and
for example, relevant activity data underlying sector      regional totals; the latter using a ten region split
trends (such as trends in ‘building floor space’ per       also developed for IPCC AR6. A list of countries
capita, ‘motorisation’, or ‘renewable energy deploy-       within each region is available in the supplementary
ment’). This focus on relevant key drivers in our          materials.
searches ensures tractability given the scope of our            Consistency in the allocation of emissions and
review, but we search more exhaustively with a struc-      energy use to sectors is important for our analysis.
tured keyword query for Kaya literature in particular      We follow the IPCC 5th Assessment Report (AR5) in
(the search string is provided in the supplementary        allocating emissions sources from the EDGAR data-
materials).                                                base exclusively to five overarching sectors: Energy
                                                           Systems, Industry, Buildings, Transport and AFOLU.
2.2. Global and regional GHG emissions trends              Within each sector we construct a second level
We use the EDGAR v5.0 database to track global,            categorisation (‘sub-sectors’) comprising groups of
regional and sectoral GHG emissions from 1990              structurally similar emissions sources. An explana-
to 2018 (Crippa et al 2019). EDGAR includes CO2            tion of these categories and the detailed sector alloc-
emissions from fossil fuel combustion derived from         ation is available as a supplementary data file.

                                              3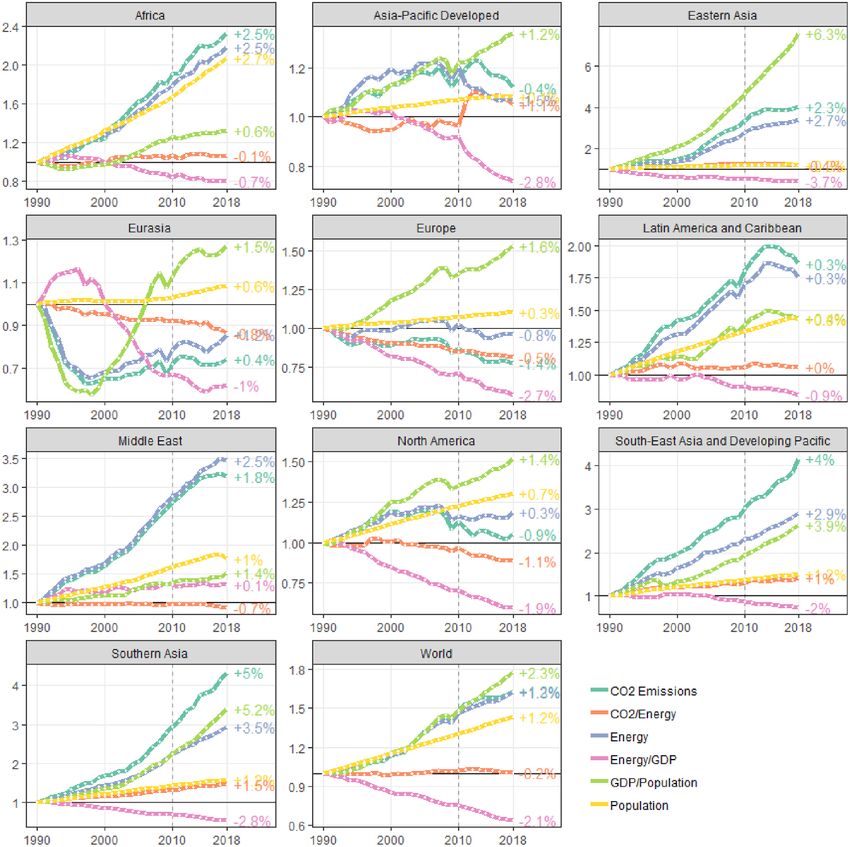
Environ. Res. Lett. 16 (2021) 073005                                                                  W F Lamb et al

2.3. Direct versus indirect emissions                      in our sector definitions—between the prior emis-
Our emissions estimates distinguish between two            sions trends analysis (which uses EDGAR data) and
accounting methods: scope 1 or ‘direct’ emissions,         this Kaya analysis (IEA data)—we rely on a detailed
comprising the emissions produced by owned or con-         mapping of IEA energy sectors to EDGAR emissions
trolled sources; and scope 2, or ‘indirect’ emissions,     sources, available in the supplementary materials.
where the emissions associated with the generation of          The Kaya decomposition for these four sectors is
electricity and heat in the energy systems sector are      narrower in scope than our overall estimates of GHG
allocated to sectors where this energy is consumed. A      emissions, as it focuses only on the CO2 emissions
scope 2 reallocation of indirect emissions is particu-     associated with energy use, i.e. fossil fuel combustion.
larly consequential for the buildings and industry sec-    It does not include GHG emissions from cement,
tors, where some consumed energy is produced on-           ceramics, landfill, land-use change and agriculture, as
site (e.g. in gas boilers), but a large fraction is also   these are not directly related to energy use, and thus
sourced upstream from power plants via electricity         could not be evaluated in the same decomposition.
consumption.                                               Nor do we include indirect emissions in the decom-
    To allocate emissions from the electricity and heat    position. Finally, since there is no meaningful way
sector to final sectors as indirect emissions, we use      to allocate population and GDP data for sectors, we
estimates provided in the CO2 emissions dataset of         simply use regional and global totals in every decom-
the IEA (2020a). These estimates are based on indi-        position, using population estimates from the United
vidual electricity and heat specific emission factors,     Nations (UNDESA 2019) and GDP in purchasing-
and assumea fixed efficiency of 90% for heat plants        power parity terms from the IEA (2020a), extended
(in order to calculate the share of emissions associ-      with growth rates from the IMF (2020) for the most
ated with heat versus electricity in combined heat and     recent years.
power plants). Since the total emissions of the elec-          The Kaya decomposition is conceptually straight-
tricity and heat sector in IEA differs to EDGAR, we        forward in the case of energy systems, industry, build-
calculate the proportion of indirect emissions in each     ings, and transport sectors. However, it is less appro-
final sector in IEA, then multiply these values using      priate for AFOLU, where underlying activities are
the EDGAR electricity and heat total.                      indirectly driven by energy use and GDP. Instead,
    We do not consider ‘consumption-based’ emis-           area of land under different uses and agricultural out-
sions, which comprise all embodied emissions               put are closer proxy drivers of AFOLU emissions.
associated with the consumption of a product or            We therefore substitute the terms for an AFOLU
service. This is relevant for tracking upstream and        specific decomposition, as established by Hong et al
downstream emissions related to regional and global        (2021), where AFOLU GHG emissions (tCO2 eq) is
supply chain networks (Hubacek et al 2014, Li et al        the function of population (persons), agricultural
2020), but is beyond the limits of our work.               output (kcals), and agricultural land area (hectares),
                                                           with the respective symbols H, P, A and L:
2.4. Decomposition of global and sectoral
emissions drivers                                                        H = P (A/P) (L/A) (H/L) .
To support our analysis and review of the main driv-
ing forces and regional differences underlying emis-       A/P is agricultural output per capita, L/A is the land
sions trends, we perform a Kaya decomposition ana-         required for a unit of agricultural output, and H/L
lysis for each sector (Kaya 1990). Kaya analysis is a      is GHG emissions per unit of land. In this decom-
common method applied across the climate mitiga-           position H is composed of agricultural CH4 and N2 O
tion literature, which expresses emissions (tCO2 ) as      emissions from EDGAR supplemented with land-use
a function of population (persons), GDP (2010 US$,         CO2 emissions from the bookkeeping models (Hansis
PPP) and energy (joules), with the respective terms F,     et al 2015, Houghton and Nassikas 2017, Gasser et al
P, G and E:                                                2020). Due to land data constraints, this decomposi-
                                                           tion misses a single year (1990–2017) relative to other
                  F = P (G/P) (E/G) (F/E)                  sectors (1990–2018).

where G/P is GDP per capita, E/G is the energy             2.5. Uncertainties and growth rate calculation
intensity of GDP and F/E is the carbon intensity of        There are different uncertainties associated with his-
energy. To apply the analysis at a sector level, we use    torical GHG emissions estimates. These can be traced
the IEA World Energy Balances (IEA 2020c) to isol-         to uncertainties in (and a lack of) underlying activ-
ate the primary energy supply for the energy sys-          ity and inventory data (particularly in non-OECD
tems sector, and total final energy consumption for        countries), the use of average emissions factors across
the industry, transport, and buildings sectors. We         countries and fuel types, different interpretations of
then match these sectors with CO2 emissions (F)            oxidisation and combustion, and other assumptions
sourced from the IEA (2020a). To ensure consistency        (Andrew 2020).

                                              4
Environ. Res. Lett. 16 (2021) 073005 W F Lamb et al
Fossil fuel combustion emissions are generally 3. Results and discussion
regarded to have comparatively small uncertainties
due to the sophistication and standardisation of his- 3.1. All sectors
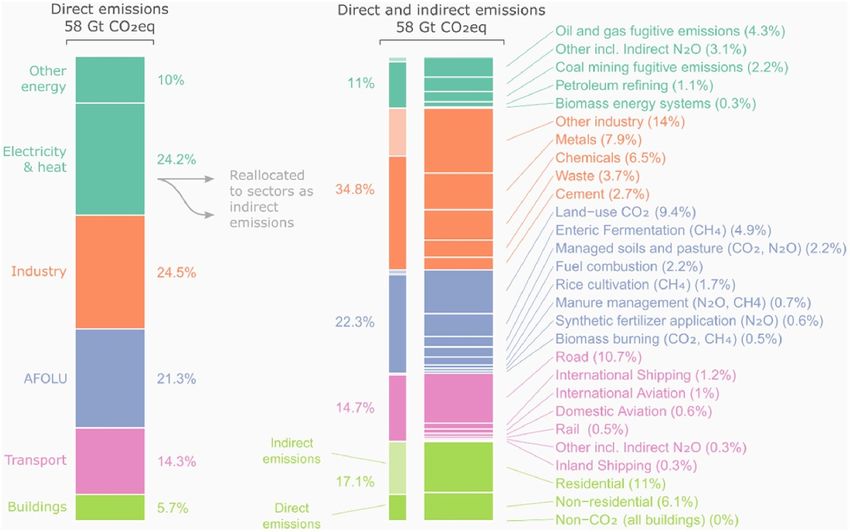
torical energy data reporting. By contrast, uncer- Global GHG emissions continued to rise between
tainties are much higher for AFOLU CO2 emissions 2010 and 2018, although the rate of emissions growth
and all other greenhouse gases. Following IPCC AR5 has slowed since 2014 (figure 1). GHG emissions
(Blanco et al 2014) we assume uncertainties of ±8% were the highest in human history in 2018, reach-
for global emissions of CO2 from fossil fuel combus- ing 58 GtCO2 eq. The largest share of emissions in
tion, ±20% for CH4 emissions and Fgases, ±50% 2018 came from the energy systems sector (34%; 20
for AFOLU CO2 emissions, and ±60% for N2 O GtCO2 eq), followed by industry (24%; 14 GtCO2 eq),
emissions. AFOLU (21%; 12 GtCO2 eq), transport (14%; 8.3
Two particular subsectors are noteworthy for hav- GtCO2 eq) and the operation of buildings (6%; 3.3
ing both high emissions and high uncertainties: fugit- Gt CO2 eq). These estimates are based on direct emis-
ive CH4 emissions and land-use CO2 emissions. sions produced in each sector. As we discuss below,
Regarding the former, recent studies have found the industry and buildings sectors further contributed
substantial discrepancies between nationally repor- to emission growth indirectly, by drawing on electri-
ted GHG inventories for oil and gas fugitive emis- city and heat production in the energy systems sector.
sions versus observational evidence of anthropogenic GHG emissions in 2018 were about 11% (5.8
CH4 emissions (Alvarez et al 2018, Weller et al 2020). GtCO2 eq) higher than GHG emission levels in
Notably, Hmiel et al (2020) concluded from pre- 2010 (52 GtCO2 eq). One third of this increase in
industrial ice core 14 CH4 measurements that nat- GHG emissions between 2010 and 2018 was from
ural geological sources of methane emissions are a energy systems (1.9 GtCO2 eq), followed by industry
much smaller fraction of total atmospheric methane (1.8 GtCO2 eq, 30% of the increase), transport (1.2
than previously estimated, with a potential under- GtCO2 eq, 20%), AFOLU (0.72 GtCO2 eq, 12%) and
estimate of global anthropogenic CH4 emissions of buildings (0.22 GtCO2 eq, 4%).
25%–40%. The likely source is oil and gas infrastruc- In terms of regions, East Asia and North Amer-
ture leaks, which occur across the supply chain, from ica together accounted for 40% of global GHG emis-
extraction, processing and up to gas distribution and sions in 2018, within which emissions are dominated
final use (Christian et al 2016, Alvarez et al 2018, by China and the United States. The highest abso-
Weller et al 2020). lute increase between 2010 and 2018 was in Eastern
Uncertainties around AFOLU CO2 emissions Asia (2.6 GtCO2 eq), more than double the growth of
in the latest Global Carbon Budget are around the next highest region, Southern Asia (1.1 GtCO2 eq).
46% over 2009–2018, based on the mean and one Four regions—the Middle East, Africa, Eurasia and
standard deviation of three bookkeeping models South-East Asia—accounted for the rest of the global
(Friedlingstein et al 2019). BLUE emission estim- emissions increase with approximately 0.5 GtCO2 eq
ates (Hansis et al 2015) are globally higher than each. The most rapid relative growth in emissions
the Houghton and Nassikas (HN) (2017) model, since 2010 occurred in Southern Asia at 3.6% per
in part driven by the explicit representation of year, followed by the Middle East (2.6%/yr), East-
land-use transitions at the sub-grid scale in BLUE ern Asia (2.4%/yr) and Eurasia (1.9%/yr). The only
and the preferential allocation of pasture on nat- region with a decline in emissions since 2010 has been
ural grassland in HN (Hansis et al 2015). Further, Europe (−0.3 GtCO2 eq, −0.8%/yr). North Amer-
trends of individual datasets differ over recent years, ica, Latin America, and developed countries in the
e.g. with an upward trend in BLUE vs a down- Asia Pacific saw only minimal growth over this period
ward trend in HN since the 2000s for land-use (+0.1%/yr, +0.1%/yr and +0.4%/yr, respectively).
CO2 emissions. These different trends are at least Trends by sector differ widely across regions.
partly attributable to the underlying land-use forcing Developed countries in Asia Pacific, Europe and
(Gasser et al 2020). The third model, OSCAR (Gasser North America tend to have higher shares of emis-
et al 2020), follows the approximate mean of BLUE sions from energy systems, industry and transport,
and HN. and lower shares from AFOLU. Overall emissions
We derive the growth rates of emissions trends in these regions are relatively stable, apart from the
and Kaya factors over periods greater than one year, energy systems sector in Europe and North Amer-
as follows: ica, which have seen gradual reductions since 2010
(−1.8%/yr and −1.5%/yr, respectively). This general
( )1/n
EFF (t + n) pattern is reversed in the case of Africa, Latin Amer-
r= −1
EFF (t) ica and South-East Asia. In these regions AFOLU is
the largest emitting sector (specifically: CO2 emis-
where EFF is the emissions value or Kaya factor in a sions from deforestation), yet much of the recent
given year (t). growth comes from the energy systems, industry and
5
Environ. Res. Lett. 16 (2021) 073005                                                                                    W F Lamb et al

   Figure 1. Global and regional GHG emissions trends for all sectors. Panel (a) shows total global anthropogenic GHG emissions
   divided into major sectors. Panel (b) shows regional emission trends in the years 1990, 2000, 2010, and 2018. This figure shows
   the direct (scope 1) allocation of emissions to sectors.

transportation sectors. Similarly, fast growing emis-                  than 50% of emissions), and the other industry,
sions in Eastern and Southern Asia are mainly associ-                  metals and chemicals subsectors (more than 20%
ated with the industry, energy systems and transport                   of emissions). Among the largest sub-sectors, the
sectors, some at rates exceeding 4%/yr.                                fastest growing from 2010 to 2018 have been oil
     The largest individual sub-sector contributing to                 and gas fugitive emissions (+2.1%), road transport
global GHG emissions in 2018 was electricity and heat                  (+2%), coal mining fugitive emissions (+2%), and
generation at 13.9 GtCO2 eq (24%). This subsector                      metals (+2%) (figure 3). Some of these emissions
can be reallocated to consuming sectors as indirect                    trends, however, are marked by significant uncer-
(scope 2) emissions, thus highlighting the importance                  tainty (see section 2.5).
of energy demand as a driver of global climate change                      Our data runs to 2018 and therefore misses
(de la Rue du Can et al 2015, Creutzig et al 2016,                     the most recent break in emissions trends resulting
2018). From this perspective, the relative importance                  from COVID-19 induced lockdowns in 2020. Sev-
of the industry and buildings sectors jump dramatic-                   eral studies have observed sharp reductions in global
ally, from 25% to 35%, and 6% to 17%, respectively                     daily emissions over the course of 2020 (Le Quéré
(figure 2).                                                            et al 2020, Lenzen et al 2020, Liu et al 2020c). The
     The highest emitting subsectors after electricity                 lockdowns impacted emissions in the transport sec-
and heat are ‘other industry’30 , land-use change and                  tor most heavily, particularly aviation, followed by
management, road transport, residential buildings,                     electricity and industry emissions (Le Quéré et al
metals, chemicals, enteric fermentation (i.e. livestock                2020). Most of these reductions will be temporary,
rearing), non-residential buildings, oil and gas fugit-                but COVID-19 may shape the driving forces of sec-
ive emissions, and the waste sector. Indirect emis-                    toral emissions in the long run, depending on the
sions account for a large proportion of emissions                      nature of stimulus packages and associated invest-
in some of these sectors, particularly the residen-                    ments that are rolled out in the wake of the pandemic
tial and non-residential buildings subsectors (more                    (Shan et al 2020).
                                                                           We now turn our attention to the underlying
30 This broad category includes the paper and pulp sector, food        factors of emissions growth. For this purpose, we
and tobacco processing, industrial sources of fluorinated gases, and   decomposed the trends of CO2 emissions from fuel
other generic industries.                                              combustion (excluding other GHGs) into several

                                                        6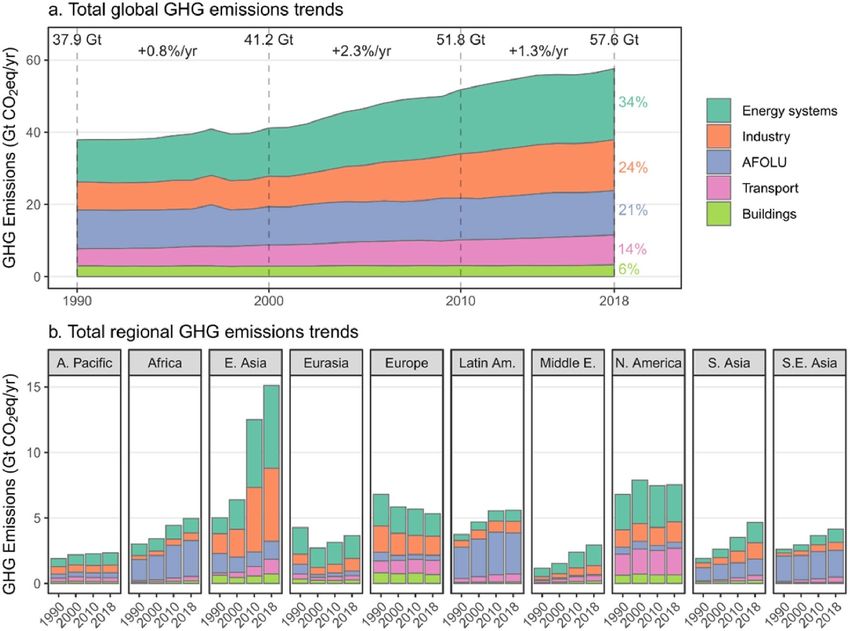
Environ. Res. Lett. 16 (2021) 073005                                                                                        W F Lamb et al

   Figure 2. Direct versus indirect emissions. The stacked bar on the left indicates total global greenhouse gas emissions in 2018, split
   by sectors based on direct (scope 1) emissions accounting. The arrows shown next to the electricity and heat sector depict the
   reallocation of these emissions to final sectors as indirect (scope 2) emissions. This increases the contribution to global emissions
   from the industry and buildings sector (central stacked bar). The stacked bar on the far right indicates the shares of subsectors in
   global emissions when indirect emissions are included.

   Figure 3. Total global emissions by highest emitting subsectors. Only 15 subsectors out of 21 are shown. Indirect emissions from
   electricity and heat production are reallocated to subsectors as indicated. Growth rates in the left-hand panel are average annual
   rates across 2010–2018.

driving factors, starting with an overview of all sectors              the long-term trend (Burke et al 2015, Yao et al
in figure 4 and then investigating individual sectors in               2015, Malik et al 2016, Sanchez and Stern 2016,
more detail in the following sections.                                 Stern et al 2017, Chang et al 2019, Dong et al 2019,
     In general, economic growth (measured as GDP)                     2020, Liobikiene and Butkus 2019, Liu et al 2019,
and its main components, affluence (GDP per capita)                    Mardani et al 2019, Pan et al 2019, Parker and
and population growth, all remained the strongest                      Bhatti 2020). Globally, affluence remained by far the
drivers of GHG emissions in the last decade, following                 strongest upward driver, increasing almost in tandem

                                                        7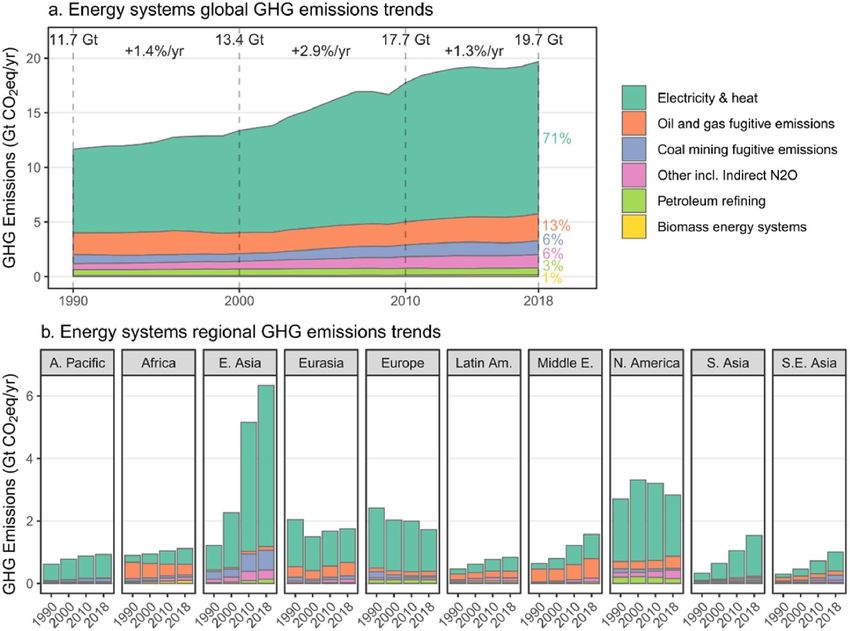
Environ. Res. Lett. 16 (2021) 073005                                                                                       W F Lamb et al

   Figure 4. Kaya decomposition of CO2 emissions drivers (total of all sectors). The indicated growth rates are averaged across the
   years 2010–2018. Note that the energy term by itself is not part of the decomposition, but is depicted here for comparison with
   the Kaya factors. This figure is for fossil fuel CO2 emissions only, in order to ensure compatibility with underlying energy data.

with energy consumption and CO2 emissions up until                     energy efficiency improvements are diminished by
2015, after which some modest relative decoupling                      the energy rebound effect, which has been found in
occurred (figure 4).                                                   several studies to significantly offset some energy sav-
    The main counteracting, yet insufficient, factor                   ings (Rausch and Schwerin 2018, Bruns et al 2019,
that led to emissions reductions was decreased energy                  Stern 2020).
use per unit of GDP in almost all regions (−2.1%                           A significant decarbonisation of the energy sys-
globally). These reductions in energy intensity are a                  tem was only noticeable in North America, Europe
result of technological innovation, regulation, struc-                 and Eurasia. Globally, the amount of CO2 per unit of
tural change and increased economic efficiency (Yao                    energy used has remained practically unchanged over
et al 2015, Sanchez and Stern 2016, Chang et al 2019,                  the last three decades, as the rapid growth of renew-
Dong et al 2019, Liu et al 2019, Marin and Mazzanti                    able energy in some regions has been matched by
2019, Mohmmed et al 2019, Stern 2019, Wang et al                       new fossil plants in others (Chang et al 2019, Jackson
2019b, Goldemberg 2020). The decades-long trend                        et al 2019, Peters et al 2020). Population growth has
that efficiency gains were outpaced by an increase in                  also remained a persistent upward driver in almost all
worldwide affluence continued unabated in the last                     regions (figure 4).
10 years (Haberl et al 2020, Wiedenhofer et al 2020,                       Global economic growth as the main driver
Wiedmann et al 2020). Therefore, GHG emissions                         of GHG emissions plays out particularly strong in
only show relative, not absolute, decoupling from                      China and India (Liu et al 2019, Ortega-Ruiz et al
GDP at the global level (Deutch 2017, Wood et al                       2020, Yang et al 2020, Zheng et al 2020, Wang et al
2018). In addition, the emissions-reducing effects of                  2020b), although both countries show signs of relative

                                                        8
Environ. Res. Lett. 16 (2021) 073005                                                                                       W F Lamb et al

   Figure 5. Global and regional GHG emissions trends for the energy sector. Panel (a) shows total global energy systems GHG
   emissions divided into major subsectors. Panel (b) shows regional emission trends in the years 1990, 2000, 2010, and 2018. This
   figure shows the direct (scope 1) allocation of emissions to sectors. Note that emissions from the electricity and heat subsector are
   allocated as indirect (scope 2) emissions to the buildings, industry and transport sectors in the following sections (thus double
   counting between these respective sector figures).

decoupling because of structural changes (Marin and                    these trends are partially related to shifts in global
Mazzanti 2019). A change in China’s production                         supply chains, where some production emissions
structure and consumption patterns (i.e. the type of                   could also be allocated to final consumers under a
goods and services consumed) have become the main                      so-called consumption-based perspective, mostly in
moderating factors of emissions after 2010, while eco-                 high- and middle-income countries (an issue we do
nomic growth, consumption levels and investment                        not address in this article) (Peters et al 2011).
remain the dominating factors driving up emissions
(Jiborn et al 2020, Zheng et al 2020). In India low                    3.2. Energy systems
emission efficiency and expansion of production and                    Overall, energy systems make up the largest share of
trade caused the growth of emissions (Wang and                         the five sectors, with 34% of total global GHG emis-
Zhou 2020).                                                            sions (although electricity and heat emissions can also
    There are pronounced differences both in recent                    be reallocated to demand sectors, particularly build-
changes in the absolute levels and drivers of GHG                      ings and industry). GHG emissions in the energy sec-
emissions when differentiating countries by income                     tor grew to 20 GtCO2 eq in 2018, with the strongest
levels (Dong et al 2019) or by regions (Chang                          growth occurring between 2000 and 2010 (2.9% per
et al 2019). In high-income countries, significant                     year) and slowing down to 1.3% growth per year
improvements in energy intensity led to declin-                        between 2010 and 2018 (figure 5).
ing CO2 emissions between 2010 and 2015, despite                           Most energy systems emissions are associated
increasing income levels and populations (Dong et al                   with the power sector, i.e. coal, gas and other plants
2019). In upper middle-income and lower middle-                        that produce electricity and heat. These accounted
income countries, rising income more than offset                       for 71% of the total (14 GtCO2 eq) in 2018. Fugitive
any energy structural or intensity gains, leading to                   emissions from oil and gas production (2.5 GtCO2 eq)
increased emissions. And CO2 emissions increased                       and coal mining (1.3 GtCO2 eq) account for the
the most in low-income countries, due to signific-                     second and third largest contributions. The overall
ant increases in carbon intensities, income levels and                 growth of the energy systems sector between 2010 and
population (Dong et al 2019). Importantly, some of                     2018 (+1.9 GtCO2 eq) can be mainly attributed to

                                                        9
Environ. Res. Lett. 16 (2021) 073005 W F Lamb et al
Figure 6. Kaya decomposition of CO2 emissions drivers for the energy systems sector. The indicated growth rates are averaged
across the years 2010–2018. Note that the energy term by itself is not part of the decomposition, but is depicted here for
comparison with the Kaya factors. This figure is for fossil fuel CO2 emissions only, in order to ensure compatibility with
underlying energy data.
electricity and heat (+1.2 GtCO2 eq, 62% of growth), 3.3% respectively between 2010 and 2018. Africa,
followed by oil and gas (+0.37 GtCO2 eq, 19% of Asia-Pacific Developed and Latin America have seen
growth) and coal mining (0.18 GtCO2 eq, 9% of only modest growth at or below 1% per year. Elec-
growth) fugitive emissions. tricity and heat is currently the dominant source
On a regional basis, East Asia stands out as the of GHG emissions from energy systems in various
largest contributor to energy systems emissions in regions of the world, representing more than 50%
2018 (6.3 GtCO2 eq) and with the largest absolute of emissions in most and reaching as high as 80%
growth from 2010 to 2018 (+1.2 GtCO2 eq), aver- in Southern Asia and East Asia. However, in some
aging 2.6% per year. North America (2.8 GtCO2 eq) countries and regions fugitive emissions from oil and
is the second highest emitter, followed by Eurasia gas and coal production figure more prominently,
(1.8 GtCO2 eq) and Europe (1.7 GtCO2 eq). Of these, such as in the Middle East (39% of energy systems
only Eurasia has grown in emissions (+0.1 GtCO2 eq, emissions), Africa (31%), Latin America (25%) and
0.6%/yr), while Europe and North America have seen Eurasia (24%).
slight declines over the last decade (−1.8%/yr and At the global level, growth in CO2 emissions
−1.5%/yr, respectively, leading to −0.27 GtCO2 eq from energy systems have closely tracked rising GDP
and −0.35 GtCO2 eq reductions). Southern Asia, per capita (figure 6), affirming the substantial lit-
South-East Asia and the Middle East are not amongst erature describing the mutual relationships between
the largest absolute contributors, but they exhibit energy, electricity demand, exergy and economic
the largest annual growth rates of 4.9%, 4.3% and growth (Khanna and Rao 2009, Stern 2011, Haberl
10Environ. Res. Lett. 16 (2021) 073005 W F Lamb et al
Figure 7. The fossil share of electricity and heat production by region in selected years. Regional shares of fossil fuels in the
electricity and heat sector are weighted by total electricity and heat output. Data from the IEA World Energy Balances (IEA 2020c).
et al 2020, Wiedenhofer et al 2020). This relationship Improvements in carbon intensity can be decom-
has played out strongly in developing regions, partic- posed into two distinct drivers: fossil intensity (the
ularly in Asia, where a massive scale up of energy sup- emissions intensity of fossil fuels) and fossil share (the
ply has accompanied economic growth—with aver- substitution of fossil fuels by renewables) (Peters et al
age annual increases of energy demand between 3.5% 2017). In the United States fossil intensity improve-
and 4.8% in the past decade (figure 6). (We cover ments have had a larger overall effect since 2006,
these drivers of electricity demand in the industry due to a widespread coal to gas switch driven by
and building sectors). The key downward driver has low gas prices following a shale gas boom, and fed-
been declining energy intensities in almost all regions, eral tax credit incentives (Peters et al 2017, 2020,
associated with ongoing improvements in genera- Feng 2019, Mohlin et al 2019). Nonetheless, the over-
tion and transmission efficiency. Carbon intensities all share of fossil fuels in electricity production has
of energy supply have had a neutral effect, remain- also recently declined in North America (from 66%
ing globally stable since the 1990s, albeit with regional in 2010 to 59% in 2018; figure 7), with renewable
variations. capacity expanding rapidly in Texas, California and
On the energy production side, almost all regions across the Midwest (Mohlin et al 2019). Declining
have seen steady decreases in energy intensities, at a fossil intensities associated with a coal to gas switch
global average of −2.1% per year since 2010, and at a also drove down emissions in Europe in the early
similar steady pace in most individual regions albeit 2000s (Rodrigues et al 2020). But since 2007, Europe’s
at varying rates. Technology benchmarking studies carbon intensity improvements have instead been
show that power generation efficiencies vary widely driven the steady expansion of renewables in the
between (and also within) regions—generally higher share of electricity generation (Peters et al 2017, 2020,
in Europe, Japan and the United states, and lower Le Quéré et al 2019, Rodrigues et al 2020), with a
in Russia, China, India and Australia (Maruyama fossil share decrease of 57% in 2010 to 47% in 2018
and Eckelman 2009, Oda et al 2012). In the case (figure 7). Some studies attribute these effects to cli-
of coal these differences are mainly driven by fuel mate policies, such as the carbon floor price in the
qualities (e.g. lignite vs black coal) and the level of UK, the EU emissions trading scheme, and gener-
plant thermal efficiency (subcritical vs supercritical ous renewable energy subsidies across the continent
vs combined heat and power plants). Since newly (Dyrstad et al 2019, Wang et al 2020a). Asia-Pacific
deployed plants have higher efficiencies and older Developed stands out in contrast to other developed
inefficient plants are steadily retired or retrofitted— regions, with a dramatic increase of regional carbon
particularly following concerted policy efforts, as is intensity and fossil share since 2010. This was due
the case in China—the electricity output for a given to the ramp up of coal and gas capacity in Japan
quantity of fuel tends to improve over time, hence following the Fukushima nuclear accident (Khare-
leading to an aggregate energy intensity improvement cha and Sato 2019). Generally, the use of natural
(Li et al 2020). gas for electricity production is growing strongly in
11Environ. Res. Lett. 16 (2021) 073005 W F Lamb et al
most countries and gas has contributed to the largest slowly, down from 73% in 1990 to 68% in 2018. Des-
increase in global fossil CO2 emissions in recent years pite this, global oil and gas use is still growing (Jackson
(Jackson et al 2019, Peters et al 2020). et al 2019). The switch of coal to gas brings the risk
Steady or increasing carbon intensities can be of increased CH4 emissions from fugitive sources, as
observed in most other regions, indicating fur- well as large cumulative emissions over the lifetime of
ther deepening of fossil fuel based energy systems the new plants that may erase early carbon intensity
worldwide (figure 6). A major driver of these trends reductions (Shearer et al 2020). The focus of decar-
is the global ‘renaissance of coal’ that started in bonisation efforts in the energy systems sector needs
the 1990s, primarily driven by a huge increase of to be on rapidly shifting to zero-carbon sources and
coal generation capacity in China (Steckel et al 2015, actively phasing out all fossil fuels, rather than relying
Jiang and Guan 2016). The growth of coal emis- on the short-lived effects of fuel switching (Jackson
sions slowed after 2010, primarily due to a slow- et al 2019, Peters et al 2020).
down of economic growth and fewer coal capacity
additions in China, and even declined between 2011 3.3. Industry
and 2018 (Friedlingstein et al 2019, Peters et al 2020). Direct and indirect GHG emissions in the industry
Discussions of a global ‘peak coal’, however, may sector steadily increased to 20.1 GtCO2 eq in 2018.
be premature, as further growth was observed in Based on direct emissions alone, the industry sec-
2019 (Friedlingstein et al 2019, Peters et al 2020). In tor is the second largest contributor to total emis-
addition, the renaissance has not been limited to sions in 2018 (25%), following energy systems. When
China alone, with large ongoing and planned capacity indirect emissions from electricity and heat pro-
increases in India, Turkey, Indonesia, Vietnam, South duction are included, industry becomes the single
Africa and others (UNEP 2017, Edenhofer et al 2018, highest emitting sector (35%). In addition, industry
Steckel et al 2020). has a steadily increasing share of all direct emis-
The declining competitiveness of coal-based gen- sions since 1990 and faces non-trivial technolo-
eration relative to alternatives, particularly solar PV, gical bottlenecks to mitigation, particularly in steel
as well as its short-term health and environmental and cement process emissions, making it a key
impacts, begs the question why many countries have sector that will shape global mitigation prospects
continued to invest in coal capacity (Creutzig et al going forward (Davis et al 2018, Crippa et al 2019,
2017, Lelieveld et al 2019, Rauner et al 2020). His- Rissman et al 2020).
torically, coal powered generation has been perceived Apart from indirect emissions from the power
as a relatively low-cost, stable, and technologically sector (5.9 GtCO2 eq, 30% of total), industry emis-
accessible option to expand grid electricity and meet sions in 2018 are largely driven by ‘other industry’
growing consumption demands. As private and pub- (4.5 GtCO2 eq, 23% of total). ‘Other industry’ com-
lic utilities have invested in these technologies they prises a multitude of emissions sources associated
locked-in technological pathways and shaped institu- with the manufacture of pulp and paper, food and
tional environments (e.g. supportive financial, legal tobacco, glass and ceramics, and other generic man-
and political structures) that increase the costs of ufacturing. It also includes the production and use of
transitioning to alternatives. Recent studies show that fluorinated gases for solvents, refrigerants and elec-
incumbent energy utilities have only in rare excep- trical equipment. Three further subsectors account
tions transitioned a sizable share of their portfolios for basic materials production: metals (3.1 GtCO2 eq,
towards renewable energy (Alova 2020, Green et al 15% of total), chemicals (2.8 GtCO2 eq, 14% of total)
2020). It is rather new actors and interests driving and cement (1.6 GtCO2 eq, 8% of total). Finally, waste
these investments, often against considerable opposi- (2.1 GtCO2 eq, 11% of total) includes the emissions
tion and backlash from interest groups, particularly from incineration and waste disposal on land, as well
if implemented policies do succeed in scaling up as industrial, domestic and commercial wastewater
renewable technologies (Moe 2015, Stokes and Breetz processing.
2018). Fossil-based development pathways may also The main period of industry emissions growth
be chosen to meet the narrow goals of national and occurred between 2000 and 2010, which saw a total
international interest groups, such as rent extraction increase of 5.5 GtCO2 eq (+3.8%/yr). Growth has
or energy independence, and are shaped by issues subsequently slowed down to 1.6% per year since
such as lobbying, political ideology, and corruption then, with an approximately proportionate contribu-
(Dorband et al 2020, Jakob et al 2020, Lamb and tion from each subsector. At a regional level, Eastern
Minx 2020, Roy and Schaffartzik 2021). Asia stands out as the main source of global industry
Overall, global energy system emissions growth emissions (8.7 GtCO2 eq in 2018, 43% of total), as
has slowed in recent years, due to a reduction of well as the primary driver of growth since 2010 (+1.3
fossil capacity additions in China, a structural shift GtCO2 eq, 2%/yr). At the same time, industry emis-
to gas and renewables in the United States (Feng et al sions remained high in Europe (2 GtCO2 eq in 2018),
2016), and the increasing penetration of renewables but have slowly declined at a rate of −0.7%/yr. North
in Europe. The worldwide share of fossil fuels shrank America, Asia-Pacific Developed and Latin America
12Environ. Res. Lett. 16 (2021) 073005 W F Lamb et al
Figure 8. Global and regional GHG emissions trends for the industry sector. Panel (a) shows total global industry GHG emissions
divided into major subsectors. Panel (b) shows regional emission trends in the years 1990, 2000, 2010, and 2018. Indirect
emissions from the electricity and heat subsector are shown here in grey.
have had stable industry emissions since 2010 (at maintain stocks of manufactured capital, including
1.9, 0.8 and 1.1 GtCO2 eq each). In all other regions buildings, roads, vehicles, electronics, and machinery
they are growing—most rapidly in Southern Asia (also known as ‘material stocks’; Krausmann et al
(+4.3%/yr to 1.8 GtCO2 eq in 2018), South-East Asia 2017). Material stocks, which will remain in use
(+3.4%/yr to 0.9 GtCO2 eq) and Eurasia (+2.5%/yr over decadal time periods, reached 928 Gt in 2014,
to 1.3 GtCO2 eq). with a growth of 3.9% per year since 2010 and a
Regions differ somewhat in their composition of 26-fold increase since 1900 (Wiedenhofer et al 2019).
different subsectors, with waste and cement featur- Alone, their production and use accounted for 11
ing more heavily in developing regions like Africa, GtCO2 eq of global emissions in 2011, according to
Southern Asia and Latin America, while chemic- Hertwich (2021).
als and other industry play a larger role in Europe There is strong evidence that the growth of con-
and North America. Emissions from metal produc- crete, steel and other construction material use is
tion take place primarily in East Asia (1.8 GtCO2 eq), tightly coupled to economic growth, urbanisation,
followed by Southern Asia (0.33 GtCO2 eq), Eurasia and associated infrastructure development (Pauliuk
(0.28 GtCO2 eq) and Europe (0.22 GtCO2 eq). et al 2013, Cao et al 2017, Krausmann et al 2017,
The main global driver of industry emissions has Plank et al 2018, Haberl et al 2020). Per-capita stocks
been the massive rise in demand for basic materials, of cement and steel show a typical pattern of
construction minerals and manufactured products. rapid take-off as countries urbanise and industrial-
These are in turn driven by rising affluence and ise, before slowing down to low growth at high levels
consumption, as well as an increase in urban pop- of GDP. Selected wealthy countries even seem to sta-
ulations and associated infrastructure development bilise at high per-capita levels of stocks, although it
(Krausmann et al 2017, 2018). Similar to the energy is unclear if these stabilisations persist and if they
sector, the industry sector generates products that are result in significant absolute reductions of mater-
indirectly used in final sectors—namely the mater- ial use (Liu et al 2013, Pauliuk et al 2013, Fishman
ials that make up the manufactured capital of the et al 2016, Cao et al 2017). Hence, in countries that
physical economy, such as cement, chemicals, steel, are recently industrialising and urbanising—i.e. East-
aluminium, wood, paper, plastics, lubricants, fertil- ern, Southern and South-Eastern Asia—we observe a
isers, and so on. These materials are used to build and particularly strong increase of emissions from these
13Environ. Res. Lett. 16 (2021) 073005 W F Lamb et al
subsectors (figure 8) and a strong overall relationship capita would have driven industrial CO2 emissions
between GDP growth and industrial CO2 emissions to rise by more than 100% by 2017 compared with
(figure 9). 1990s, instead of 56%. Nonetheless, many studies
Once buildings, roads, ports, vehicles and other point to deep regional differences in efficiency levels
physical stocks have been constructed, a continu- and large globally unexploited potentials to improve
ous throughput of material flows is still required industrial energy efficiency by adopting best avail-
to maintain, renovate, replace and operate them able technologies and practices for metal, cement and
(Wiedenhofer et al 2015, Krausmann et al 2017). chemical production (Gutowski et al 2013, Schulze
Material consumption in wealthier countries there- et al 2016, Gonzalez Hernandez et al 2018, Talaei et al
fore has shown only limited rates of decrease, even 2018). Yet, decarbonising process emissions by tech-
though their large existing and only slowly growing nological improvements alone is unlikely to outweigh
stocks open up (as yet unexploited) opportunities for growing demand, calling for additional demand-
prolonging lifetimes and improving end of life recyc- side mitigation options to curb emissions from the
ling, so as to achieve absolute reductions in extrac- industry sector (Creutzig et al 2016).
tion activities (Krausmann et al 2017, Zink and Geyer Overall, demand for services driven by global
2017). For a given level of economic development, affluence and population growth have led to an
material stock levels and associated material use also escalation of material use and associated industry
varies due a variety of contextual factors, such as GHG emissions. Recent growth has been driven by
differences in prevailing construction methods and emerging economies, but also high-income coun-
building codes (e.g. steel vs timber framing), patterns tries where direct and indirect consumption remains
of urbanisation and infrastructure development (e.g. high. The growing complexity of international supply
compact cities vs sprawl), trends in dwelling space chains makes governance hard and problem-shifting
and cars per capita, and the overall lifetimes of build- likely. Historically, energy efficiency provided the
ings and infrastructure (Lin et al 2016, Hertwich et al largest mitigation wedge, but still failed to prevent
2019, Lanau et al 2019). GHG emissions from increasing. Furthermore, effi-
As with the AFOLU sector, industrial emis- ciency potentials will decrease in the coming dec-
sions are strongly linked to international trade. ades as technological options are exhausted. This puts
Materials, especially metals, chemicals, plastics and increasing focus on historically weak drivers of decar-
wood products, are routinely transported between bonisation, such as demand management in end-
different stages of extraction, refining and pro- use sectors (i.e. more efficient delivery of services),
duction along global supply chains (Schaffartzik material efficiency (product lightweighting, longer
et al 2016, Plank et al 2018). Owing to a series lifetimes, use of secondary materials), fuel switching
of socio-economic conditions including low priced and electrification, and the decarbonisation of power
labour, state-led industrial policy and agglomera- and feedstocks (IRP 2020).
tion effects, China currently dominates global indus-
trial production, particularly in the manufacture of 3.4. Buildings
steel and other basic materials (Reck et al 2010, Global GHG emissions from the buildings sector
Wang et al 2019a). The global shift of energy- reached 9.8 GtCO2 eq in 2018, of which 66% (6.5
intensive industries away from historical centres in GtCO2 eq) were upstream emissions from power
the United States and Europe to developing regions generation and commercial heat (figure 10). The
explains, to some extent, reductions of industry remaining 34% (3.4 GtCO2 eq) of emissions were dir-
GHG emissions in the former—even though they ectly produced in buildings, for instance by gas and
continue to consume manufactured products via coal boilers, and cooking and lighting devices that
trade. burn kerosene, biomass and other fuels. Residen-
On the production side, improvements in the tial buildings accounted for the majority of this sec-
energy efficiency of material extraction, processing tor’s emissions (64%, 6.3 GtCO2 eq, including both
and manufacturing have reduced industrial energy direct and indirect emissions), followed by non-
use per unit of output (Wang et al 2019a; figure 9). residential buildings (35%, 3.5 GtCO2 eq). Some non-
These measures, alongside improved material substi- CO2 sources (CH4 and N2 O) also contribute to build-
tution, light-weight designs, extended product and ing emissions, but these are almost negligible (0.03
servicing lifetimes, improved service efficiency and GtCO2 eq) compared to other subsectors.
increased reuse and recycling could enable substan- The buildings sector accounts for almost 6% of
tial emissions reductions in the future (Hertwich et al all direct GHG emissions and 17% when indirect
2019). Switching to lower or zero carbon feedstocks ‘scope 2’ emissions are included. Yet further emis-
and power further leads to industry sector decarbon- sions components could also be attributed to this
isation. Indeed, figure 9 shows that the ratio of indus- sector under alternative accounting schemes, such
trial energy use to GDP has steadily declined since as consumption-based emissions footprints. Embod-
2010 in all regions. Absent these improvements in ied GHG emissions associated with building mater-
energy intensity, growth of population and GDP per ials and components, as well as the construction,
14You can also read