Regenerative Agriculture - Identifying the impact; enabling the potential Report for SYSTEMIQ - Food and Land Use Coalition
←
→
Page content transcription
If your browser does not render page correctly, please read the page content below
1

Regenerative Agriculture
Identifying the impact; enabling the potential

Report for SYSTEMIQ
School of Water, Energy and Environment
17 May 2019
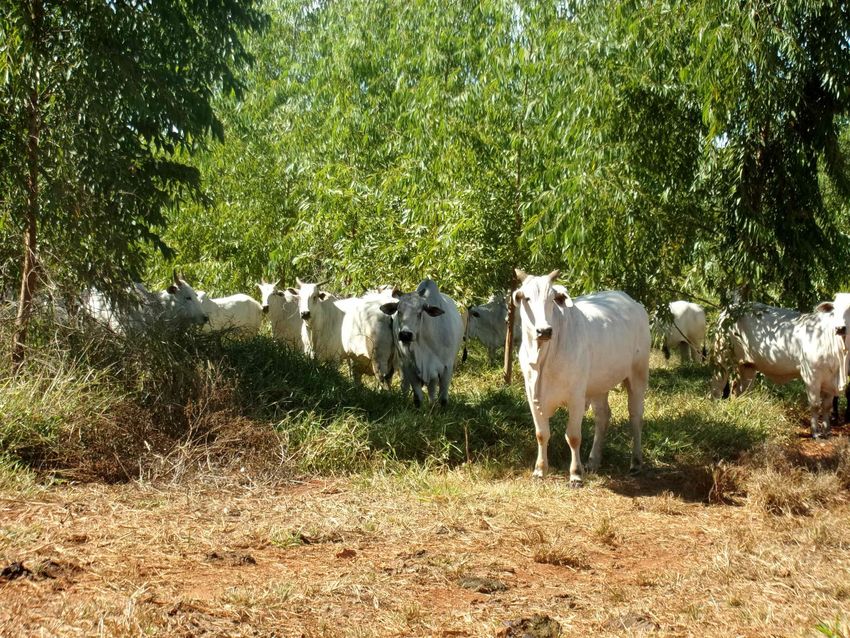
Burgess PJ, Harris J, Graves AR, Deeks LK (2019) Regenerative Agriculture: Identifying the Impact; Enabling the
Potential. Report for SYSTEMIQ. 17 May 2019. Bedfordshire, UK: Cranfield University.

Photo on the front page is of an integrated crop, livestock and forest system in the Cerrado region of Brazil
(Photo: Paul Burgess)
1

Table of contents
Executive Summary .......................................................................................................... 3

1 Introduction ................................................................................................................ 5

2 Definitions of regenerative agriculture ........................................................................ 6
2.1 Introduction ................................................................................................................................... 6
2.2 Method .......................................................................................................................................... 6
2.3 Regenerative agriculture as a set of practices ............................................................................... 6
2.4 Regenerative organic agriculture................................................................................................... 7
2.5 Regenerative agriculture as farming that enhances ...................................................................... 8
2.6 Selected regenerative agriculture systems.................................................................................... 9
2.7 Conclusions .................................................................................................................................. 10

3 Context for regenerative agriculture.......................................................................... 12
3.1 Introduction ................................................................................................................................. 12
3.2 Linking land, food demand and production................................................................................. 12
3.2.1 Land use in 2000 ....................................................................................................................... 13
3.2.2 Land use from 1900 to 2000 ..................................................................................................... 13
3.2.3 Land use from 2000 to 2050 ..................................................................................................... 14
3.3 Carbon sequestration and greenhouse gas emissions ................................................................ 14
3.4 Biodiversity .................................................................................................................................. 15
3.5 Land sparing and land sharing ..................................................................................................... 16

4 Impacts of regenerative agriculture systems .............................................................. 17
4.1 Introduction ................................................................................................................................. 17
4.2 Method ........................................................................................................................................ 17
4.3 Results .......................................................................................................................................... 18
4.3.1 Conservation agriculture .......................................................................................................... 18
4.3.2 Organic crop production ........................................................................................................... 20
4.3.3 Tree crops ................................................................................................................................. 22
4.3.4 Tree-intercropping .................................................................................................................... 23
4.3.5 Multistrata agroforestry and permaculture ............................................................................. 24
4.3.6 Silvopasture .............................................................................................................................. 25
4.3.7 Multi-paddock grazing .............................................................................................................. 25
4.3.8 Organic livestock systems ......................................................................................................... 26
4.3.9 Rewilding and land abandonment from agriculture................................................................. 27
4.4 Conclusions .................................................................................................................................. 28

5 Scaling of regenerative agriculture ............................................................................ 30
5.1 Introduction ................................................................................................................................. 30
5.2 Estimates of current and potential areas .................................................................................... 30
5.2.1 Conservation agriculture .......................................................................................................... 32

Regenerative Agriculture Burgess et al. (2019)
2

5.2.2 Organic arable production ........................................................................................................ 32
5.2.3 Tree crops ................................................................................................................................. 32
5.2.4 Tree intercropping, multistrata agroforestry and silvopasture ................................................ 32
5.2.5 Multi-paddock and organic grazing .......................................................................................... 33
5.2.6 Rewilding and agricultural land abandonment ........................................................................ 34
5.3 Conclusions .................................................................................................................................. 34

6 Enabling and promoting regenerative agriculture ...................................................... 35
6.1 Introduction ................................................................................................................................. 35
6.2 Recognising the role of regenerative agriculture in policy .......................................................... 35
6.3 Enabling farmers .......................................................................................................................... 37
6.4 Research and initiatives to improve regenerative systems ......................................................... 38
6.5 Consumers and product premiums ............................................................................................. 39
6.6 Conclusions .................................................................................................................................. 39

7 References ................................................................................................................ 40

8 Appendices ............................................................................................................... 54
Appendix A: Papers identified in the Scopus database with “Regenerative Agriculture” in article,
abstract or keywords ............................................................................................................................ 54
Appendix B: Relating agricultural areas and yields to global demands ................................................ 55
Appendix C: Worksheets of evidence ................................................................................................... 57
Appendix D: Calculation of the area of tree crops................................................................................ 67

Regenerative Agriculture Burgess et al. (2019)
3

Executive Summary
The current degradation of biodiversity and soil fertility has led to increasing calls internationally to
“reverse the direction of travel” of global agriculture from degenerative to regenerative approaches.
The definition of “regenerative agriculture” used in this report is “a system of principles and
practices that generates agricultural products, sequesters carbon, and enhances biodiversity at the
farm scale”. Important practices associated with regenerative agriculture are: 1) minimising or
avoiding tillage, 2) eliminating bare soil, 3) encouraging plant diversity and 4) water percolation, and
5) integrating on-farm livestock and cropping operations. Some systems also prioritise the
minimisation of pesticides and synthetic fertilizers i.e. regenerative organic agriculture. The
regenerative systems examined in this report are conservation agriculture; organic crop production
and grazing; tree crops; agroforestry including tree-intercropping, multistrata agroforestry and
permaculture, and silvopastures; multi-paddock grazing systems, and rewilding. The purpose of the
report is to identify the impact of these systems on food production, carbon sequestration and
biodiversity enhancement, to determine their current extent, and to explain ways in which they can
be scaled.

The opportunities for regenerative agriculture occur in the global context of limited land, an
increasing population and demand for food, and the need to reduce greenhouse gases and enhance
biodiversity. There is agreement that existing intact ecosystems of high biodiversity need to be
protected from agricultural expansion. There is also agreement that reducing waste and constraining
per capita consumption of animal products is desirable. Whilst some have contrasted “land sparing”
and “land sharing” approaches, there is increasing agreement that enhancement of biodiversity will
benefit from land sparing approaches at a range of scales.

Each of the nine regenerative agriculture systems investigated can offer environmental benefits in
terms of increased soil and above-ground carbon storage and/or enhanced on-farm biodiversity.
Their effects on yield, revenue, and production costs depend on the baseline situation and the
specific system. In many situations, conservation agriculture can sustain yields and/or lead to
reduced production costs. Adding organic amendments to crops not receiving fertiliser can increase
crop yields. Although certified organic production generally reduces crop and livestock yields
compared to well-managed non-organic production, securing an organic premium typically results in
greater profitability. The effects of agroforestry systems on food production are closely linked to the
tree densities and whether the trees also provide feed and/or food. In some places, rewilding can
be appropriate.

Regenerative systems are already used on large areas and their extent is increasing. In Section 5, we
estimate current global areas and annual rates of expansion of conservation agriculture (180 Mha +
11 Mha/year), certified organic crop production (12 Mha + 1 Mha/year), certified organic grassland
(48 Ma + 5.2 Mha/year), tree crops (158 Mha + 2.4 Mha/year), and agroforestry (324 Mha + 2.6
Mha/year). Assuming that 15% of the tree crop, grassland and organic crop systems are also
agroforestry, these represent a current area of 689 Mha and a plausible area of 1426 Mha by 2050.

The continued expansion of regenerative agriculture can be supported by actions at international,
national and local scales involving policy makers, farmers, researchers, consumers and those

Regenerative Agriculture Burgess et al. (2019)
4

involved in the food chain. Policy-led initiatives such as “4 per 1000” are important. Facilitating
market- and consumer-driven processes such as continued expansion of certified organic
agriculture, which includes a consumer-derived price premium, is also necessary. The good news is
that there are many regenerative agricultural systems that are profitable, sequester carbon, and
enhance biodiversity. Globally such systems are becoming more widely adopted.

Regenerative Agriculture Burgess et al. (2019)
5

1 Introduction
The United Nations Sustainable Development Goals (SDGs) provide a comprehensive framework to
help decision makers and governments to balance social, economic and environmental challenges
up to 2030 (United Nations, 2015). They include targets related to zero poverty (Goal 1), zero hunger
(Goal 2), climate action (Goal 13) and life on land (Goal 15). The goals bring together individual
sectoral goals such as the United Nations Framework Convention on Climate Change (UNFCCC), and
the Convention on Biological Diversity and the Aichi Biodiversity Targets for 2011-2020.

The increasing global demand for food can be met by agricultural expansion (e.g. clearing forest land
for crop production) or intensification (e.g. increasing yields from existing crop and grassland)
(Tilman et al. 2011). For the past 50 years, the dominant form of agricultural development has been
intensification with low consideration of the environmental effects (Pretty et al. 2018). To counter
this, “sustainable intensification” is promoted as an approach for increasing food production from
existing farmland whilst placing less pressure on the environment and without undermining future
production (Godfray and Garnett 2014). The approach is goal-, rather than means-orientated, with
the most appropriate form of farming dependent on the context (Garnett et al. 2013).

Recent studies continue to highlight the ongoing decline in global biodiversity (e.g. IPBES 2018b;
Sanchez-Bayo and Wyckhuys 2019). One approach has been to protect an increasing proportion of
land for conservation (Mehrabi et al. 2018), i.e. increasing from 11.5% (1500 Mha) in 2000 to 15%
(2000 Mha) in 2018 (FAO 2019). The Aichi Biodiversity Target 11 specifies a target of 17% for 2020
(Convention on Biological Diversity 2010). A second approach is to promote the ecological
intensification of existing agricultural land (Altieri 1999, United Nations 2013, Rodale Institute 2014)
to regenerate soils and conserve biodiversity. The process of assisting the recovery of an ecosystem
that has been degraded, damaged, or destroyed is also known as ecological restoration (Society of
Ecological Restoration 2004).

In the above context, the structure of the report is:
1) A review of definitions of regenerative agriculture.
2) A review of where “Business as Usual” agriculture is taking us, based on a framework
 describing the interactions between global population, waste, crop- and animal-based food
 consumption per capita, mean yields, greenhouse gas emissions and biodiversity.
3) A review and synthesis of the impact of selected regenerative agricultural systems in terms of
 food production, carbon sequestration and biodiversity.
4) A review of the current extent and rates of expansion of the selected regenerative systems.
5) A review on how regenerative agriculture can be enabled and promoted.
6) A reference list and associated appendices of key evidence related to regenerative agriculture.

Regenerative Agriculture Burgess et al. (2019)
6

2 Definitions of regenerative agriculture
2.1 Introduction
This section reviews the term “regenerative agriculture”, examines how it has been used in the
literature, and provides a working definition. It then proceeds to identify the key practices and
systems.

2.2 Method
Terms like “sustainable agriculture”, “climate-smart agriculture” and “agroecology” are widely used
in academic literature. However, the term “regenerative agriculture” has not been widely been used
in scientific publications. A search in the SCOPUS database of peer-review literature in January 2019
found only 23 papers used the term in the article title, the abstract or key words (Appendix A). We
reviewed 20 of the relevant papers to examine the use of the term regenerative agriculture.
Regenerative agriculture appears more widely as a term in the grey literature with Google
identifying 42,100 pdf documents. The diversity of literature means that there is a wide range of
regenerative agriculture definitions. In our review we identify three main ways of defining
regenerative agriculture: including 1) a set of practices, 2) which may or may not avoid synthetic
fertilizer and pesticides, and 3) a focus on going beyond the reduction of negative impacts to ensure
that agriculture has a positive environmental effect.

2.3 Regenerative agriculture as a set of practices
The TED talk by Gabe Brown (2016) provides a good introduction to regenerative agriculture on his
farm in northern USA, highlighting the importance of minimising cultivation and bare soil,
encouraging diversity and water percolation, and integrating crop and livestock production at a
farm-scale. Building on this, five practices that are widely associated with regenerative farming are:
1) abandoning tillage, 2) eliminating bare soil, 3) fostering plant diversity, 4) encouraging water
percolation into the soil, and 5) integrating livestock and cropping operations. Practices 1, 2, 3 and 5
are also highlighted by LaCanne and Lundgren (2018).
1) Abandoning tillage: almost all definitions and descriptions of regenerative agriculture highlight
 the benefits of minimising or avoiding tillage. Minimising tillage reduces the oxidation of soil
 carbon, leading to higher soil carbon contents and increased water and nutrient holding capacity.
2) Eliminating bare soil: this helps to reduce soil erosion and the increased production of dry matter,
 such as through cover crops, can again increase soil carbon.
3) Fostering plant diversity: encouraging plant diversity and avoiding monocultures can also lead to
 greater dry matter production because of the complementarity of light, water, and nutrient use
 of different crops.
4) Encouraging water percolation into the soil: in many areas, agricultural production is limited by
 water, and hence there are benefits from increasing the amount of water percolating in the soil.
 This is an objective of keyline technologies used in Australia (Savory and Duncan, 2016; Duncan
 2016).
5) Integrating livestock and cropping operations can be particularly useful in systems where there is
 a focus on minimising synthetic inputs as the manure from livestock can help maintain soil
 nutrient levels.

Regenerative Agriculture Burgess et al. (2019)
7 2.4 Regenerative organic agriculture Pearson (2007) reports that regenerative agriculture seeks to minimize external inputs and negative external impacts outside the farm. Francis et al. (1986) also argue that regenerative agriculture “emphasizes the use of resources found on the farm”, minimising the use of chemical fertilizers and pesticides. Lovins (2016) argues for a “circular economy of the soil” and Brown (2016) also highlights that on his farm they do not use synthetic fertiliser and pesticides (Table 1). California State University (CSU) (2017) also emphasises the negative effects of synthetic fertilisers in terms of energy costs, environmental pollution, and their effect on soil biology. Table 1. Some definitions of regenerative agriculture include the avoidance or prohibition of synthetic fertilizers and pesticides. This report refers to such a system as regenerative organic agriculture. Practice Brown Regenerative Regenerative (2016) agriculture organic agriculture CSU Drawdown Rodale Institute (2017) (2017)a (2018) Minimise tillage Minimise bare ground Foster plant diversity Increase water percolation Integrate crops and animals Optional Add green manures Add compost Avoid synthetic fertilizers and pesticides Minimise Legend: means includes; a blank space indicates no data a : Four of the six to be present Drawdown (2017) identifies methods to reduce global greenhouse gas emissions. The Drawdown Assessment is a comprehensive and useful survey of a range of interventions including estimates of their current extent and potential extent by 2050. Although they recognise a range of regenerative agricultural systems, they use the term “regenerative agriculture” for annual cropping systems that include at least four of the following six practices: no-till or reduced tillage, cover crops, crop rotations, compost applications, green manures, and/or organic production (Table 1). Although their definition includes systems that are not “organic”, the associated technical notes imply that many systems are. A detailed description of regenerative organic agriculture is provided by the Rodale Institute (2018). It is not essential to integrate animals and crops to achieve “regenerative organic agriculture” certification, but the use of synthetic fertilizers and pesticides is prohibited if the label organic is to be applied. The regenerative organic certification scheme builds on USDA’s certified organic standards and has three pillars relating to soil health, animal welfare, and social fairness. Regenerative Agriculture Burgess et al. (2019)
8 2.5 Regenerative agriculture as farming that enhances Many current agricultural systems whilst providing safe nutritious food result in reduced soil fertility, carbon storage and biodiversity. Such systems can be termed “degenerative agriculture”. To address this, FAO (2014a) promotes “sustainable agriculture” that “conserves land, water, and plant and animal genetic resources, and is environmentally non-degrading, technically appropriate, economically viable, and socially acceptable” (Figure 1). Degenerative Sustainable Regenerative Reduce harm Enhance agriculture agriculture agriculture Figure 1. Regenerative agriculture aims to go beyond the “do no harm” principles of sustainable agriculture Whilst some authors (e.g. Pretty et al. 2018) emphasise that sustainable agriculture also includes environmental enhancement, the specific focus of moving agriculture from being “non-degrading” to being “enhancing” is a particular focus of regenerative agriculture (e.g. Rhodes 2015). The Oxford English Dictionary defines regeneration as the “bringing of new and more vigorous life”. In the same way that many people want their life and their relationships to be more than “just sustainable”, many authors (Table 2) argue for a similar positive vision for agriculture. In the UK, the Food, Farming and Countryside Commission proposes “not just sustaining, but regenerating and restoring ecosystems” (RSA 2018). In some certification programmes, this regeneration extends beyond the environment to include enhanced human communities (General Mills, 2018; Boyer quoted by Reguzzonia 2018). Table 2. Definitions of regenerative agriculture focused on enhancement Definitions of regenerative agriculture Reference Farming and grazing practices that, among other benefits, reverse California State climate change by rebuilding soil organic matter and restoring degraded University (2017) soil biodiversity – resulting in carbon drawdown and an improved water cycle. Regenerative agriculture actively builds the “system”, or resource base, Modified from it utilises. Inwood (2012) A system of farming principles and practices that increases biodiversity, Terra Genesis (2017) enriches soils, improves watersheds, and enhances ecosystem services. “Built on biological principles, regenerative agriculture seeks to Sherwood and concurrently enhance productivity and environmental management”. Uphoff (2000) “For the system to be regenerative there must be an increase in both Rhodes (2017) biodiversity and quantity of biomass” “Any system of agriculture that continuously improves the cycles on Kevin Boyer quoted which it relies, including the human…, the biological…, and the economic by Reguzzonia (2018) community.” Agriculture that protects and intentionally enhances natural resources General Mills (2018) and farm communities. Regenerative Agriculture Burgess et al. (2019)
9 2.6 Selected regenerative agriculture systems There are a wide range of potential regenerative agricultural systems and practices. Serle (2017) identified the regenerative capacity of conservation tillage, cover cropping, enhanced crop rotations, residue retention, pasture cropping, and planned grazing. The Ellen MacArthur Foundation and SYSTEMIQ (2017) considered regenerative practices to include permaculture, organic agriculture, no-till polyculture, holistic grazing and keyline land preparation. Building on these together with Toensmeier (2016) and Drawdown (2017), this report examines the extent to which nine systems can be considered as regenerative. Each of the nine systems meets at least two of the three criteria of minimising tillage, minimising bare soil, and fostering plant diversity. The animal-based silvopasture and multi-paddock and organic grazing systems meet all four of the criteria (Table 3). Table 3. Selected regenerative agricultural systems and how they include five regenerative agriculture practices System Minimise Minimise Foster Integrate Synthetic tillage bare soil plant crops and fertilizers/ diversity animals pesticides Conservation agriculture Organic crop production Tree crops Tree intercropping Multistrata agroforestry Silvopasture Multi-paddock grazing Organic grassland systems Rewilding Legend: means necessary; means prohibited; blank space means optional Conservation agriculture: is a cropping system with minimum tillage that ensures retention of crop residue mulch on the soil surface. Some definitions also include the diversification of plant species (Kassam et al. 2019) through intercropping, cover cropping, green manuring, and agroforestry, the integration of manure and organic materials, and judicious use of chemical fertilizers (e.g. Lal 2009). Organic crop production: the Rodale Institute (2018) uses the term regenerative organic agriculture to describe conservation agriculture that prohibits the use of pesticides and synthetic fertilizers. Whilst regenerative organic agriculture can include animals, it is not a specific requirement. Increased plant diversity is generally a feature of organic systems. Soil health, animal welfare and social fairness are specifically presented as three pillars of regenerative organic agriculture. Tree crops include tree crops used for food production including nuts, staple fruits (e.g. bananas, plantains, breadfruit, and avocado), fruits (e.g. citrus, apple), and beverages (e.g. coffee, tea, and cocoa). Such tree crops are often planted in orchards or in plantations, but many are also used in agroforestry systems. Drawdown (2017) focused specifically on the role of tropical staple crops on carbon sequestration, but this report examines both temperate and tropical species. Such crops typically minimise tillage and the level of bare soil. Plant diversity may not be high. Regenerative Agriculture Burgess et al. (2019)
10

Tree intercropping, or silvoarable agroforestry, is the integration of woody perennials with arable or
horticultural crops at field scale. The presence of trees reduces the need to cultivate the soil and
plant diversity is typically increased.

Multistrata agroforestry is a farming system that integrates different layers of multiple woody
perennials often with understorey herbaceous crops. It differs from multistrata forestry as food is an
output. The presence of trees means that tillage and bare ground is minimised and plant diversity is
increased.

Permaculture, which was coined in the 1970s, is “an integrated, evolving system of perennial or self-
perpetuating plants and animal species useful to man” (Mollison and Holmgren, 1981). Holgrem
(2002) has also defined permaculture as “consciously designed landscapes which mimic the patterns
and relationships found in nature, while yielding an abundance of food, fibre and energy”.
Whitefield (2011) reports that the inspiration for permaculture is to combine the self-reliance of a
wood with the highly edible nature of a wheat field.

Silvopasture is the practice of integrating trees and the grazing of animals in a mutually beneficial
way (Rodale Institute 2018). Because grass is largely a perennial crop, tillage and bare soil is
minimised, and plant diversity is greater than conventional grassland.

Multi-paddock grazing refers to rangeland management where the grazing unit has livestock on it
for less than 10% of the time (Rhodes 2017). It is also known as “holistic planned grazing” (Teague et
al. 2013) and has been called a regenerative practice (Lovins 2016; Teague and Barnes 2017). Like
most grazing systems it minimises soil tillage and bare ground, but it also includes more complex
rotations. It has also been termed “pulse grazing” and a “permaculture approach to rangeland
management” (Rhodes 2017).

Organic grazing refers to certified organic livestock systems that prohibit the use of synthetic
pesticides and fertilisers.

Rewilding and agricultural land abandonment can mean different things in different locations. In
America rewilding generally relates to the restoration of large wilderness areas with a focus on a
dominant carnivore such as wolves (Corlett 2016). In this report, we use “rewilding” in the European
sense of assisting the “regeneration of natural habitats through passive management approaches”
(Navarro and Pereira 2015), which has also been termed “ecological rewilding”. Rewilding is likely to
minimise the extent of bare soil and it can include food production (Lorimer et al. 2015).

2.7 Conclusions
The definition of regenerative agriculture used in this report is “a system of principles and practices
that generates agricultural products, sequesters carbon, and enhances biodiversity at the farm
scale”. This definition is very close to the definition of organic agriculture which has been defined as
“a production management system which promotes and enhances agroecosystem health, including
biodiversity, biological cycles, and soil biological activity” (FAO and WHO 1999). However organic
agriculture specifically avoids the use of synthetic fertilizers and pesticides (FAO and WHO 1999).

Regenerative Agriculture Burgess et al. (2019)
11

An attraction of the term regenerative agriculture is that it provides an engaging narrative to
promote change. In a similar way that a “circular” economy approach contrasts with a “linear”
economy, regenerative agriculture can be contrasted with degenerative agricultural practices that
degrade the soil and reduce biodiversity. Important practices associated with regenerative
agriculture are: 1) abandoning tillage, 2) eliminating bare soil, (3) encouraging plant diversity and 4)
water percolation, and 5) integrating livestock and cropping operations. Some proponents of
regenerative agriculture emphasise the need 6) to minimise inputs, including synthetic fertilizer and
pesticides. Systems that purport to regenerate agriculture are conservation agriculture; regenerative
organic agriculture for cropland and grassland; tree crops; agroforestry systems including tree-
intercropping, multistrata agroforestry and permaculture, and silvopasture; multi-paddock grazing;
and rewilding. Each of these systems includes at least two of the first three regenerative agriculture
practices. The context for the uptake of regenerative agriculture is described in Section 3, and the
impact of each system is considered in Section 4.

Regenerative Agriculture Burgess et al. (2019)
12

3 Context for regenerative agriculture
3.1 Introduction
There are increasing calls to “reverse the direction of travel” regarding land management (Kotiaho et
al. 2016; Pandit et al. 2018) in order to restore natural capital and the ecosystem services which flow
from them. This section explains the principal land use implications of a drive to increase food
production, reduce greenhouse gas emissions and enhance biodiversity. It highlights that
regenerative agriculture is more likely to be successful if it implemented alongside initiatives to
protect existing intact ecosystems, reduce food waste, and constrain per capita consumption of
animal products. The final paragraphs examine the role of land sharing and land sparing.

3.2 Linking land, food demand and production
An improved understanding of the challenges of food production and land use can be developed by
being aware of the current status of the finite global land resource. There are many ways of
describing global land use (e.g. Hurtt et al. 2011; Chang et al. 2016), but the analysis by Smith et al.
(2014) divides land use into five major categories. Using a 2000 baseline, the sum of ice-free land
(13000 Mha) can be categorised as urban (200 Mha), cropland (1300 Mha) plus fallow (200 Ma),
grassland (4600 Mha), forest (4100 Mha), or unused (2600 Mha) (Figure 2). Depending on whether
extensive grazing is included, agriculture covers between 38% and 47% of the land area.

Figure 2. Global land use and arising biomass flows for human use in 2000. Values are in Gt dry
matter biomass/yr (after Smith et al., 2014). The areas are from Erb et al. (2007) and flows from
Wirsenius (2003). Cropland includes arable and permanent crops.

Regenerative Agriculture Burgess et al. (2019)
13

3.2.1 Land use in 2000
As shown in Appendix B, the required area of cropland and grazing land can be related to the global
population, the degree of wastage, the per capita demand for different types of food and other
products, the efficiency of the conversion of crops and grass to animal products, and the yield of
grass and crops per hectare. Using the values in Table 4 and simple algorithms (Table B.1) it is
possible to demonstrate that in 2000, the demand for animal products required 3400 Mha of grazed
grassland to generate a harvested dry matter yield of 1140 kg/ha. In a similar way, the global
demand for crop products required 1300 Mha of cropland to generate a harvested dry matter yield
of crop and crop residues of 4260 kg/ha (Table 4; Table B.2).

Table 4. Indicative areas of cropland and grazing land in 1900, 1950, 2000 and assumed areas
required for a default and a diet-related scenario in 2050 (Derived from Smith et al. 2014 and
Krausmann et al. 2008). A detailed explanation of the values is provided in Appendix B in Table B.3.

Year
 (billion)
 World population

 Level of food waste (%)
 capita (kg DM/capita/y)
 Crop-based demand per
 (kg DM/capita)
 Animal product-demand
 production (kg DM/capita)
 Crop used for animal

 (million ha)
 Cropland area

 yield (kg DM/ha)
 Mean crop and crop residue
 capita (kg DM/capita)
 Demand for grass feed per
 (kg DM/ha)
 Assumed harvest of grass
 (million ha)
 Grazed land area

 Total managed (million ha)
1900 1.65 30 390 18.6 224 758 1336 277 312 1466 2224
1950 2.50 30 390 18.6 224 1083 1417 277 259 2666 3743
2000 6.15 30 390 42.3 510 1300 4260 629 1137 3400 4700
2050 default 9.77 30 390 56.0 675 1600 6503 833 2000 4070 5107
2050 diet 9.77 30 390 42.3 510 1352 6503 629 2000 3072 4398
Values in bold are mentioned in the text; italicised values are scenario estimates for 2050.

3.2.2 Land use from 1900 to 2000
Before examining where current agricultural trends are taking us, it is useful to look at where we
have come from. The global population increased from 1.65 billion in 1900 to 6.15 billion in 2000,
and Table 4 suggests that this was associated with an estimated 111% increase in the global area of
managed land from 2224 Mha in 1900 to 4700 Mha in 2000, with 78% of the increase related to a
greater area of grazed grassland. The analysis also suggests a trebling of mean crop and crop residue
yields from 1336 kg/ha in 1900 to 4260 kg/ha in 2000; similarly the mean yield of grass from grazed
areas increased almost four-fold from 312 kg/ha in 1900 to 1137 kg/ha in 2000. A trebling of annual
yields over a 100 year period can be achieved by an annual yield increase of 1.1%. In fact the values
in Table 4 suggest that prior to 1950 the yield increases were minimal but between 1950 and 2000
crop and harvested grass yields showed a mean annual increase of 2.2% and 3.0% respectively.
These increases were achieved through: 1) improved varieties or breeds of crops and livestock, 2)
improved crop or livestock nutrition, 3) improved husbandry (e.g. less disease and pests, and more
effective management), and 4) planting or growing crops and livestock in the correct place. Against
this, the predicted net effect of climate change on mean yields, even allowing for a positive effect of

Regenerative Agriculture Burgess et al. (2019)
14 increased carbon dioxide concentrations, is about -0.1% per year (IPCC 2014; page 506). These yield increases have enabled food prices to remain relatively low so that absolute and relative undernourishment has decreased and internationally food riots are relatively rare (Berazneva and Lee 2013). 3.2.3 Land use from 2000 to 2050 Looking forward to 2050, the global population is predicted to grow to 9.77 billion and the mean annual consumption of animal products has been predicted to increase from 42.3 kg/capita to 56.0 kg/capita (Table 4). The default calculation indicates that one way to address this is to expand the area of cropland from 1300 Mha in 2000 to 1600 Mha in 2050 and for mean crop and crop residue yields to increase from 4260 kg/ha to 6503 kg/ha (equivalent to a 0.85% annual increase). Similarly the area of grazed grassland could increase from 3400 Mha to 4070 Mha with harvested yields increasing from 1137 kg/ha to 2000 kg/ha (equivalent to a 1.1% annual increase). It has been argued that the application of existing knowledge and technology could lead to 100-200% yield increases in many parts of Africa, and a 100% increase in Russia (Foresight 2011 page 16). The demand for land can be moderated by changes in diet. If the global per capita consumption of animal products in 2050 remains at the 2000 level of 42.3 kg/person/year then, assuming the same yield per hectare increases, there is minimal need to expand the area of cropland and the area of grazed land could actually decrease (Table 4). This is due to the high quantities of grass and crops needed to produce animal products. Although Mottet et al. (2016) reports that about 86% of the materials eaten by livestock are not currently eaten by humans, stabilising per capita consumption of meat products will have major effects on future land use (e.g. Wirsenius et al. 2010). There are also potential health benefits from reducing meat consumption in developed countries (Whitmee et al. 2015; Willett et al. 2019). The analysis in Table 4 also highlights the benefits from reducing waste, assumed to be 30%. 3.3 Carbon sequestration and greenhouse gas emissions Agriculture, Forestry, and Other Land Use (AFOLU) is responsible for about a quarter of global greenhouse gas (GHG) emissions (10 billion t CO2eq/yr), and about half is due to land use change (4.3–5.5 billion tCO2eq/yr in 2010) (Smith et al. 2014). Using the land areas in Table 4 for crops (Acrop), grass (Agrass) and forests (Aforest) and making indicative assumptions about mean above-ground and soil carbon storage per land use (e.g. Ccrop), it is possible to estimate the carbon storage (Ctotal) and thereby the possible changes in storage (Table 5). = Acrop Ccrop + Aforest Cforest + Agrass Cgrass Such analyses highlight the importance of minimising losses of forest and wooded land to reduce the release of carbon dioxide. The net annual carbon changes of 0.3 to 1.2 Gt C, equate to 1.1 to 4.4 Gt CO2, which is comparable to the calculated annual loss of 5.9 ± 2.9 Gt CO2eq from land use change during the 1990s (Flynn et al. 2011). Other sources of agricultural emissions (5.2 billion t CO2eq/yr) include poor soil management (1.5-2 billion t CO2eq/yr) and enteric fermentation by cattle (2 Gt CO2eq/yr) (Smith et al. 2014). Agriculture-related fossil fuel emissions (included in energy figures) amounted to 0.5 Gt CO2eq/yr in 2010 (Smith et al. 2014). Regenerative Agriculture Burgess et al. (2019)
15

Table 5 Indicative analysis of how the land use changes in Table 4 could affect carbon storage

Year Area (Mha) Above- Total SOC Net
 Crop Grazed Total Forest Unused, Total ground storage carbon
 land land grass and fallow storage (billion loss
 land woods and (billion t tonnes)c (Gt C y-1)c
 urbana C)b
1900 758 1466 4542 4700 3000 13000 700 2332
1950 1083 2666 4617 4300 3000 13000 648 2324 1.2
2000 1300 3400 4600 4100 3000 13000 621 2318 0.8
2050 1600 4070 4300 4100 3000 13000 621 2304 0.3
a
 : Estimates of forest cover in 1900 and 1950 are derived from Ramankutty et al. (2006).
b:
 Values for 2000 from Smith et al. (2014)
c -1 -
 : Assumes cropland above- and below-ground C (5 + 142) is 147 t C ha , and grassland C (7 + 189) is 196 t C ha
1 -1
 (Houghton (1999). The mean forest above ground dry matter is assumed to be 137 t C ha (Houghton, 1999).
 -1
It is assumed that the mean soil C content under forest is 10% lower than for grassland i.e. 170 t C ha (Guo
 -1
and Gifford, 2002). This is higher than the mean of 121 t C ha for forest soils proposed by Houghton (1999).

3.4 Biodiversity
Recent studies have highlighted the continued decline in global biodiversity (e.g. IPBES 2018b;
Sanchez-Bayo and Wyckhuys 2019). The current global decline in biodiversity has been driven by
land use change (Sala et al. 2000; Wilting et al. 2017) and the increasing intensity of land use
(Alkemade et al. 2009). One method for expressing the effect of land use on biodiversity is in terms
of the mean species abundance (i.e. the ratio of the mean species abundance relative to the original
abundance). The mean species abundance can range from 1.0 in primary forests and grassland to 0.1
and below for intensive agriculture and urban areas (Table 6). These values highlight the
conservation benefits of preserving areas of primary habitat. However some agricultural methods
such livestock grazing on unimproved pasture (e.g. rangeland systems), agroforestry, and mosaics of
crops and native trees can still maintain relatively high levels of biodiversity.

Table 6. Relationship between global land use and mean species abundance, with intact areas of
forest and grass and shrubland given a value of 1 (Alkemade et al. 2009)

Land use Mean species Standard
 abundance error
Forest (Primary vegetation) 1.0 0.1
Forest (lightly used naturally occurring tree species) 0.7 0.07
Forest (Secondary vegetation with different cover) 0.5 0.03
Forest (Plantation with exotic species) 0.2 0.04
Grass and shrubland (Primary vegetation) 1.0
16

The mean species abundance is also responsive to the level of excess nitrogen; for example it can
decline by 40% when the surplus nitrogen changes from 0 to 50 kg N/ha (Alkemade et al. 2009). The
mean species abundance is also a function of patch-size, with mean species abundance reducing
from about 0.8 with a patch size of 10,000 ha to less than 0.1 with a patch size of less than 100 ha
(Alkemade et al. 2009).

3.5 Land sparing and land sharing
The above paragraphs frame the use and promotion of regenerative agriculture in the context of the
global challenges of population growth, the demand for food, climate change, and biodiversity loss.
Within the scientific literature there is often a debate between the benefits of “land sparing” (where
large reserves are set aside for conservation and other ecosystem services delivery) and “land
sharing” approaches (where on-farm practices increase on-farm biodiversity) (POST, 2012; Hobbs et
al. 2014). Sections 3.3 and 3.4 highlight that a key component of a global drive to store carbon and
enhance biodiversity (particularly for specialist species) is to protect existing primary forests and
grasslands in large non-fragmented areas i.e. land sparing is necessary. The current proportion of
land protected because of their biodiversity and associated ecosystems services is 15% (FAOSTAT
2019), which is close to the 17% specified in the Aichi targets (Convention on Biological Diversity
2010).

Assuming the above need for protected areas, the question is then how sufficient food can be
provided on the existing farmland. The analysis highlights that demand-reduction strategies such as
minimising waste and constraining per capita consumption of animal products can reduce the
required yield increases per hectare. Assuming that mean per capita meat consumption remains at
its current level, the global mean annual yield increase required per hectare is about 1%. For the
next 30 years with good governance, such yield increases should be exceeded in regions like Russia
and Africa where yields are currently low. In areas like Oceania, North America and Western Europe
where yields are currently high, despite the increasing global demand for food, agricultural land is
actually being abandoned (See Section 5.2.4). In such regions, there are options to either focus on
either increased food production on a smaller area, or to continue the production of food whilst
improving carbon sequestration and biodiversity on the same area of land.

Recently some authors argue that in practice the choice is not between land sparing and land
sharing, but that land sparing needs to implemented at a range of scales e.g. multiple-scale land
sparing (Kremen 2015; Ekroos et al. 2016). At a field- or farm-scale, this may include a range of
diversified and regenerative farming systems (Kremen et al 2010; Loos and von Wehrden 2018).
Sparing land at field-scale, such as providing refuge for pollinators, can also provide yield benefits.
The success of land sparing from a conservation perspective also depends in part on ensuring that,
for example, “spared land” actually enhances biodiversity (Balmford et al. 2018), and it may depend
on spatial differences in the environmental and agricultural suitability of land (Grau et al. 2013).

The rest of this report focuses on selected regenerative agricultural systems that combine
agricultural production, with reduced greenhouse gas emissions, and enhanced biodiversity at the
farm-scale.

Regenerative Agriculture Burgess et al. (2019)
17

4 Impacts of regenerative agriculture systems
4.1 Introduction
The eventual success of regenerative agriculture systems does not rest on their promise, but on their
capacity to deliver on the ground. Some people are sceptical. For example, McGuire (2018) has
defined regenerative agriculture as “conservation agriculture and holistic grazing plus exaggerated
claims”. This section reviews the evidence regarding the impact of the selected systems.

4.2 Method
For each regenerative agricultural system we developed a spreadsheet of evidence based on
published literature (Appendix C). Building on the review in Section 3, there was a particular focus
on the effect of the system on crop and livestock yields, greenhouse gas emissions, and biodiversity.
The effect on water storage was not specifically examined. The number of references was greatest
for conservation agriculture (n = 21) and organic agriculture (n = 33) and least for tree crops (n = 6).
The analysis of the level of confidence was based on the IPBES “four-box” model for qualitative
communication of evidence (IPBES 2017, 2018a). The definitions of the terms relating to confidence
are:
Inconclusive: existing as or based on a suggestion or speculation; no or limited evidence.
Unresolved: multiple independent studies exist but conclusions do not agree.
Established but incomplete: general agreement although only a limited number of studies exist but
 no comprehensive synthesis and, or the studies that exist imprecisely address the
 question.
Well established: comprehensive meta-analysis or synthesis or multiple independent studies that
 agree.

Figure 3. Four box model of the level of agreement and the quantity and quality of evidence (IPBES,
2018a).

An important part of the method was to define a specific base-line or counterfactual for each
intervention. For example organic agriculture may only provide mean yields of 0.68-0.90 of a well-
fertilised and well-managed non-organic system (Lesur-Dumoulin et al. 2017). However, it can
provide a yield equivalent to 1.43 to 1.87 of a non-fertilised control plot of sorghum in Africa

Regenerative Agriculture Burgess et al. (2019)
18

(Tonitto and Ricker-Gilbert 2016). It is also important to note that the analyses focus on the mean
response. For example, Lesur-Dumoulin et al. (2017) in a global meta-analysis also reported that
whilst the mean yields of organic horticultural crops were 0.68 to 0.90 of non-organic crops, there
was variation: with 10% of incidence resulting in only 50% of the yield, and a 20% chance of higher
yields.

4.3 Results
Each of the nine regenerative systems leads to increases in soil carbon and similar or enhanced
levels of on-farm biodiversity (Table 8). However their effect on yields, input costs, and tree carbon
and products varies according to the specific system and the baseline comparison. Each is
considered in turn.

4.3.1 Conservation agriculture
We reviewed 21 papers that quantified the impact of conservation agriculture or more specifically
the effect of no tillage relative to conventional tillage (See Table C.1 in the Appendix). The main
impacts are described in Table 7 and below with the quality of evidence indicated in brackets.
Because large areas of conservation agriculture depend on the use of glyphosate (Schmitz and
Garvert 2012), the current risk of a glyphosate ban in some countries is an area for further research.
Soil carbon: the lack of tillage associated with conservation agriculture leads to increases in soil
carbon in the surface layers (Well established). For example Haddaway et al. (2017) report a 9%
increase in soil organic carbon at a depth of 0-30 cm. However there is no clear evidence that it
increases soil carbon below the surface layers (Well established).
Biodiversity: Doran (1980) reports that the level of soil biodiversity in the top 7 cm of soil increased
with no-tillage, but that it decreased below 7 cm (Established but incomplete).

Table 7. Impacts of conservation agriculture, and specifically no-tillage (NT) relative to conventional
tillage (CT)

Statement Confidence Effect
Soil carbon: NT, relative to CT, increases soil carbon in surface layers Well established Benefit
NT and CT result in similar levels of soil carbon below 20 cm Well established Similar
Biodiversity: NT, relative to CT, increased diversity in surface layers but Established but Similar
decreased it at depth incomplete
Yields: NT and CT result in similar mean yields of oilseed and cotton Well established Similar
NT and CT results in similar mean yields of maize and wheat under dry Well established Similar
unirrigated conditions
NT, compared to CT, reduces mean yields of root crops Well established Disadvantage
NT, compared to CT, reduces mean yields of maize and wheat when Well established Disadvantage
there is no or minimal drought stress
Other: NT and CT have similar greenhouse gas emissions per unit food Unresolved
NT, relative to CT, reduces fuel costs Well established Benefit
NT, relative to CT, increases farm profitability Inconclusive
References reviewed for no-tillage: Alluvione et al. (2009); Bayer et al. (2015); Blanco-Canqui and Lal
(2008); Doran (1980); Drawdown (2017); Fernandez (2016); Haddaway et al. (2017); Halvorson and Grosso
(2009); Huggins and Reganold (2008); Hutchinson et al. (2007); Mathew et al. (2012); Metay et al. (2009);
Passianoto et al. (2003); Pittelkow et al. (2015); Potter et al. (1997); Robertson et al. (2000); Roldan et al.
(2004); Smith et al. (1998); Tuomisto et al. (2013); VandenBygaart et al. (2003); West and Post (2012)

Regenerative Agriculture Burgess et al. (2019)
19

Table 8. Indicative main effects of nine regenerative systems (expressed as effect of intervention divided by baseline) with illustrative references

Regenerative Counterfactual or Soil carbon On-farm biodiversity Mean crop, grass or Input costs Tree carbon
Intervention baseline livestock yield and products
Conservation Crop production with 1.09 ~1.00 0.86-1.01 Lower 0
agriculture intensive tillage (Haddaway et al. 2017) (Doran 1980) (Pittelkow et al. 2015) (Huggins and Reganold 2008)
Regenerative Crop production with 1.07-1.09 1.30-1.50 0.48-0.92 Lower to higher 0
organic (e.g. fertilizers and/or (Mondelaers et al. 2009; (Bengtsson et al. 2005) (Clark & Tilman 2017; (LaCanne and Lundgren 2018;
organic crop agrochemicals Tuomisto et al. 2012) Cooper et al. 2016) Crowder and Reganold 2015)
production with Crop production with 1.07-1.09 Inconclusive 1.01-1.07 Higher 0
organic no amendments or (Mondelaers et al. 2009; (Hijbeek et al. 2017) (Crowder and Reganold 2015)
amendments) fertilizers Tuomisto et al. 2012)
Tree crops Annual crop 1.18 Higher 0.75-1.60 Inconclusive Higher
 production (Guo and Gifford 2002) (Simon et al. 2010) (Bidogeza et al. 2015)
 a
Tree intercropping Annual crop 1.16 1.37 0.42-1.00 Lower to higher Higher
 production (Kim et al. 2016) (Torralba et al. 2016) (Garcia de Jalon et al. 2018a) (Garcia de Jalon et al. 2018b)
Multistrata Monoculture 1.57 Higher Variable Inconclusive Higher
agroforestry permanent crops (Zake et al. 2015) (De Beenhouwer et al.2013) (Niether et al. 2019)
 a
Silvopasture Grassland 1.00-1.18 1.21 0.77-1.18 Similar to higher Higher
 (Upson et al., 2013; (Torralba et al. 2016) (Seddaiu et al. 2018) (Garcia de Jalon et al. 2018b)
 Seddaiu et al. 2018) (Torralba et al. 2016)
 b
Multi-paddock Grassland; 0.99-1.50 Inconclusive 0.98-1.00 Higher 0
Grassland continuously grazed (Sanderman et al. 2015; (Hawkins 2017) (Hawkins 2017)
 Teague et al. 2011) (Derner and Hart 2007)
Grassland receiving Grassland: receiving 1.20 Higher 0.70-1.50 Inconclusive 0
organic fertiliser synthetic fertilizer (Kidd et al. 2015) (Mueller et al. 2014) (Mueller et al. 2014)
but not synthetic (Kidd et al. 2015)
fertilizer Grassland: receiving no 1.30 0.94 1.98 Inconclusive 0
 fertilizer (Gravuer et al. 2019) (Gravuer et al. 2019) (Gravuer et al. 2019)
Rewilding and Crop and grazing Higher Variable 0.11-0.80 Inconclusive Higher
abandonment of systems (Conant et al. 2001) (Rey Benayas et al. 2007) (Cerqueira et al. 2015)
agriculture (Lasanta et al. 2015) (derived from Spencer 2017)
a
 : Crop and grass yield responses in agroforestry are very sensitive to number of trees per unit area;
b:
 Whilst grass production may be similar; multi-paddock systems may allow higher stocking rates.

Positive effect: Positive/similar: Similar or very variable: Similar or negative: Negative:

Regenerative Agriculture Burgess et al. (2019)
20

Yield: Pittelkow et al. (2015) in a global meta-analysis reports that conservation agriculture results in
mean yields that were 86% to 101% of those obtained with tillage. They reported similar yields for
oilseeds, legumes and cotton, and under dry conditions for maize and wheat (Well established). One
reason for this is improved soil moisture retention. However in other environments there was
typically a yield loss (Well established). Possible reasons for this include poorer seed-soil contact at
establishment and weed control (Giannitsopoulos et al. 2019). Compared to this, the mean 8% yield
benefit of conservation agriculture relative to conventional agriculture quoted by Drawdown (2017)
seems high. The reason for the discrepancy may be the choice of case-studies used by Drawdown.
Other: there was no consistent reported effect on greenhouse gas emissions (Unresolved), with a
tendency for CO2 emissions to reduce and N2O emissions to increase. Conservation agriculture
typically results in lower machinery and fuel costs associated with no tillage relative to ploughing
(Well established). We did not find clear evidence of the effect of conservation agriculture on farm
profitability (Inconclusive), but the combination of similar yields with reduced costs means that it is
financially profitable in some places. In fact in many regions, conservation agriculture is now viewed
as “conventional” agriculture (Pretty 1995, page 208).

4.3.2 Organic crop production
Management: a European meta-analysis by Tuomisto et al. (2012) found that organic, compared to
non-organic, farms apply a higher level of organic amendments (Table 9).
Soil carbon: Across a wide range of systems, organic agriculture results in a higher level of soil
organic carbon (Well established). However it should also be noted that the application of chemical
fertilizer (Han et al. 2016) increases soil organic carbon relative to adding no fertiliser (Well
established) (Box 1; Table 9; Table C.2 in the Appendix).

Box 1: Organic amendments and chemical fertilizers both increase soil carbon relative to no
addition
Levels of soil organic matter depend primarily on the annual organic matter input either from plant
inputs or animal manure. Greenland (1997) reported that nutrients removed by a crop need to be
replaced in some way and that any other approach will be a “dangerous illusion” unless it can do
this. Smaje (2018) notes that “anecdotal claims that crops will do better without synthetic fertiliser
are all very well, but such claims have to stay on amber until more quantitative data is forthcoming”.

Our review demonstrates that the overall effect of adding organic amendments (compared to no
amendment) is to increase soil organic matter levels. A recent meta-analysis by Han et al. (2016)
indicates that the overall effect of adding chemical fertilizers (compared to no fertilizer) is to
increase soil organic matter, due to increased dry matter production. However over a period of time,
although adding fertiliser is better than adding no fertiliser, the soil organic matter below arable
crops can still decline due to cultivation and the enhanced activity and respiration of soil organisms
(Khan et al. 2007). Van Groenigen et al. (2017) also note that a global drive to increase soil organic
carbon will need increased levels of soil nitrogen. Syers (1997) argues that in most cases both
inorganic and organic inputs are beneficial.

Biodiversity: Studies such as Bengtsson et al. (2005) and Lichtenberg et al. (2017) have
demonstrated that organic systems increase the on-farm diversity of birds, soil invertebrates, and
arthropods including pollinators (Well established). However in terms of crop yields this also
includes the presence of weeds (Well established). We did not find evidence of the effect of adding
organic amendments on the biodiversity of non-fertilised cropland (Inconclusive).

Regenerative Agriculture Burgess et al. (2019)
You can also read