Cost-Benefit Analysis of Various Electric Reliability Improvement Projects from the End Users' Perspective NARUC Grants & Research
←
→
Page content transcription
If your browser does not render page correctly, please read the page content below
2013

                    Cost-Benefit Analysis of
                  Various Electric Reliability
                Improvement Projects from
                 the End Users’ Perspective
NARUC
                NARUC Grants & Research

                                       November 2013

The National
Association
of Regulatory               A report for the Maryland Public
                         Service Commission Funded by the
Utility                           U.S. Department of Energy
Commissioners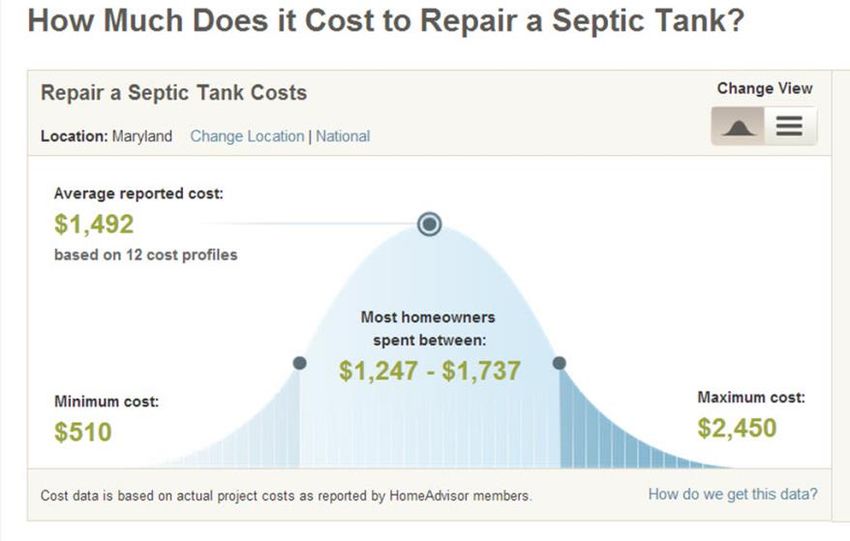
NARUC AND MDPSC COST-BENEFIT
ANALYSIS OF VARIOUS ELECTRIC
RELIABILITY IMPROVEMENT
PROJECTS FROM THE END USERS'
PERSPECTIVE
Analysis Summary
November 15, 2013

                    Mark Burlingame
                       Patty Walton
NARUC and MDPSC
      A Cost-Benefit Analysis of Various Electric Reliability Improvement Projects
                           From the End Users' Perspective

TABLE OF CONTENTS
1     INTRODUCTION                                                                                                   6
    1.1      INTRODUCTION                                                                                            6
       1.1.1      Statement of the purpose                                                                           6
      1.1.2        Objectives and significance of the study                                                          6
      1.1.3        Questions and Sub-questions                                                                       7
      1.1.4        Definitions                                                                                       7
      1.1.5        Delimitations & limitations                                                                       8

2     EXECUTIVE SUMMARY                                                                                             10
3     QUANTITATIVE ANALYSIS                                                                                         13
    3.1       ANALYSIS APPROACH – A DESCRIPTION OF METHODS UTILIZED TO IDENTIFY AND QUANTIFY THE COSTS OF OUTAGES
    INCURRED BY RATEPAYERS FOR VARYING PERIODS OF TIME                                                              13
    3.2       HARDSHIPS AND DIRECT COSTS OF BEING WITHOUT ELECTRICITY                                               14
      3.2.1        Residential Customer Hardships and Direct Costs                                                  14
      3.2.2        Commercial Customer Hardships and Direct Costs                                                   27
      3.2.3        Industrial Customers Hardships and Direct Costs                                                  35
    3.3       VALUE OF LOST LOAD - WILLINGNESS TO ACCEPT THE COST OF AN OUTAGE                                      44
      3.3.1        Residential Customers VoLL                                                                       47
      3.3.2        Commercial Customers VoLL                                                                        50
      3.3.3        Industrial Customers VoLL                                                                        54
    3.4       A SURVEY OF COMPENSATION/REFUNDS TO CUSTOMERS FOR OUTAGES                                             60
    3.5       TEMPLATE TO REPLICATE IN OTHER JURISDICTIONS                                                          62

4     MITIGATION MEASURES TO ADDRESS ELECTRICAL OUTAGES                                                             62
    4.1       INTRODUCTION TO MITIGATION MEASURES                                                                   62
    4.2       VEGETATION MANAGEMENT                                                                                 63
    4.3       UNDERGROUNDING OF DISTRIBUTION SYSTEM                                                                 69
    4.4       DELIVERY SYSTEM IMPROVEMENTS                                                                          75
      4.4.1        Transmission and Area Distribution                                                               76
      4.4.2        Local Distribution System or Microgrid Improvements                                              78
      4.4.3        Local Substation Automation                                                                      80
      4.4.4        Circuit Loops with Smart Switches                                                                80
      4.4.5        Undergrounding Local Cables (Lower Voltage)                                                      80
    4.5       END-USE INVESTMENTS                                                                                   80
      4.5.1        Smart Meters                                                                                     81
      4.5.2        Home Automation                                                                                  81

                                                              1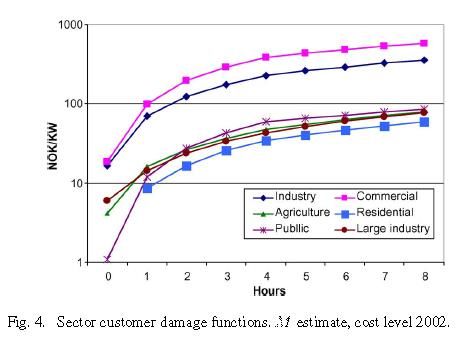
NARUC and MDPSC
      A Cost-Benefit Analysis of Various Electric Reliability Improvement Projects
                           From the End Users' Perspective
    4.6       REPLACEMENT OF FEEDERS                                                 81
    4.7       CALL CENTER IMPROVEMENTS                                               82
    4.8       UTILITY WORK FORCE                                                     83
      4.8.1        Staffing Levels to Respond to Outages                             83
      4.8.2        Training Availability                                             83
      4.8.3        Preparing for an Aging Workforce                                  84
    4.9       OUTAGE PROCESS IMPROVEMENTS                                            84
    4.10      FACILITIES THAT REQUIRE BACKUP GENERATION                              85
    4.11      MARYLAND ENERGY ASSURANCE PLAN                                         85
    4.12      PROTECTING MEDICALLY VULNERABLE CITIZENS                               85

5     CRITICAL INFORMATION FOR INFORMED DECISION-MAKING                              86
    5.1       COMPARISON OF VARIOUS STUDIES                                          86
    5.2       COST/BENEFIT ANALYSIS                                                  86

6     CONCLUSIONS AND RECOMMENDATIONS                                                86
    6.1       CONCLUSIONS                                                            86
    6.2       RECOMMENDATIONS                                                        87

7     APPENDICES                                                                     88
    7.1       NATURAL GAS TARIFF                                                     88
    7.2       LIST OF SOURCES                                                        91

                                                           2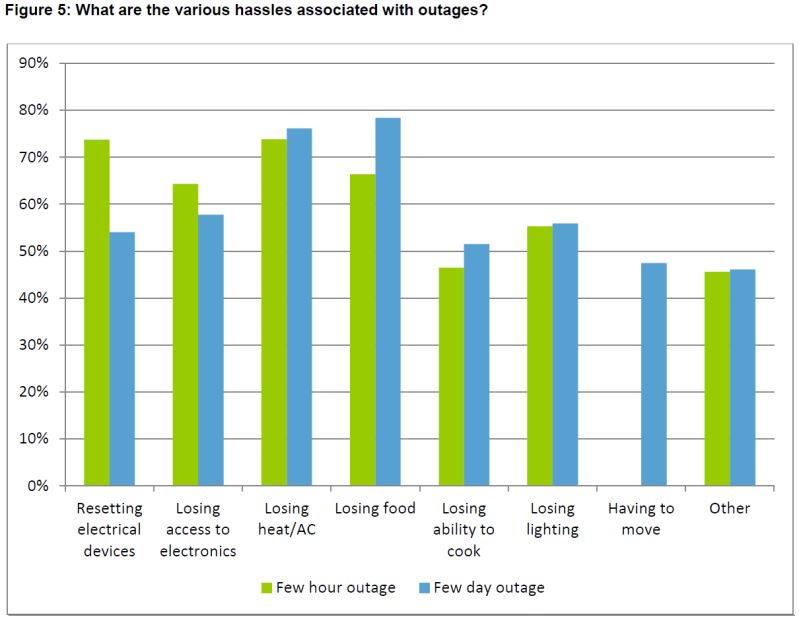
NARUC and MDPSC
       A Cost-Benefit Analysis of Various Electric Reliability Improvement Projects
                            From the End Users' Perspective

List of Figures and Tables

Figure 1 Cost to Repair a Septic Tank in Maryland .................................................................................. 16
Figure 2 Loads/Circuits Relative to Home Backup Generator Capacity.................................................... 17
Figure 3 August 2013 Utility Supplier Prices – BGE12 Month Fixed Price Residential Contract (Source:
     http://www.opc.state.md.us/opc/ConsumerCorner/Publications.aspx#Gas) ................................. 18
Figure 4 List of “Hassles” faced by residential customers (Bates White Economic Consulting, 2012) ...... 25
Figure 5 “Biggest Hassles” of Outages (Bates White Economic Consulting, 2012) ................................... 26
Figure 6 2011 Montgomery County PEPCO Work Group Survey Results for Commercial Customers ...... 35
Figure 7 EPRI Costs per Duration (EPRI/primen Report Table 2-1) .......................................................... 38
Figure 8 Example of Industrial Scale Generation .................................................................................... 40
Figure 9 Medium & Large US C&I Customer Segments CDF Curve (Lawrence Berkeley National
     Laboratory: "Estimated Value of Service Reliability for Electric Utility Customers in the United
     States", Freeman, Sullivan & Co., June 2009) ................................................................................. 46
Figure 10 Norwegian CDF Curves for all Customer Segments (“Customer Costs Related to Interruptions
     and Voltage Problems: Methodology and Results”, IEEE TRANSACTIONS ON POWER SYSTEMS, VOL.
     23, NO. 3, AUGUST 2008) ............................................................................................................... 46

Table 1 Cost of Different Sizes of Home Backup Generation................................................................... 17
Table 2 Daily Cost of Operating Backup Generation ............................................................................... 18
Table 3 Other costs for residential customers ........................................................................................ 20
Table 4 Detailed List of Residential Direct Costs for Prolonged Outages ................................................. 21
Table 5 Sample 1 of How to Use the Data for Residential Customers ..................................................... 23
Table 6 Sample 2 of How to Use the Data for Residential Customers ..................................................... 24
Table 7 Summary of 2011 Montgomery County PEPCO Work Group Survey Results .............................. 25
Table 8 Maryland Commercial and Industrial GDP
     (http://choosemaryland.org/factsstats/Pages/GrossDomesticProduct.aspx).................................. 28
Table 9 Maryland Companies in Terms of Number of Employees (2009 US Census) ............................... 29
Table 10 Maryland Commercial Customers Segmented by Size in Average MWh Consumed per Year (EIA
     2011) ............................................................................................................................................. 29
Table 11 Operating Cost of Backup Generation for Commercial Customers ........................................... 31
Table 12 Installed Costs of Backup Generation for Commercial Customers ............................................ 31
Table 13 Detailed List of Commercial and Small Industrial Customers’ Direct Costs for Prolonged Outages
     ...................................................................................................................................................... 33
Table 14 Sample of How to Use the Commercial Cost Data .................................................................... 34
Table 15 Maryland Industrial Customers Segmented by Size in Average MWh Consumed per Year (EIA
     2011) ............................................................................................................................................. 36
Table 16 EPRI Industrial Customer Segments Surveyed (EPRI/primen Report Table 1-1) ........................ 37
Table 17 Individual Costs per Outage (EPRI/primen Report Table 2-1) ................................................... 39
Table 18 Costs of Industrial Scale Backup Generation ............................................................................ 41
Table 19 Detailed List of Industrial Customers’ Direct Costs for Prolonged Outages ............................... 42
Table 20 Sample of How to Use the Industrial Cost Data ........................................................................ 43
Table 21 Comparison of Various Studies Customer Damage Function Results Standardized to Maryland
     ...................................................................................................................................................... 47

                                                                              3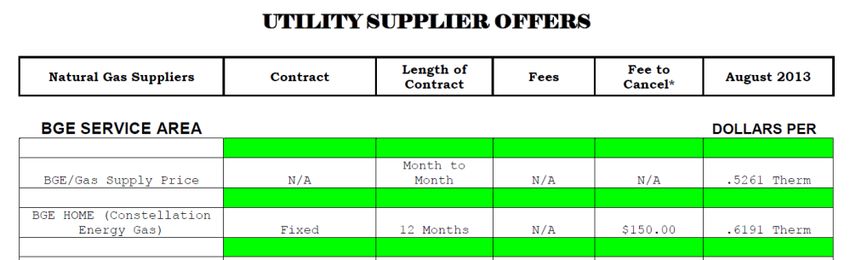
NARUC and MDPSC
      A Cost-Benefit Analysis of Various Electric Reliability Improvement Projects
                           From the End Users' Perspective

Table 22 Cost of Prolonged Outages for Maryland Residential Customers Based on the LBNL 2009 CDF 49
Table 23 Estimate of Maryland Commercial Costs Using the 2009 LBNL CDF .......................................... 53
Table 24 Comparison of Industrial Customer VoLL Results Standardized to $ 2011 and 7,140
     MWh/Customer............................................................................................................................. 56
Table 25 Cost of Prolonged Outages for Maryland Industrial Customers Standardized to $ 2011 and 135
     MWh/Customer............................................................................................................................. 59
Table 26 Summary of Outage Compensation Schemes across the US ..................................................... 61
Table 27 Estimate of Maryland Miles and Cost for Vegetation Management ......................................... 68
Table 28 Project Costs to Underground ................................................................................................. 72
Table 29 DC Cost for Undergrounding.................................................................................................... 72
Table 30 Maryland Customer Count by Utility........................................................................................ 73
Table 31 Maryland Cost Estimates for Undergrounding ......................................................................... 73
Table 32 Estimated Cost Structure for Maryland Undergrounding ......................................................... 74
Table 33 Transmission and Area Distribution Investments ..................................................................... 77
Table 34 Distribution Improvement Costs .............................................................................................. 79

                                                                       4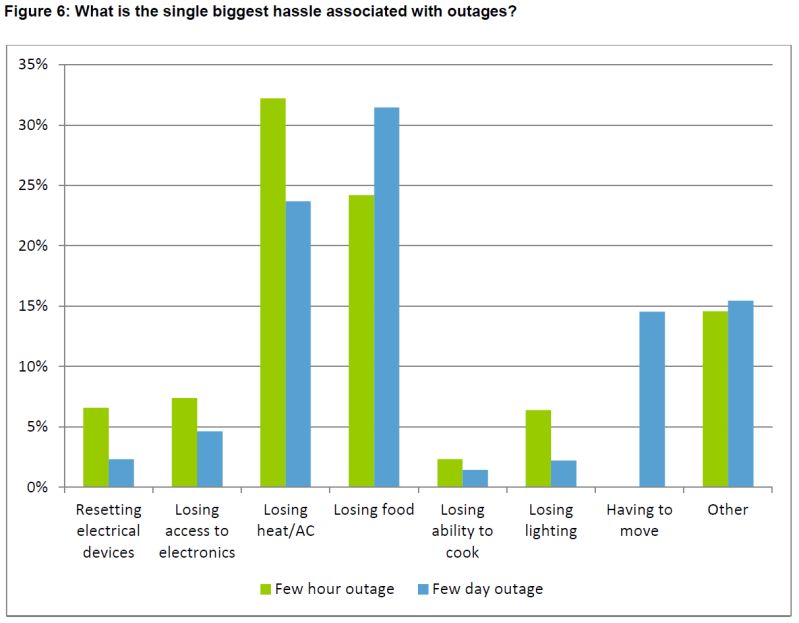
NARUC and MDPSC
    A Cost-Benefit Analysis of Various Electric Reliability Improvement Projects
                         From the End Users' Perspective

                                      Acknowledgment:

This material is based upon work supported by the Department of Energy, under Award Number(s) DE-
OE0000123."

Disclaimer: "This report was prepared as an account of work sponsored by an agency of the United
States Government. Neither the United States Government nor any agency thereof, nor any of their
employees, makes any warranty, express or implied, or assumes any legal liability or responsibility for
the accuracy, completeness, or usefulness of any information, apparatus, product, or process disclosed,
or represents that its use would not infringe privately owned rights. Reference herein to any specific
commercial product, process, or service by trade name, trademark, manufacturer, or otherwise does
not necessarily constitute or imply its endorsement, recommendation, or favoring by the United States
Government or any agency thereof. The views and opinions of authors expressed herein do not
necessarily state or reflect those of the United States Government or any agency thereof.

                                                   5
NARUC and MDPSC
A Cost-Benefit Analysis of Various Electric Reliability Improvement Projects
From the End Users' Perspective
Analysis Summary
1 INTRODUCTION
1.1 INTRODUCTION
1.1.1 Statement of the purpose
The Maryland Public Service Commission (MDPSC) commissioned a study to be conducted of a Cost-
Benefit Analysis of Various Electric Reliability Improvement Projects from the End Users' Perspective
through Capacity Assistance of the National Association of Regulatory Utility Commissioners (NARUC).
The purpose of the study is to quantify costs to customers of extended outages and the mitigating
measures to avoid outages, reduce duration, and restore power.
1.1.2 Objectives and significance of the study
The following three objectives have been identified and constitute the body of this report:
1. Analytical, quantitative section
o set forth a methodology to identify and quantify the costs of outages incurred by
ratepayers for varying periods of time (e.g. one day, two days, three days, four days, one
week)
o establish a template to replicate in other jurisdictions
o identify, through published and survey research, various hardships of being without
electricity
o develop costs associated with each hardship, including, but not limited to:
1. ruined food
2. being without water (if on a well and septic system)
3. operating a home generator
4. hotel room
5. relocating a home-based business
6. accommodations for the elderly and disabled
7. reduction in lost productivity, wages, and revenue to businesses
2. Identify mitigation measures to address electrical outages
o quantify capital costs
o quantify operating costs
3. Cost-benefit analysis
o provide data necessary to inform decision-making and improve the quality of life for
ratepayers, who are now frequently impacted by these outages
6NARUC and MDPSC
A Cost-Benefit Analysis of Various Electric Reliability Improvement Projects
From the End Users' Perspective
The report provides sufficient formulary information to be scalable in other jurisdictions. This study will
satisfy this objective by identifying, analyzing, and reporting about public information that may be
associated with costs of outages incurred by ratepayers.
As indicated in Section 3.5 of this report, the template to apply the results of this study in other
jurisdictions is provided in the Cost/Benefit Analysis deliverable which was provided in Microsoft Excel.
The tables from that section are in this report and labeled Table 4.
1.1.3 Questions and Sub-questions
There are three primary questions the study addresses:
What are the costs of outages incurred by ratepayers for varying periods of time (e.g. one day,
two days and/or one week)?
What are quantifiable capital and operating mitigation measures that address electrical outages
and improve reliability?
What cost-benefit analysis can be provided the Commission so that it can make inform decisions
and improve the quality of life for ratepayers frequently impacted by these outages?
1.1.4 Definitions
Added Value of Service Reliability - quantified by the willingness of customers to pay for service
reliability, taking into account the resources (e.g., income) of the residential customer or by a firm’s
expected net revenues associated with the added reliability.
C&I – Commercial and Industrial Electricity Customer Segment.
The commercial segment consists of facilities that provide services and includes the
equipment of: businesses; federal, state, and local governments; and other private and
public organizations, such as religious, social, or fraternal groups, including institutional
living quarters and sewage-treatment facilities.
The industrial segment consists of all facilities and equipment used for producing or
assembling goods. This segment consists of manufacturing (NAICS codes 31-33); agriculture,
forestry, and hunting (NAICS code 11); mining, including oil and gas extraction (NAICS code
21); natural gas distribution (NAICS code 2212); and construction (NAICS code 23).
Customer Damage Function (CDF) - Customers’ economic losses as a result of reliability and power-
quality problems can be summarized by what is called a customer damage function (CDF). This idea was
first suggested in 1994 by Goel and Billinton. They described the customer damage function as a simple
linear equation relating average interruption cost to the duration of an interruption. They used data
collected from customers to describe this function. In 1995, Keane and Sullivan suggested a more
general form of the CDF – that could be used to predict interruption cost values from a number of
variables that have been shown in interruption cost surveys to influence customer interruption costs.
Their form of the CDF appears below:
Loss = f {interruption attributes, customer characteristics, environmental attributes}.
7NARUC and MDPSC
A Cost-Benefit Analysis of Various Electric Reliability Improvement Projects
From the End Users' Perspective
The interruption cost (Loss) in Eq. 1 is expressed in dollars per event, per customer. The factors
on which interruption costs depends are defined as follows:
Interruption attributes are factors such as interruption duration, season, time of day,
and day of the week during which the interruption occurs.
Customer characteristics include factors such as: customer type, customer size, business
hours, household family structure, presence of interruption-sensitive equipment, and
presence of back-up equipment.
Environmental attributes include: temperature, humidity, storm frequency, and other
external/climate conditions.1
Direct Worth Approach (DW) - different interruption scenarios are described and the respondents are
asked to estimate the costs they would experience if the scenario occurs at a predefined reference
time.2
Value-based Reliability Planning - balances the incremental costs of improved reliability in generation,
transmission, and/or distribution against the incremental benefits of enhanced (or maintained) system
reliability with both costs and benefits defined as societal costs and societal benefits.
Value of Lost Load (VoLL) - the value that represents a customer’s willingness to pay or willingness to
accept for reliable electricity service (or avoid curtailment). It is generally measured in dollars per unit of
power (e.g., megawatt hour, “MWh”). Accurately estimating VoLL for a given region and a specific type
of outage is a challenge. VoLL depends on multiple factors such as the type of customer affected,
regional economic conditions and demographics, time and duration of outage, and other specific
characteristics of an outage. VoLL reflects what economists call “equivalent variation” (see Willingness
to Accept) or “compensating variation” (see Willingness to Pay)3
Willingness to Accept (WTA) – compensation that customers would be willing to accept to have a service
interruption.
Willingness to Pay (WTP) – amount of money that customers would be willing to pay to avoid a service
interruption.
1.1.5 Delimitations & limitations
The study is limited to a review of literature published in the past ten years. MD PSC Staff and
Consultants agreed that studies published previous to that period are most likely out of date due to
changes in the US and Maryland economies, and corresponding changes in the use of electric power.
1
This definition is compiled from “Should Public Utilities Compensate Customers for Service Interruptions?” Ken Costello,
Principal Researcher, National Regulatory Research Institute, Report No. 12–08, July 2012; Lawrence Berkeley National
Laboratory: "Estimated Value of Service Reliability for Electric Utility Customers in the United States", Michael J. Sullivan,
Ph.D., Matthew Mercurio, Ph.D., Josh Schellenberg, M.A, Freeman, Sullivan & Co., June 2009; Willingness to Pay to Avoid
Outages: Reliability Demand Survey, Kathleen King, PhD, Bates White Economic Consulting, Washington, DC, June 2012; and
“Estimating the Value of Lost Load”, London Economics International LLC, June 17, 2013.
2
Ibid.
3
Op. Cit. Compiled definition.
8NARUC and MDPSC
A Cost-Benefit Analysis of Various Electric Reliability Improvement Projects
From the End Users' Perspective
The study is limited to secondary research. No primary research (direct surveys of customers) was
deemed necessary for this Study.
No studies of outages lasting longer than 8 hours were found which had been published in the past ten
years. Consultants, after conferring with the authors of two other studies decided that for residential
customers, an 8 hour outage cost could be multiplied by 3 to estimate the cost for a 24 hour outage. For
commercial and industrial customers, the Consultants agreed that 8-9 hour interruption costs would
serve as a good proxy for the cost of a 24 hour outage since most businesses are open for operation for
8-12 hours.
Most studies did not distinguish between capital and operating and maintenance (O&M) costs. Since
this is a critical part of the results, Generally Accepted Accounting Principles (GAAP) were applied to
expenses to distinguish between capital expenses and O&M costs.
9NARUC and MDPSC
A Cost-Benefit Analysis of Various Electric Reliability Improvement Projects
From the End Users' Perspective
2 EXECUTIVE SUMMARY
This report provides two of the three deliverables for the Cost Benefit Analysis of Various Electric
Reliability Improvement Projects from the End Users’ Perspective. One of the two deliverables included
in this report is a Summary Analysis of the cost to customers (residential, commercial, and industrial) of
extended outages provided by day of the week, each 4 day combination of weekday and weekends, and
a week. The other deliverable is a section of Mitigating Measures which describes the types of costs
incurred to avoid outages, reduce duration and restore power. The mitigating measures costs are also
distinguished as capital or operating and maintenance (O&M).
The third deliverable was provided in a Microsoft Excel spreadsheet and contains the costs to customers
of extended outages (Cost-Benefit Analysis). The cost tables are also presented in this report. There are
no tables in the spreadsheet which are not included in this report.
This study is the first of its kind. No other recent publically available study determines the cost to
customers of outages with durations more than 8 hours. The analysis reveals the tremendous costs,
inconveniences, and other effects of outages to customers during catastrophic events.
There are two methods of estimating customer costs discussed in this report; Direct Worth and Value of
Lost Load or Willingness to Pay/Willingness to Accept.
Direct Worth costs address the various hardships of being without electricity through published and
survey research. Some of these were requested in the original request for proposals and some were
found in the 2013 “ERCOT Value of Lost Load Study”. Below is the list of items in each:
Original request for proposals costs
Ruined food
Being without water (if on a well and septic system)
Operating a home generator
Hotel room
Relocating a home-based business
Accommodations for the elderly and disabled
Road/transportation disruption
2013 “ERCOT Value of Lost Load Study” costs
Gas lanterns
Gas stoves
Backup battery supply for electronics
Candles
Ice
Kerosene heaters
Lost wages
10NARUC and MDPSC
A Cost-Benefit Analysis of Various Electric Reliability Improvement Projects
From the End Users' Perspective
A template which includes all the items above was designed to allow customer costs during extending
outages to be calculated more accurately at a detailed level per customer. The template can also be
applied to more accurately estimate the cost to all customers if used in a matrix design. In other words,
the design of the template can calculate an average cost to one customer who has a generator as well as
to all customers who have generators.
Examples of how to use the template are provided. Consultant recommendations are also provided
throughout the report. The recommendations are focused on collecting additional data that can be used
consistently with the template to estimate and project customer costs more accurately.
Value of Lost Load or Willingness to Pay/Willingness to Accept is a method for valuing customer costs of
prolonged outages by surveying customers with a series of precise questions leading to a valuation. A
number of these surveys have been conducted in the US and abroad over the past 20+ years. This study
discusses different survey results and presents a summary of the results of these surveys standardized
to Maryland in 2011 dollars. The data collected focuses on the attributes of the interruptions and the
characteristics of the customers affected by the outages.
The study concludes that daily outage costs for residential customers can range from a low of $33 to a
high of $363. Many factors discussed in the report explain this variation. Among these factors include
time of year, weekday versus weekend day, methodologies, and customer perceptions. Residential
customer behavior characteristic have changed in the last 20 years due in part to the ubiquity of
electronics and the internet. Therefore, additional data collection and analysis should be done.
The mitigation measures are the areas, departments, activities, policies, procedures, etc. at the utility
company that can be implemented, changed or improved in order to avoid, eliminate, or reduce the
occurrence and duration of outages. The gains in mitigation measures help reduce the cost to the utility
and direct costs incurred by customers during outages while improving reliability and time to restore
power. Such measures also improve safety to utility and emergency response personnel during
maintenance and outages.
The major types of mitigation measures discussed include:
Vegetation management,
Undergrounding of distribution system,
Delivering System Improvements,
End-Use Investments,
Replacement of Feeders,
Call Center Improvement,
Utility Work Force,
Outage Process Improvements,
Facilities that Require Backup Generation,
Maryland Energy Assurance Plan, and
Protecting Medically Vulnerable Citizens.
11NARUC and MDPSC
A Cost-Benefit Analysis of Various Electric Reliability Improvement Projects
From the End Users' Perspective
Recommendations are also provided in the mitigating measures section which can be used as a roadmap
for collection new or existing data in a format that can facilitate analysis of capital and operating and
maintenance costs more precisely.
The costs incurred by customers and the mitigating costs analysis can be applied and used in other
jurisdictions. Using standardized methodologies throughout the United States will allow the data to be
rolled up for national profiles as well as provide the cost comparisons by state.
12NARUC and MDPSC
A Cost-Benefit Analysis of Various Electric Reliability Improvement Projects
From the End Users' Perspective
3 QUANTITATIVE ANALYSIS
3.1 ANALYSIS APPROACH – A DESCRIPTION OF METHODS UTILIZED TO IDENTIFY AND QUANTIFY THE
COSTS OF OUTAGES INCURRED BY RATEPAYERS FOR VARYING PERIODS OF TIME
A literature review was conducted resulting in the discovery of over 75 articles, studies, rate cases and
reports from the US and abroad. Many of these referenced each other. Only the most recent or the
most detailed studies referenced were used.
The two primary questions investigated in this report are:
“What is the cost to a customer of a prolonged outage?” and
“What are the costs to utilities to prevent or shorten prolonged outages?”
Section 3 analyzes the cost to customers of prolonged outages. Section 4 identifies and values the costs
of mitigation measures to reduce the duration or prevent prolonged outages.
Two methods of estimating customer costs were investigated for this study:
1. Direct Worth which is covered in section 3.2.
2. Value of Lost Load or Willingness to Pay/Willingness to Accept concepts which are covered in
section 3.3.
“Weathering the Storm, Report of the Grid Resiliency Trask Force” was studied and analyzed first. The
study’s next step was the literature review.
In addition to the literature review, the telephone calls were made to the state public utility
commissions for which no reports had been found during the literature review process. These calls were
made to investigate the possible availability of any similar reports or rate cases. None were found during
this process.
After these processes were completed, the authors of two key primary reports were interviewed for
additional information and clarity. Specifically, the Consultants questioned:
Josh Schellenberg of Freeman, Sullivan & Co., who co-authored the 2009 Lawrence Berkeley
Laboratory Report titled “Estimated Value of Service Reliability for Electric Utility Customers in the
United States”, and
Julia Frayer of London Economics International LLC, who was the lead author of the 2013 Electric
Reliability Council of Texas report titled “Estimating the Value of Lost Load”.
Both assisted with understanding and using the complex multiple regression customer damage
functions, which were utilized to determine the costs of outages to customers under the Value of Lost
Load concept. Their contributions and assistance were greatly appreciated.
The literature review determined that the most accurate CDF was published by the Lawrence Berkeley
National Laboratory – "Estimated Value of Service Reliability for Electric Utility Customers in the United
13NARUC and MDPSC
A Cost-Benefit Analysis of Various Electric Reliability Improvement Projects
From the End Users' Perspective
States", Michael J. Sullivan, Ph.D., Matthew Mercurio, Ph.D., Josh Schellenberg, M.A, Freeman, Sullivan
& Co., June 2009.
Individual components of customers’ outage costs were researched and analyzed separately for
residential, commercial and industrial customers. The results and supporting analysis are explained in
section 3.2.
3.2 HARDSHIPS AND DIRECT COSTS OF BEING WITHOUT ELECTRICITY
This section provides information about the various hardships of being without electricity through
published and survey research.
3.2.1 Residential Customer Hardships and Direct Costs
An analysis of a list of costs was requested in the original request for proposals. Those costs are listed
next:
1. Ruined food,
2. Being without water (if on a well and septic system),
3. Operating a home generator,
4. Hotel room,
5. Relocating a home-based business,
6. Accommodations for the elderly and disabled, and
7. Road/transportation disruption.
During the research and review process other residential customer costs were found in the 2013 “ERCOT
Value of Lost Load Study”.4 These include the costs of:
1. Gas lanterns,
2. Gas stoves,
3. Backup battery supply for electronics,
4. Candles,
5. Ice,
6. Kerosene heaters, and
7. Lost wages.
The study includes estimates of all of these costs in this report.
The following section describes the causes of possible costs in a prolonged outage.
3.2.1.1 Ruined Food
Probably the most common cost for residential customers in a prolonged outage is that of ruined food.
According to the USDA:
4
“Estimating the Value of Lost Load”, London Economics International, LLC, 2013, p 12.
14NARUC and MDPSC
A Cost-Benefit Analysis of Various Electric Reliability Improvement Projects
From the End Users' Perspective
“The refrigerator will keep food safe for up to 4 hours. If the power is off longer, you can
transfer food to a cooler and fill with ice or frozen gel packs. Make sure there is enough ice to
keep food in the cooler at 40°F or below. Add more ice to the cooler as it begins to melt. A full
freezer will hold the temperature for approximately 48 hours (24 hours if it is half full). Obtain
dry ice or block ice if your power is going to be out for a prolonged period. Fifty pounds of dry
ice should hold an 18-cubic-foot freezer for 2 days.”5
Therefore, the study assumes a residential customer’s food spoils in 4 hours if there is no additional
refrigeration.
The research indicated the cost of ruined food can run anywhere from $72 to $450. According to a Con
Edison study filed with the New York PSC the average values of food spoilage in a refrigerator and
freezer for 12 or more hours ranged from $72 to $125. Con Edison refunds up to $450 for residential
food spoilage.6 Multiple sources stated that homeowner’s insurance typically covers up to $500 for
spoiled food.
3.2.1.2 Well Water/Septic Systems
The study indicated that some rural customers would experience costs due to inoperable electric pumps
for wells and septic systems. These costs include the purchase of drinking water. There is a possible cost
of repairing septic systems due to “…wastewater collecting in the septic tank, treatment unit or dosing
tank during the electrical outage. Components that will have to be treated and dispersed when electrical
service resumes possibly include:
Aerobic treatment units and recirculating media filters,
Pump chambers to leaching (soil absorption) trenches,
Sand filters,
Dosing or flow equalization tanks,
Low pressure distribution, and
Subsurface drip distribution.”7
The study includes an estimate of repair costs which might be incurred due to a loss of power to a septic
system (Figure 1).8 Average reported cost was $1,492, which is the cost estimate used in this report.
5
"Keep Your Food Safe During Emergencies: Power Outages, Floods & Fires", USDA
6
"GIS Verification of Perishable Refrigerator Contents in New York City", Julie McCormick and Larry Anderson, PhD
7
"Power Outages and Sewage Treatment Systems", OH Dept. of Health 2011
8
http://www.homeadvisor.com/cost/plumbing/repair-a-septic-tank/
15NARUC and MDPSC
A Cost-Benefit Analysis of Various Electric Reliability Improvement Projects
From the End Users' Perspective
Figure 1 Cost to Repair a Septic Tank in Maryland
3.2.1.3 Operating a Home Generator
Many residential customers investigate the possibility of installing permanent backup generation. Issues
to be considered include:
The cost of purchasing, operating and maintaining backup home generation,
The circuits that homeowners consider necessary to be powered,
The level of comfort desired during an outage,
Local noise and air pollution ordinances,
Building codes, and
Generator fuel type.
Local ordinances and regulations as well as building codes are considered outside the scope of the study.
The study estimates the costs of purchasing, operating and maintaining backup generation which are
further explained next.
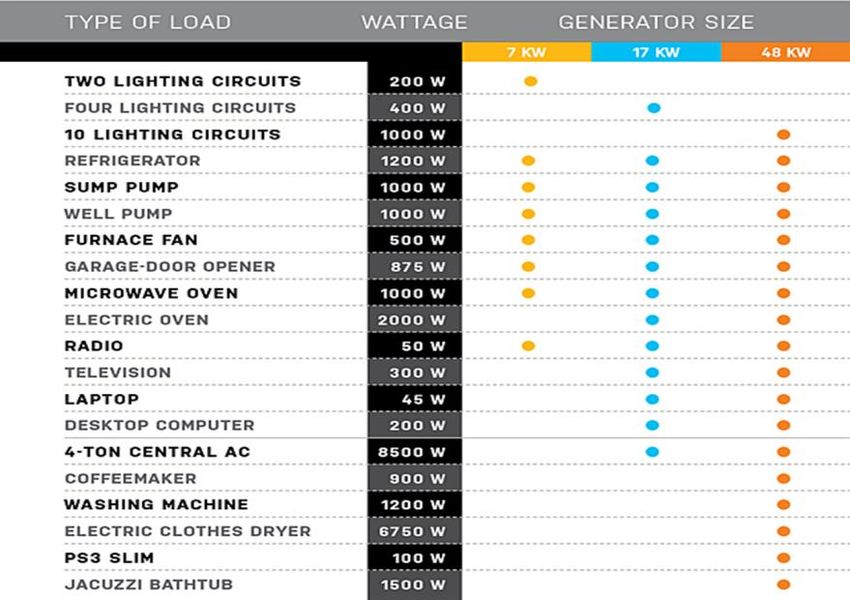
A recent article in Popular Mechanics succinctly covers the costs of installing backup residential
generation.9 The article explains three levels of needs and how these needs relate to the capacity of
generation a homeowner might install. These levels are categorized next and explained in detail in
Figure 2.
9
http://www.popularmechanics.com/home/improvement/electrical-plumbing/should-you-buy-a-
standby-generator-14880060-2
16NARUC and MDPSC
A Cost-Benefit Analysis of Various Electric Reliability Improvement Projects
From the End Users' Perspective
Figure 2 Loads/Circuits Relative to Home Backup Generator Capacity
The costs of purchasing, installing and operating home generation are contained in Table 1. Fuel is
assumed to be natural gas. Natural gas costs are based on natural gas delivery charges (Appendix Error!
eference source not found.) and market rates for a fixed 12 month contract (Figure 3) in the BGE service
territory for August 2013. Costs do not include capacity expenses (i.e., ROI if any, depreciation, etc.)
Table 1 Cost of Different Sizes of Home Backup Generation
Description Size Installed Cost Operating Cost (incl. fuel)
Essential Circuits - About the size of a large
trash can, it can energize up to 16 critical loads, 7 kW to 12 kW $4,000 to $8,000 $1.62/hour
though not all at once.
Creature Comforts - Midsize generators often
have load-shedding devices that shut down
12 kW to 20 kW $4,000 to $14,000 $3.47/hour
nonessential appliances when powering up
high-priority circuits.
Whole House - Comparable to a mini power
station crammed into a 2-ton dumpster, a high-
20 kW to 48 kW $8,000 to $20,000 $9.26/hour
capacity, liquid-cooled generator can energize
an entire home.
17NARUC and MDPSC
A Cost-Benefit Analysis of Various Electric Reliability Improvement Projects
From the End Users' Perspective
Figure 3 August 2013 Utility Supplier Prices – BGE12 Month Fixed Price Residential Contract (Source:
http://www.opc.state.md.us/opc/ConsumerCorner/Publications.aspx#Gas)
Estimated costs of three different sizes of natural gas fired back up generation are presented in Table 2.
Table 2 Daily Cost of Operating Backup Generation
Natural Gas Natural Gas Natural Gas
Outage Length Operating Costs Operating Costs Operating Costs
(7 kW) (17 kW) (48 kW)
1 Day $ 38.88 $ 83.32 $ 222.19
2 Days $ 77.77 $ 166.64 $ 444.39
3 Days $ 116.65 $ 249.97 $ 666.58
4 Days $ 155.54 $ 333.29 $ 888.77
1 Week $ 272.19 $ 583.26 $ 1,555.35
Per hour $ 1.62 $ 3.47 $ 9.26
Does not include capacity costs (i.e., ROI if any, depreciation, etc.)
August 2013 Natural Gas Suppliers Chart
BGE Rate D Residential Delivery Charges
3.2.1.4 Hotel Room(s)
In cases of prolonged outages or due to damage to the home, customers may choose to relocate to a
hotel. The study considers only the cost of nightly hotel stays, due to power outages, not due to damage
from weather. These costs were estimated at $100/night for a family of four.
3.2.1.5 Relocating a Home-based Business
Many people work out of their homes. Home-based work requires a work-space, telecommunications,
internet connection, filing and storage space and climate control. The research indicates that for the first
few days of an outage, customers may not require a new workplace. In this case, customers would be
focused on other matters such as home repairs, food, etc. Additionally, workers might be able to
18NARUC and MDPSC
A Cost-Benefit Analysis of Various Electric Reliability Improvement Projects
From the End Users' Perspective
temporarily relocate to a hotel, or coffee shop to work part-time. The study then envisions that a
customer would return to work full-time after 5 days. Therefore the largest expense – finding and paying
for a workspace would not be necessary until a work week has passed. Due to the unpredictability of the
timing of a home office recovery, the study calculates workspace cost on a weekly basis.
A recent query of The Baltimore Sun’s advertising section indicated a cost of shared office spaces was
about $499/month. If a worker can rent space for a week at a time, then the cost would be about $116
($499 ÷ 4.3 weeks in a month).
3.2.1.6 Accommodations for the Elderly and Disabled
The study uses the cost of a hotel room as a proxy for the cost of relocating the elderly from residences
or from assisted living. Therefore, the study estimates this cost at $100/night. Elderly and disabled can
self-identify to the utility companies in Maryland so that emergency managers can ensure their well-
being during extended outages if they are medically vulnerable. See section 3.12 below for more details
about this program’s use in extended outage planning as part of mitigating measures.
3.2.1.7 Road/Transportation Disruption
Customers who live in areas where travel becomes difficult or impossible due to downed power lines or
inoperative traffic lights may be delayed in travel or find it necessary to detour around troubled areas.
According to the Texas Transportation Institute at Texas A&M University, traffic delays cost motorists
$22 per hour delayed. If motorists must take a detour, a good proxy is the US Internal Revenue Service
mileage allowance, which is $0.565/mile for 2013. These can be used as accurate costs of transportation
disruptions for residential customers.
3.2.1.8 Lost Wages
For workers who are paid hourly, lost wages become a very substantial cost. Other salaried workers may
also face the loss of income. The study reviewed Maryland median wages for service workers, which are
higher than the national median wage. The median wage in Maryland is $35 per hour. Maryland’s
median service worker’s wage is approximately $24 per hour. 10 Service workers are more likely to be
paid on an hourly basis rather than an annual salary. As such they are more vulnerable to lost wages as a
result of extended power outages.
3.2.1.9 Other Costs:
These are primarily costs necessary to maintain basic comfort and necessity levels in a residence. They
include:
1. Gas lanterns – electric battery operated lanterns typically last 10 hours or so. Therefore, the
study assumes the cost of gas lanterns since they can be more readily fueled during a prolonged
power outage.
2. Gas stoves – the study assumes cooking using portable gas stoves rather than over a wood
burning fireplace or back yard grill.
10
http://www.choosemaryland.org/factsstats/pages/wages.aspx
19NARUC and MDPSC
A Cost-Benefit Analysis of Various Electric Reliability Improvement Projects
From the End Users' Perspective
3. Backup battery supply for electronics – electronics will be able to be operated long enough to be
shut down properly to avoid damage and loss of data.
4. Candles – for lighting.
5. Ice – used for maintaining food in freezers or refrigerators or for ice chests to store food
transferred from freezers or refrigerators.
6. Kerosene heaters – for cold weather comfort. This also serves as a proxy cost for wood or
natural gas burning fireplaces.
Calculations of these costs are presented in Table 3.
Table 3 Other costs for residential customers
Purchase Price
Type of Cost Metric/Rate Low High Daily Cost
$10 per gallon, 2 pints per tank for 7 hours,
Gas Lantern $ 100 $ 100 $ 5
therefore 4 pints for 14 hours
2 pints of fuel cooks for 2 hours, 2 hours of
Gas Stove purchase $ 130 $ 130 $ 2.50
cooking per day, $2.50 per day
Backup battery supply for electronics $40 per 30 minutes, 30 minutes per day $ 40
Candles 5 hours of candle use per night $ 5
Ice $2 per 8 hours $ 6
10,000 BTU heater heats 1,000 square feet for
Kerosene Heater 15 hours on 1.2 gallons of kerosene, 2 gallons $ 100 $ 100 $ 6
to heat 1 day, $3 per gallon
3.2.1.10 Detailed Summary of Residential Customer’s Direct Costs Due to Prolonged Outages
This section summarizes in tabular form the cost data discussed and explained in the previous sections.
20Table 4 contains a detailed summary of all direct residential customer costs. The study calculates weekend and weekday costs separately. The
original request asked for a calculation of one to four days and for one week. Since these periods may include a mix of weekend and/or
weekday costs, the table includes costs on a daily basis for one full week. Examples of differing combinations of four day period are included in
the last three columns. The costs in this table are not cumulative.
Table 4 Detailed List of Residential Direct Costs for Prolonged Outages
RESIDENTIAL CUSTOMER COSTS
One time costs Weekend Weekdays 4 Day Period
2 Weekend/ 1 Weekend/
Type of Cost Metric/Rate Low High Saturday Sunday Monday Tuesday Wednesday Thursday Friday 1 week 2 Weekdays 3 Weekdays 4 Weekdays
After 8 hours without refrigeration,
food is assumed spoiled. Con Edison
1 Ruined food $ 72 $ 450
refunds up to $450 for residential
customers, reports $72 to be average.
$1.50 per gallon, 50 gallons per day for
2 Being without water (if on a well and septic system) a family of 4 (2 for drinking water, 4 $ 75 $ 75 $ 75 $ 75 $ 75 $ 75 $ 75 $ 525 $ 300 $ 300 $ 300
per toilet flush, 3 flushes per person)
3 Damage to septic tank Cost of repair $ - $ 1,492
4 Operating a home generator:
7 kW Essential Circuits $1.62/hour to generate $ 4,000 $ 8,000 $ 39 $ 39 $ 39 $ 39 $ 39 $ 39 $ 39 $ 272 $ 156 $ 156 $ 156
17 kW Creature Comforts $3.47/hour to generate $ 4,000 $ 14,000 $ 83 $ 83 $ 83 $ 83 $ 83 $ 83 $ 83 $ 583 $ 333 $ 333 $ 333
48 kW Whole House $9.26/hour to generate $ 8,000 $ 20,000 $ 222 $ 222 $ 222 $ 222 $ 222 $ 222 $ 222 $ 1,555 $ 889 $ 889 $ 889
5 Hotel room $100 for a family of four. $ 100 $ 100 $ 100 $ 100 $ 100 $ 100 $ 100 $ 700 $ 400 $ 400 $ 400
Office shared space per Baltimore Sun
6 Relocating a home-based business cost $499/month, therefore 1 week is $ 116 $ 116 $ 116 $ - $ - $ -
$116.
7 Accommodations for the elderly and disabled $100 for hotel room for one person. $ 100 $ 100 $ 100 $ 100 $ 100 $ 100 $ 100 $ 700 $ 400 $ 400 $ 400
8 Road/transportation disruption
Detour Costs $0.565 per mile per IRS reimbursement rates
Delay Costs $22/hr. delayed
9 Other (determined over the course of the study):
$10 per gallon, 2 pints per tank for 7
Gas Lantern $ 100 $ 100 $ 5 $ 5 $ 5 $ 5 $ 5 $ 5 $ 5 $ 35 $ 20 $ 20 $ 20
hours, therefore 4 pints for 14 hours
2 pints of fuel cooks for 2 hours, 2
Gas Stove purchase $ 130 $ 130 $ 2.50 $ 2.50 $ 2.50 $ 2.50 $ 2.50 $ 2.50 $ 2.50 $ 18 $ 10 $ 10 $ 10
hours of cooking per day, $2.50 per day
Backup battery supply for electronics $40 per 30 minutes, 30 minutes per day $ 40 $ 40 $ 40 $ 40 $ 40 $ 40 $ 40 $ 280 $ 160 $ 160 $ 160
Candles 5 hours of candle use per night $ 5 $ 5 $ 5 $ 5 $ 5 $ 5 $ 5 $ 35 $ 20 $ 20 $ 20
Ice $2 per 8 hours $ 6 $ 6 $ 6 $ 6 $ 6 $ 6 $ 6 $ 42 $ 24 $ 24 $ 24
10,000 BTU heater heats 1,000 square
feet for 15 hours on 1.2 gallons of
Kerosene Heater $ 100 $ 100 $ 6 $ 6 $ 6 $ 6 $ 6 $ 6 $ 6 $ 42 $ 24 $ 24 $ 24
kerosene, 2 gallons to heat 1 day, $3
per gallon
10 Lost Wages Ave MD wage $35/hour for 8 hour shift $ 280 $ 280 $ 280 $ 280 $ 280 $ 280 $ 280 $ 1,960 $ 1,120 $ 1,120 $ 1,120Table 5 and Table 6 illustrate how to use the data. Many of the costs are not cumulative. For example, a customer with backup generation may
not need candles, lanterns or stoves. White sections indicate costs included in total costs. Shaded sections indicate costs not included.
Sample 1 illustrates the cost of outage to a customer with:
With a well that works and is not damaged, Who does not get a hotel,
With a 17 kW generator, Has an hourly job and works every day, and
Who is not disabled, Does not have home office.NARUC and MDPSC
A Cost-Benefit Analysis of Various Electric Reliability Improvement Projects
From the End Users' Perspective
Table 5 Sample 1 of How to Use the Data for Residential Customers
SAMPLE 1: Cost of outage to customer with well that works and is not damaged, with a 17 kW generator, not disabled, who does not get a hotel, hourly job and works every day, does not have home office
RESIDENTIAL CUSTOMER COSTS
One time costs regardless of outage
duration Weekend Weekdays 4 Day Period
2 Weekend/ 1 Weekend/
Type of Cost Metric/Rate Low High Saturday Sunday Monday Tuesday Wednesday Thursday Friday 1 week 2 Weekdays 3 Weekdays 4 Weekdays
After 8 hours without refrigeration, food
1 Ruined food $ 72 $ 450
is assumed spoiled
$1.50 per gallon, 50 gallons per day for a
2 Being without water (if on a well and septic system) family of 4 (2 for drinking water, 4 per $ 75 $ 75 $ 75 $ 75 $ 75 $ 75 $ 75 $ 525 $ 300 $ 300 $ 300
toilet flush, 3 flushes per person)
3 Damage to septic tank Cost of repair $ - $ 1,492
4 Operating a home generator:
7 kW Essential Circuits $1.62/hour to generate $ 4,000 $ 8,000 $ 39 $ 39 $ 39 $ 39 $ 39 $ 39 $ 39 $ 272 $ 156 $ 156 $ 156
17 kW Creature Comforts $3.47/hour to generate $ 4,000 $ 14,000 $ 83 $ 83 $ 83 $ 83 $ 83 $ 83 $ 83 $ 583 $ 333 $ 333 $ 333
48 kW Whole House $9.26/hour to generate $ 8,000 $ 20,000 $ 222 $ 222 $ 222 $ 222 $ 222 $ 222 $ 222 $ 1,555 $ 889 $ 889 $ 889
5 Hotel room $100 for a family of four. $ 100 $ 100 $ 100 $ 100 $ 100 $ 100 $ 100 $ 700 $ 400 $ 400 $ 400
Office shared space per Baltimore Sun
6 Relocating a home-based business $ 116 $ 116 $ - $ - $ - $ - $ - $ - $ - $ - $ - $ - $ -
cost $499/month, therefore assumed
7 Accommodations for the elderly and disabled $ 100 $ 100 $ 100 $ 100 $ 100 $ 100 $ 100 $ 700 $ 400 $ 400 $ 400
8 Road/transportation disruption $ - $ - $ - $ - $ - $ - $ - $ - $ - $ - $ -
Detour Costs $0.565 per mile per IRS reimbursement rates
Delay Costs $22/hr. delayed
9 Other (determined over the course of the study):
$10 per gallon, 2 pints per tank for 7
Gas Lantern $ 100 $ 100 $ 5 $ 5 $ 5 $ 5 $ 5 $ 5 $ 5 $ 35 $ 20 $ 20 $ 20
hours, 1 gallon for 14 hours
2 pints of fuel cooks for 2 hours, 2 hours
Gas Stove purchase $ 130 $ 130 $ 2.50 $ 2.50 $ 2.50 $ 2.50 $ 2.50 $ 2.50 $ 2.50 $ 18 $ 10 $ 10 $ 10
of cooking per day, $5 per day
Backup battery supply for electronics $40 per 30 minutes, 30 minutes per day $ 40 $ 40 $ 40 $ 40 $ 40 $ 40 $ 40 $ 280 $ 160 $ 160 $ 160
Candles 5 hours of candle use per night $ 5 $ 5 $ 5 $ 5 $ 5 $ 5 $ 5 $ 35 $ 20 $ 20 $ 20
Ice $2 per 8 hours $ 6 $ 6 $ 6 $ 6 $ 6 $ 6 $ 6 $ 42 $ 24 $ 24 $ 24
10,000 BTU heater heats 1,000 square
feet for 15 hours on 1.2 gallons of
Kerosene Heater $ 100 $ 100 $ 6 $ 6 $ 6 $ 6 $ 6 $ 6 $ 6 $ 42 $ 24 $ 24 $ 24
kerosene, 2 gallons to heat 1 day, $3 per
gallon
10 Lost Wages Ave MD wage $35/hour for 8 hour shift $ 280 $ 280 $ 280 $ 280 $ 280 $ 280 $ 280 $ 1,960 $ 1,120 $ 1,120 $ 1,120
TOTAL $ 4,000 $ 14,000 $ 363 $ 363 $ 363 $ 363 $ 363 $ 363 $ 363 $ 2,543 $ 1,453 $ 1,453 $ 1,453
23Sample 2 illustrates the cost of outage to customer:
Who has 10 miles of detours on a daily basis, Not elderly/disabled,
Who has a road delay of ½ hour on a daily basis, Who does not get a hotel,
With no well or septic tank, Does not lose wages, and
No generator, Has no home office.
Table 6 Sample 2 of How to Use the Data for Residential Customers
SAMPLE 2: Cost of outage to customer with no well, no generator, has road disruption, not elderly/disabled, who does not get a hotel, does not lose wages, no home office
RESIDENTIAL CUSTOMER COSTS
One time costs regardless of outage
duration Weekend Weekdays 4 Day Period
2 Weekend/ 1 Weekend/
Type of Cost Metric/Rate Low High Saturday Sunday Monday Tuesday Wednesday Thursday Friday 1 week 2 Weekdays 3 Weekdays 4 Weekdays
After 8 hours without refrigeration,
1 Ruined food $ 72 $ 450
food is assumed spoiled
$1.50 per gallon, 50 gallons per day for a
2 Being without water (if on a well and septic system) family of 4 (2 for drinking water, 4 per $ 75 $ 75 $ 75 $ 75 $ 75 $ 75 $ 75 $ 525 $ 300 $ 300 $ 300
toilet flush, 3 flushes per person)
3 Damage to septic tank Cost of repair $ - $ 1,492
4 Operating a home generator:
7 kW Essential Circuits $1.62/hour to generate $ 4,000 $ 8,000 $ 39 $ 39 $ 39 $ 39 $ 39 $ 39 $ 39 $ 272 $ 156 $ 156 $ 156
17 kW Creature Comforts $3.47/hour to generate $ 4,000 $ 14,000 $ 83 $ 83 $ 83 $ 83 $ 83 $ 83 $ 83 $ 583 $ 333 $ 333 $ 333
48 kW Whole House $9.26/hour to generate $ 8,000 $ 20,000 $ 222 $ 222 $ 222 $ 222 $ 222 $ 222 $ 222 $ 1,555 $ 889 $ 889 $ 889
5 Hotel room $100 for a family of four. $ 100 $ 100 $ 100 $ 100 $ 100 $ 100 $ 100 $ 700 $ 400 $ 400 $ 400
Office shared space per Baltimore Sun
6 Relocating a home-based business $ 116 $ 116 $ - $ - $ - $ - $ - $ - $ - $ - $ - $ - $ -
cost $499/month, therefore assumed
7 Accommodations for the elderly and disabled $ 100 $ 100 $ 100 $ 100 $ 100 $ 100 $ 100 $ 700 $ 400 $ 400 $ 400
8 Road/transportation disruption
Detour Costs (10 mile detour 1 time per day) $0.565 per mile per IRS reimbursement rates $ 6 $ 6 $ 6 $ 6 $ 6 $ 6 $ 6 $ 39 $ 22 $ 22 $ 22
Delay Costs (1/2 hour delay 1 time per day) $22/hr. delayed $ 11 $ 11 $ 11 $ 11 $ 11 $ 11 $ 11 $ 77 $ 44 $ 44 $ 44
9 Other (determined over the course of the study):
$10 per gallon, 2 pints per tank for 7
Gas Lantern $ 100 $ 100 $ 5 $ 5 $ 5 $ 5 $ 5 $ 5 $ 5 $ 35 $ 20 $ 20 $ 20
hours, 1 gallon for 14 hours
2 pints of fuel cooks for 2 hours, 2 hours
Gas Stove purchase $ 130 $ 130 $ 2.50 $ 2.50 $ 2.50 $ 2.50 $ 2.50 $ 2.50 $ 2.50 $ 18 $ 10 $ 10 $ 10
of cooking per day, $5 per day
Backup battery supply for electronics $40 per 30 minutes, 30 minutes per day $ 40 $ 40 $ 40 $ 40 $ 40 $ 40 $ 40 $ 280 $ 160 $ 160 $ 160
Candles 5 hours of candle use per night $ 5 $ 5 $ 5 $ 5 $ 5 $ 5 $ 5 $ 35 $ 20 $ 20 $ 20
Ice $2 per 8 hours $ 6 $ 6 $ 6 $ 6 $ 6 $ 6 $ 6 $ 42 $ 24 $ 24 $ 24
10,000 BTU heater heats 1,000 square
feet for 15 hours on 1.2 gallons of
Kerosene Heater $ 100 $ 100 $ 6 $ 6 $ 6 $ 6 $ 6 $ 6 $ 6 $ 42 $ 24 $ 24 $ 24
kerosene, 2 gallons to heat 1 day, $3 per
gallon
10 Lost Wages Ave MD wage $35/hour for 8 hour shift $ 280 $ 280 $ 280 $ 280 $ 280 $ 280 $ 280 $ 1,960 $ 1,120 $ 1,120 $ 1,120
TOTAL $ 402 $ 780 $ 81 $ 81 $ 81 $ 81 $ 81 $ 81 $ 81 $ 567 $ 324 $ 324 $ 3243.2.1.11 Further Information Which Supports the Residential Cost Analysis In October 2010, the Montgomery County Maryland Executive commissioned a Work Group of county residents and charged them with the mission of investigating “…causes for Pepco’s frequent electricity outages…” and “…proposing corrective steps, as appropriate.” The Work Group’s “Final Report to the Montgomery County Maryland Executive” published April 20, 2011 contained the results of online surveys of residential and commercial customers. While the survey’s results may not be scientific due to survey limitations (respondents were self-selected as opposed to randomly selected and may have responded more than once), they are presented here for purposes of comparison with the Study’s findings. According to that report, “The median range of costs to residential customers reporting costs associated with outages [of 5 hours or more] was $100-500, with 51.9 percent of those who experienced losses reporting this range for the magnitude of losses.”11 Table 7 summarizes these results. These figures are similar in nature to the results of direct cost approach of $363 per day as shown in Table 5. Table 7 Summary of 2011 Montgomery County PEPCO Work Group Survey Results In 2012 a survey by Bates White Economic Consulting12 asked customers to list the “hassles” of outages that were most important to them in either short or prolonged outages. The survey showed that 75 – 80% of respondents listed “lost heat/air conditioning” and “spoiled food” as the “biggest hassles” customers face in a prolonged outage (Figure 4). Over half of respondents listed losing and/or resetting electronic devices as problematic followed closely by losing lighting. Note that the shorter the outage the more problematic the loss of electronics becomes. Perhaps this is because short outages are more common, thus the loss of electronics is less acceptable. In other words, problems are expected for a long duration outage and perhaps more frustrating for short term outages. Figure 4 List of “Hassles” faced by residential customers (Bates White Economic Consulting, 2012) Final Report to the Montgomery County Maryland Executive, Pepco Work Group, April 20, 2011. 11 “Willingness to Pay to Avoid Outages: Reliability Demand Survey”, Kathleen King, PhD, Principal, Bates White Economic 12 Consulting, Washington, DC, June 2012, pp. 8-9.
NARUC and MDPSC
        A Cost-Benefit Analysis of Various Electric Reliability Improvement Projects
                             From the End Users' Perspective

“When asked to pick the single greatest problem, as shown in Figure 5, losing heat or air conditioning
and losing food were the two biggest problems. Having to move out (for multi-day outages) and ‘other’
were the next two categories named. Compared to these problems, the other categories were cited by
fewer respondents.”13

Research indicated that there is no direct cost of resetting electronics nor is there a direct cost of losing
heat/air conditioning. The main cost of losing electronics is the loss of productivity for home based
businesses or work at home professionals. Therefore, the cost of loss electronics is reflected in the lost
productivity figures.

The cost of losing air conditioning may be reflected in the need to move into a hotel. It may also be
reflected in the cost of installing and running backup generation. Each of these is reflected in the cost
figures in the previous cost analysis tables.

Figure 5 “Biggest Hassles” of Outages (Bates White Economic Consulting, 2012)

13
     Ibid

                                                     26
NARUC and MDPSC
A Cost-Benefit Analysis of Various Electric Reliability Improvement Projects
From the End Users' Perspective
3.2.2 Commercial Customer Hardships and Direct Costs
This section examines the direct costs for the commercial customer. Research indicated that costs
include, but are not limited to:
1. Ruined food for a food service, entertainment or accommodation business
2. Being without water (if on a well and septic system for a small or rural business)
3. Operating a backup generator or micro grid
4. Relocating a home-based business employees
5. Reduction in lost productivity, wages, and revenue to businesses
6. Other costs such as those related to:
a. Equipment Damage
b. Other Restart Costs
c. Misc.
d. Backup battery supply for electronics for up to 30 minutes
There are many different types and sizes of commercial customers. This category ranges from large
office buildings down to a mom and pop convenience store. In order for the reader to understand the
variety and diversity of commercial customers, some facts are listed in the following tables. These tables
indicate challenges faced when attempting to calculate a single direct cost of prolonged outages for the
commercial customer segment.
Table 8 illustrates the impact of various types of commercial and industrial firms on Maryland’s GDP.
Maryland has a diverse economy with many different types of firms. Maryland ranks 15th in GDP among
American states.
27NARUC and MDPSC
A Cost-Benefit Analysis of Various Electric Reliability Improvement Projects
From the End Users' Perspective
Table 8 Maryland Commercial and Industrial GDP (http://choosemaryland.org/factsstats/Pages/GrossDomesticProduct.aspx)
Maryland Gross Domestic Product
2011 GDP Percent
Industry
($M) Of Total
Total (Public and Private) 301,100 100.00%
Private 245,383 81.50%
Agriculture, Forestry, Fishing 737 0.20%
Mining 184 0.10%
Utilities 6,459 2.10%
Construction 13,656 4.50%
Manufacturing 19,481 6.50%
Durable Goods 9,336 3.10%
Nondurable Goods 10,145 3.40%
Wholesale Trade 13,636 4.50%
Retail Trade 16,841 5.60%
Transportation and Warehousing 5,905 2.00%
Information 11,489 3.80%
Finance and Insurance 18,269 6.10%
Real Estate 44,663 14.80%
Prof. and Technical Services 34,121 11.30%
Management of Companies 3,163 1.10%
Administrative & Waste Services 9,208 3.10%
Educational Services 4,344 1.40%
Health Care and Social Assistance 24,480 8.10%
Arts, Entertainment & Recreation 2,387 0.80%
Accommodation & Food Services 8,404 2.80%
Other Services 7,955 2.60%
Government 55,716 18.50%
Federal Civilian N/A N/A
Federal Military N/A N/A
State and Local N/A N/A
The varying sizes of customers in terms of employees are presented in Table 9. Employees are about
evenly split between firms employing 500 or more and those employing 500 or less people.
28You can also read