FROM GAS TO GRID BUILDING CHARGING INFRASTRUCTURE TO POWER ELECTRIC VEHICLE DEMAND - Rocky Mountain Institute
←
→
Page content transcription
If your browser does not render page correctly, please read the page content below
MOUN             RBON
      KY                CA

             TA
ROC

               IN
  IN                W
       STIT UTE         AR
                             ROO
                                   M

FROM GAS TO GRID
BUILDING CHARGING INFRASTRUCTURE TO POWER ELECTRIC VEHICLE DEMAND
BY GARRETT FITZGERALD, CHRIS NELDER

                                                        MOUN
                                                     KY
                                                            TA
                                               ROC

                                                              IN

                                                 IN
                                                      STIT UTE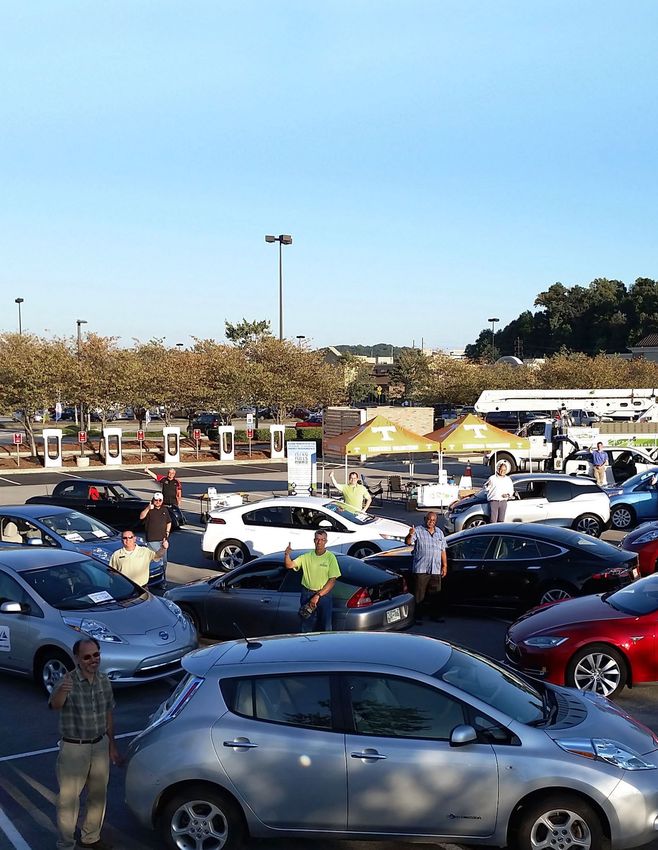
AUTHORS & ACKNOWLEDGMENTS
                  AUTHORS                                                   THANK YOU
                  Garrett Fitzgerald and Chris Nelder                       This work was made possible by a generous grant
                                                                            from the Rudy & Alice Ramsey Foundation. We are
                  * Authors listed alphabetically. All authors from         grateful for their support.
                  Rocky Mountain Institute unless otherwise noted.

                                                                            ACKNOWLEDGMENTS
                  CONTACTS                                                  The authors thank the following individuals for offering
                  Chris Nelder (cnelder@rmi.org)                            their insights and perspectives on this work, which
                  Garrett Fitzgerald (gfitzgerald@rmi.org)                  does not necessarily reflect their views.

                                                                            Paul J. Allen, M.J. Bradley & Associates
                  SUGGESTED CITATION                                        Ake Almgren, Orkas
                  Fitzgerald, Garrett and Chris Nelder. From Gas to Grid:   Bill Boyce, Sacramento Municipal Utility District
                  Building Charging Infrastructure to Power Electric        Noel Crisostomo, California Energy Commission
                  Vehicle Demand. Rocky Mountain Institute, 2017.           Claire Dooley, Greenlots
                  https://www.rmi.org/insights/reports/from_gas_to_grid     Mark Dyson, Rocky Mountain Institute
                                                                            Dave Farnsworth, Regulatory Assistance Project
                  EDITORIAL/DESIGN                                          Matthew Goetz, Georgetown Climate Center
                  Editorial Director: Cindie Baker                          Robert Graham, Department of Energy
                  Editor: David Labrador                                    Leia Guccione, Rocky Mountain Institute
                  Creative Director: Romy Purshouse                         Tim Kreukniet, EV Box
                  Design: Marijke Jongbloed                                 Jeffery Greenblatt, Lawrence Berkeley National
                                                                            Laboratory
                  Images courtesy of iStock unless otherwise noted.         Nick Nigro, Atlas Public Policy
                  Cover image courtesy of Jonathan Overly and the           James Newcomb, Rocky Mountain Institute
                  East Tennessee Clean Fuels Coalition                      Peter O’Connor, Union of Concerned Scientists
                                                                            Terry O’Day, EVgo
                                                                            Jason Ortego, California Public Utilities Commission
                                                                            Lang Reynolds, Duke Energy
                                                                            Rich Sedano, Regulatory Assistance Project
                                                                            Matt Stanberry, Advanced Energy Economy
                                                                            Tom Vosburg, City of Fort Collins
                                                                            Eric van Orden, Xcel Energy
                                                                            Jonathan Walker, Rocky Mountain Institute

         MOUN
      KY
             TA
ROC

               IN

                                                                                                                    FROM GAS TO GRID | 2
  IN
       STIT UTE
ABOUT US

            MOUN
         KY
                    TA
 ROC

                      IN

       IN
            STIT UTE

ABOUT ROCKY MOUNTAIN INSTITUTE
Rocky Mountain Institute (RMI)—an independent nonprofit founded in 1982—transforms global energy use to create a
clean, prosperous, and secure low-carbon future. It engages businesses, communities, institutions, and entrepreneurs
to accelerate the adoption of market-based solutions that cost-effectively shift from fossil fuels to efficiency and
renewables. RMI has offices in Basalt and Boulder, Colorado; New York City; Washington, D.C.; and Beijing.

         MOUN
      KY
             TA
ROC

               IN

  IN
       STIT UTE

ABOUT MOBILITY TRANSFORMATION
Rocky Mountain Institute’s Mobility Transformation program brings together public and private stakeholders to
codevelop and implement shared, electrified, and eventually autonomous mobility solutions in cities designed for
them. Working with U.S. cities, it leverages emerging technologies and new business models to reduce congestion,
decrease costs, increase convenience, enhance safety, curb emissions, and ensure economic growth. Please visit
http://www.rmi.org/mobility for more information.

                                                                                                     FROM GAS TO GRID | 3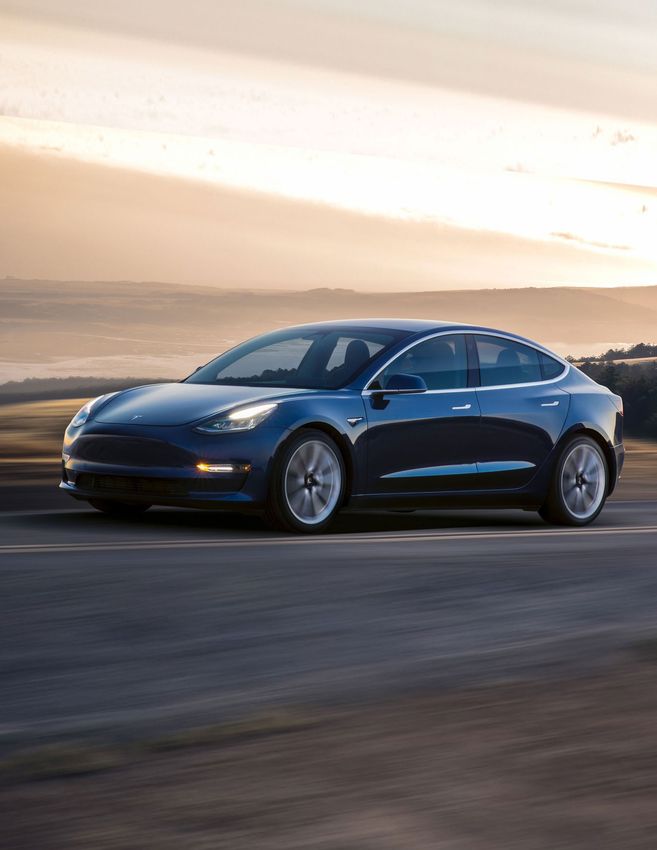
CONTENTS
                  Executive Summary...........................................................................................................06
                  The EV Revolution Is Here............................................................................................... 14
                        Accelerating the EV Revolution: Shared Mobility and Vehicle Autonomy................................................................... 19
                        And the Self-Driving Phase of the Revolution Is En Route................................................................................................20

                  The Economics of EVs and Grid Integration............................................................22
                  Get Ready.............................................................................................................................26
                        Barriers to Deploying Infrastructure.......................................................................................................................................... 27
                    The Cost of Installing Chargers Is Too High.................................................................................................................... 27
                    Regulators Aren’t Convinced the Investment Is Worthwhile.....................................................................................28
                    Utilities Aren’t Accustomed to Charging-Infrastructure Investment........................................................................29
                    Costs Are Unevenly Distributed..........................................................................................................................................30
                    Investment Is Inequitable......................................................................................................................................................... 31
                    The Charging Station Network Is Balkanized................................................................................................................. 32
                   Charger Deployment Considerations and Best Practices................................................................................................ 33
                    DCFC Are Very Different from Level 1 and Level 2 Chargers................................................................................... 33
                    Siting Considerations................................................................................................................................................................37
                    A No-Regrets Path to SAEV................................................................................................................................................... 38
                    Ownership.................................................................................................................................................................................... 39
                    Penetration.....................................................................................................................................................................................41
                    Tariffs.............................................................................................................................................................................................. 42
                   Different Strokes............................................................................................................................................................................... 46
                    California........................................................................................................................................................................................ 51
                    Colorado....................................................................................................................................................................................... 54
                    Ohio................................................................................................................................................................................................56
                    Texas..............................................................................................................................................................................................59
                    Hawaii............................................................................................................................................................................................62
                  Let’s Get Moving.................................................................................................................66
                  Glossary.................................................................................................................................69
                  Appendix: Analysis Methodologies...............................................................................71
                        Fleet Total Cost of Ownership..................................................................................................................................................... 72
                        Cost of Charging by Charger Type.............................................................................................................................................73
                        Cost of Charging for Public DCFC Site Hosts.........................................................................................................................74
                        Summary of Costs and Benefits From Literature...................................................................................................................77

                  Endnotes............................................................................................................................... 79

         MOUN
      KY
             TA
ROC

               IN

                                                                                                                                                                                                FROM GAS TO GRID | 4
  IN
       STIT UTE
TABLE OF TABLES
                    Table 1 EV and EVSE deployment statistics by state........................................................................................................... 12
                    Table 2 Types of chargers............................................................................................................................................................ 33
                    Table 3 EV and EVSE deployment statistics by state..........................................................................................................47
                    Table 4 Fleet total cost of ownership assumptions............................................................................................................. 72
                    Table 5 Electric vehicle charging assumptions......................................................................................................................73
                    Table 6 Utility tariff summary.........................................................................................................................................................74
                    Table 7 Tabulated EV stakeholder benefits from the literature....................................................................................... 78

                  TABLE OF FIGURES
                    Figure 1 Retail cost to EV owner, or employer of EV owner, to charge one mile of EV range under
                    different utility tariffs and DCFC programs..............................................................................................................................08
                    Figure 2 Range of stakeholder benefits for EVs from the literature..............................................................................09
                    Figure 3 Electricity cost for host site to deliver one mile of charge via DCFC.............................................................11
                    Figure 4 Sample of EV models available through 2020.................................................................................................... 15
                    Figure 5 BNEF forecast for the combined cost of lithium-ion battery cells and packs........................................... 16
                    Figure 6 BNEF EV sales forecast through 2025................................................................................................................... 18
                    Figure 7 Five-year total cost of ownership net present value for a fleet of 30 vehicles in Colorado,
                    ICE vs. EV............................................................................................................................................................................................. 19
                    Figure 8 Projected light-duty vehicle demand......................................................................................................................20
                    Figure 9 Range of stakeholder benefits for EVs from the literature.............................................................................. 23
                    Figure 10 Relative public-charger distribution by charger type....................................................................................... 46
                    Figure 11 Retail cost to EV owner, or employer of owner, to charge one mile of EV range under different
                    utility tariffs and DCFC programs................................................................................................................................................ 48
                    Figure 12 Monthly host-site utility bill for DCFC operation (two 50 kW ports each)................................................. 49
                    Figure 13 Electricity cost range for host site to deliver one mile of charge via DCFC............................................50
                    Figure 14 EV charging costs in California on the Southern California Edison grid...................................................52
                    Figure 15 Utility bill for a representative DCFC in California on the SCE grid............................................................ 53
                    Figure 16 EV charging costs in Colorado on the Xcel Energy grid................................................................................55
                    Figure 17 Utility bill for a representative DCFC in Colorado on the Xcel Energy grid.............................................56
                    Figure 18 EV charging costs in Ohio on the AEP grid.........................................................................................................58
                    Figure 19 Utility bill for a representative DCFC in Ohio on the AEP grid.....................................................................59
                    Figure 20 EV charging costs in Texas on the Austin Energy grid................................................................................... 61
                    Figure 21 Utility bill for a representative DCFC in Texas on the Austin Energy grid................................................62
                    Figure 22 EV charging costs in Hawaii on the Hawaiian Electric grid.......................................................................... 64
                    Figure 23 Utility bill for a representative DCFC in Hawaii on the Hawaiian Electric grid......................................65
                    Figure 24 Corridor DCFC utilization profile............................................................................................................................ 75
                    Figure 25 Urban DCFC utilization profile................................................................................................................................ 76
                    Figure 26: Detail of EV benefits from the literature..............................................................................................................77

         MOUN
      KY
             TA
ROC

               IN

                                                                                                                                                                                                 FROM GAS TO GRID | 5
  IN
       STIT UTE
CHAPTER TITLE

     EXECUTIVE
ES SECTION TITLESUMMARY
                   BODY TEXT

                   Body Text

          MOUN
       KY
              TA
 ROC

                IN

                               FROM GAS TO GRID | 6
   IN
        STIT UTE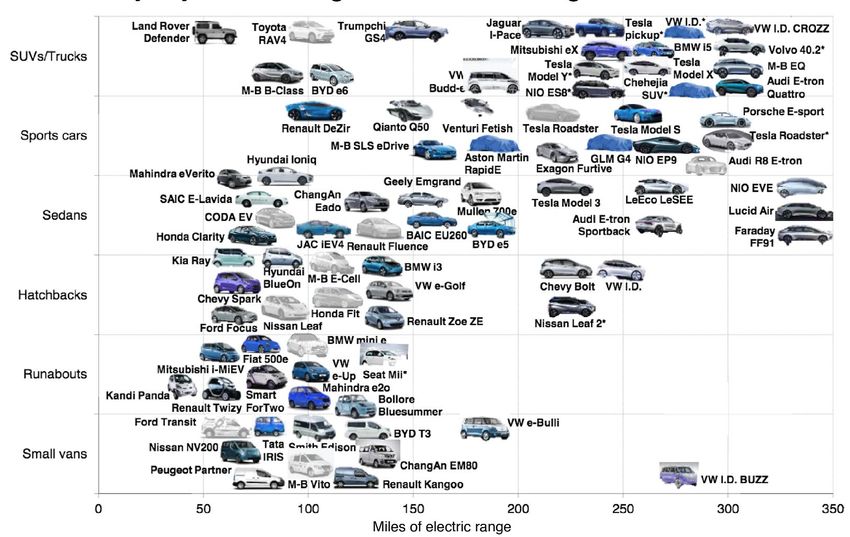
EXECUTIVE SUMMARY
                  With electric vehicles (EVs) coming on fast thanks to
                  undeniable advantages in the cost of ownership and
                  the driving experience itself, it’s time to move on from
                  the old debates about when the EV revolution will
                  arrive. It’s here. We should not allow the fact that EV
                  sales in 2016 were only about 1% of total light duty
                  vehicle sales in the U.S. to lull us into a false sense of
                  complacency. Under some reasonable assumptions,
                  there could be 2.9 million EVs on the road in the U.S.
                  within five years, bringing over 11,000 GWh of load to
                  the U.S. power grid, or about $1.5 billion in annual
                  electricity sales.1 That would constitute a nontrivial load
                  that utilities would need to accommodate well within
                  their current planning horizons, and would almost
                  certainly be the largest growth sector in the U.S.
                  electricity market for the foreseeable future.

                  There is no benefit to further delay, or to waffling over
                  whether investing in charging infrastructure is a good
                  idea. And the chicken-and-egg problem that has
                  stymied the electric vehicle revolution thus far—no one
                  wanted to build EV charging infrastructure until there
                  were more vehicles, but nobody wanted to buy EVs
                  until there was more charging infrastructure—will be
                  swept away by a fast-growing fleet of increasingly
                  affordable EVs that consumers love.

                  Sticker prices, model options, and range anxiety have
                  long been impediments to electric vehicle adoption, but
                  those barriers are set to fall within a few years. EVs are
                  already cheaper to refuel, and in some cases, such as
                  with high-usage fleet vehicles, they are cheaper to own
                  than conventional internal combustion engine (ICE)
                  vehicles. EVs are on track to sport lower sticker prices
                  than ICEs in Europe by next year, in China by 2023, and
                  in the U.S. by 2025, without incentives or subsidies.2 By
                  2020, there will be 44 models of EVs available in North
                  America, and several best-selling models can already
                  go more than 200 miles on a single charge.3

                  These trends, combined with emerging municipal and
                  state targets for EV adoption and charging
                  infrastructure deployment, indicate that the electric
                  vehicle revolution has already begun.
         MOUN
      KY
             TA
ROC

               IN

                                                                                FROM GAS TO GRID | 7
  IN
       STIT UTE
EXECUTIVE SUMMARY

                  FIGURE 1
                  RETAIL COST TO EV OWNER, OR EMPLOYER OF EV OWNER, TO CHARGE ONE MILE OF EV RANGE UNDER
                  DIFFERENT UTILITY TARIFFS AND DCFC PROGRAMS

                                             $0.25

                                             $0.20
                    Cost per mile (2016 $)

                                             $0.15

                                                                                GASOLINE COST PER MILE
                                             $0.10

                                             $0.05

                                             $0.00

                                                          DCFC     Home -               Home - TOU           Workplace               Fleet
                                                                 uncontrolled

                                             California
                                             Ohio
                                             Colorado
                                             Hawaii
                                             Texas

                  Unlike gasoline vehicles, EV owners have several                           as $0.03/mile, while the cost of fueling a gasoline
                  options for refueling their vehicles. As we show in                        vehicle varies in a much narrower band between $0.13/
                  Figure 1, the cost to fuel an EV varies significantly                      mile and $0.09/mile. Where and when EV owners will
                  depending on where the vehicle is charged, what type                       refuel their vehicles depends largely on where charging
                  of charger is used, and the utility powering the charger.                  infrastructure is installed and the prices that EV owners
                  In the five states we feature in this report, the cost to                  encounter, which can vary widely depending on the
                  charge an EV can be as high as $0.22/mile and as low                       utility tariff.
         MOUN
      KY
             TA
ROC

               IN

                                                                                                                                      FROM GAS TO GRID | 8
  IN
       STIT UTE
EXECUTIVE SUMMARY
The world doesn’t need any more cost-benefit including greenhouse gas reduction, gasoline savings,
analyses; they’ve already been done, and they show savings for all utility customers, savings in system
that vehicle electrification has numerous benefits for investment, fuel and maintenance savings, and the
drivers, utilities, communities, and society as a whole. potential for managed charging of EVs to deliver
After reviewing over 150 pieces of recent literature on various grid benefits.
EVs, we summarized the quantifiable benefits,
FIGURE 2
RANGE OF STAKEHOLDER BENEFITS FOR EVS FROM THE LITERATURE 4
$20,000
$18,744
$16,528
Total lifetime benefit per EV (2016 $)
$15,000
$10,000 $10,700 $9,607
$5,000
$3,380
$3,068 $2,186
$2,100 $1,350 $995 $940
$738
$0 $744 $414
$62 $216
-$370
n
gs
t
05 r
ge
t
vin ion
03 r
vin ak
efi
efi
*2 ne
*2 ne
tio
sa pe
vin
0
gs
0
gs
tra
n
n
sa rat
s w
s w
la
be
be
fit o
fit o
bi
sa
gu
ty U
ne
ne PEV
ne PEV
ar
ci TO
er
HG
re
el
ge
G
ay
Fu
G
G
V2
U
ep
V2
TO
pa
t
be
be
Ra
ca
MOUN
KY
TA
ROC
IN
FROM GAS TO GRID | 9
IN
STIT UTEEXECUTIVE SUMMARY
The evidence from this research and analysis shows specifying that public investments should be low-cost,
that vehicle electrification provides benefits that are so high-utility, equitable, free-market oriented, and
numerous and overwhelmingly positive for the public expeditious. The current patchwork network of vehicle
that we should no longer doubt the value of it, or charging infrastructure in the U.S. is still small enough
become distracted to the point of inaction by arguments and young enough that we lack sufficient data and
about equitability and best practices. Even non-drivers rigorous analysis to answer many of these questions.
will benefit from the drastically reduced air pollutants of Where this is the case, regulators and other
vehicle exhaust, the lower total cost of maintaining stakeholders should not delay, but rather design
mobility infrastructure, and synergistic effects that can effective pilots that can answer these questions and
put downward pressure on the price of all goods and then scale into full programs—and fast.
services, including the price of electricity and climate
change mitigation measures. Some of these benefits The path that a given utility or state might take into
will depend on smart management of EV charging vehicle electrification will vary according to different
loads, as we detailed in our 2016 report Electric configurations of several fundamental factors, such as
Vehicles As Distributed Energy Resources.5 whether the regulatory environment dictates vertically
integrated utilities or a “decoupled” utility business,
Based on this evidence, we conclude that vehicle available state and utility incentives, driving patterns, the
electrification isn’t an if or a when question anymore; it’s grid power generation mix, load patterns on the local
only a question of how fast and Can we be ready in grid, climate and social objectives, and various kinds of
time. With EV adoption sporting compound annual costs. State and municipal officials who would promote
growth rates of 30–40% in recent years in the U.S., the vehicle electrification in their jurisdictions will need to
path to an electrified future is now simpler and more understand how these factors can work for or against a
straightforward than it has ever been. The vehicles are given electrification strategy. For example, our research
coming, and we don’t need to question that any longer. shows that direct-current fast charging (DCFC)—also
What we need to do now is to understand how and known as fast charging—in an urban environment is
where to build charging infrastructure, and then start much more costly than refueling a conventional gasoline
building it to meet the demand of oncoming EVs in as vehicle, and that DCFC charging costs can vary widely
energy- and capital-efficient a way as possible. This from state to state and utility to utility.
report identifies the key hurdles that have inhibited the
growth of charging infrastructure, and explains how
they might be overcome, along with the best practices
for siting chargers and designing electricity tariffs for EV
charging stations.
However, deploying charging infrastructure for optimal
benefit to all will require careful planning, robust testing
and pilots, and appropriate incentives. Planners need to
consider how many and what kinds of chargers will be
needed and where, both now and in an autonomous
ride-hailing EV future—preferably without stranding
charging assets along the way. They will need to
consider what the best paths are for charging station
deployment, given sometimes-conflicting priorities
MOUN
KY
TA
ROC
IN
FROM GAS TO GRID | 10
IN
STIT UTEEXECUTIVE SUMMARY
FIGURE 3
ELECTRICITY COST FOR HOST SITE TO DELIVER ONE MILE OF CHARGE VIA DCFC
$0.30
$0.25
Cost per mile (2016 $)
$0.20
$0.15
GASOLINE COST PER MILE
$0.10
$0.05
$0.00
High utilization Low utilization High utilization Low utilization
Urban [9%] Urban [3%] Corridor [39%] Corridor [10%]
To demonstrate the different paths that result from • The economics of EV ownership
various combinations of these factors, we look at five • The cost of owning a charging station under
U.S. states: California, Colorado, Hawaii, Ohio, and Texas. several charging scenarios and types of charger
For each of these states, we investigate and critique: locations
• The current state of charging station deployment • How chargers are likely to be used
and ownership, and strategies for further charging • Utility tariffs for EV charging stations
station deployment • The potential benefits that managed charging
• The regulatory structure of the state, and the could provide to the state’s power grid
implications of that structure for charging station • Additional benefits of vehicle electrification
deployment
MOUN
KY
TA
ROC
IN
FROM GAS TO GRID | 11
IN
STIT UTEEXECUTIVE SUMMARY
TABLE 1
EV AND EVSE DEPLOYMENT STATISTICS BY STATE 6
EV PENETRATION EVS ON THE ROAD NUMBER OF EVS NUMBER OF EVS PER
PER L2 CHARGER DCFC
CALIFORNIA 2.10% 299,038 27 196
HAWAII 1.20% 6,178 14 88
COLORADO 0.56% 10,033 12 76
TEXAS 0.23% 18,930 10 73
OHIO 0.15% 6,973 16 52
Ultimately, our message in this report is that EVs of all times, offer a simple and easily implemented way for
sizes, shapes, and applications are coming quickly. utilities to use the charging load of EVs to provide
Utilities, their regulators, states, and municipalities need dynamic, real-time grid regulation services, and to
to be prepared to implement programs now that will provide a flexible load to meet supply. Actively
transform the mobility marketplace. States that are managing the charging of EVs via aggregator
ahead of the curve on EV integration will enjoy lower companies, or even via direct utility control, may also be
total transportation costs, lower emissions, and a more useful, although the methods for doing so are still fairly
efficient grid, and will likely be perceived as more nascent. By using EVs to absorb excess solar and wind,
favorable business climates able to attract a high-quality utilities can avoid curtailment of those generators,
labor pool seeking high-quality lifestyles. Conversely, increase their share of the total electricity supply, and
states that fall behind the curve are likely to face a possibly displace or avoid the need for conventional
sudden need to install expensive infrastructure and fossil-fueled generation. Utilities can realize these
generation for peak capacity, possibly leading to a benefits starting now, with each new EV that appears on
less-efficient grid with higher prices for consumers. The their grids. There is no benefit to delaying exploring how
rapid and unplanned adoption of air conditioning 50 to accommodate EV loads intelligently.
years ago put grid operators in just such a position, and
it could happen again now, only at a much larger scale Areas that are just beginning to install public charging
and a much higher cost. It is absolutely critical to get stations may want to begin with a pilot program in a
right the programs and infrastructure for vehicle high-use retail area or commuting corridor.
electrification from the start, with appropriate tariffs, Communities that have already done pilots may want to
well-planned charging infrastructure, and the ability to turn insights gained from them into a more
manage chargers either directly or through aggregators. comprehensive plan, and start building charging
stations in earnest. Every charging station that is
With careful planning and early intervention, the electric deployed should deliver useful data that can be
vehicle revolution can help optimize the grid and reduce captured and analyzed to help decision makers
the unit cost of electricity, while increasing the share of understand the value/risk proposition of vehicle
renewable electricity and reducing emissions in both the electrification in their communities. Regardless of how
electricity and transportation sectors.7 Passive far along they are in deploying charging stations, all
management techniques, such as using time-of-use communities would be well advised to gather data from
(TOU) tariffs to motivate drivers to charge at off-peak pilot projects and then use it to inform subsequent
MOUN
KY
TA
ROC
IN
FROM GAS TO GRID | 12
IN
STIT UTEEXECUTIVE SUMMARY
deployments as the charging network scales up. costs, and unnecessary strife in regulatory proceedings
Without careful and early planning, robust testing, and as utilities, interveners, and regulators struggle to catch
demonstration projects, we could wind up with a lot of up and repair damage that was entirely avoidable.
inefficient and expensive generation capacity with low Our message is clear and simple: Building EV charging
load factors, unnecessary transmission and distribution infrastructure should be an urgent priority in all states
infrastructure permanently embedded into utility rate and major municipalities. Getting it right will require
bases, a network of chargers that doesn’t provide unprecedented cooperation by many stakeholder
cost-effective and accessible support for EVs, higher groups. The time to act is now.
MOUN
KY
TA
ROC
IN
FROM GAS TO GRID | 13
IN
STIT UTECHAPTER TITLE
THE EVTITLE
01 SECTION REVOLUTION IS HERE
BODY TEXT
Body Text
MOUN
KY
TA
ROC
Tesla model 3, image © Tesla
IN
FROM GAS TO GRID | 14
IN
STIT UTETHE EV REVOLUTION IS HERE
Consumers who have EVs love them. The top four After tax credits, there are now 15 models of EVs
vehicles in the 2015 Consumer Reports Annual Auto available from major manufacturers under $30,000,
Survey were all either full-electric vehicles (aka battery which is the price at which widespread adoption is
electric vehicles, or BEVs) or electric plug-in hybrid generally considered likely. Of those models, 10 have at
electric vehicles (PHEVs).8 Their smooth rides, low least a 50-mile range in all-electric mode.10 Many more
noise, lack of exhaust, fast acceleration and superior models are expected by 2020, and Ford expects that,
torque, very low maintenance needs, and fueling costs within 15 years, the number of EV models available will
at about one-third of an internal combustion engine be greater than the number of ICE models. Ford alone
(ICE) vehicle, make electric vehicles far more enjoyable plans to ship 13 EV models in the next five years.11
to drive and cheaper to own.9 Volkswagen has announced that it intends to launch 30
models of EVs over the next nine years.12 Volvo projects
The hurdles to widespread consumer adoption of EVs that all of its new models will include electric drive by
are well known: higher purchase prices, a limited 2019.13 BMW and Mercedes-Benz expect EVs to be
number of models, range anxiety, and a lack of public 15–25% of their sales by 2025.14 Even Porsche, a
charging infrastructure (charging stations that are longtime holdout on making EVs, has announced that it
available without restriction to the public). But the first now thinks electric models will be half of its production
three of those hurdles are now falling. by 2030.15 Bloomberg New Energy Finance anticipates
that by 2020, there will be 39 models of PHEVs and 44
models of EVs available in North America.16
FIGURE 4
SAMPLE OF EV MODELS AVAILABLE THROUGH 2020
Source: Bloomberg New Energy Finance 17
MOUN
KY
TA
ROC
IN
FROM GAS TO GRID | 15
IN
STIT UTE01: THE EV REVOLUTION IS HERE
The falling cost of EVs is due primarily to the falling factories under planning and construction around the
cost of battery packs and to vehicle manufacturers world, and an expected sharp increase in vehicle sales
moving beyond the production of EVs merely to serve by 2020. Bloomberg New Energy Finance expects the
as “compliance cars.” That trend looks set to continue price of lithium-ion battery packs to fall 43% by 2021,
with numerous gigawatt-scale lithium-ion battery from $273 per kilowatt-hour today to $156.18
FIGURE 5
BNEF FORECAST FOR THE COMBINED COST OF LITHIUM-ION BATTERY CELLS AND PACKS
1,000
900
800
BNEF observed values:
Annual lithium-ion battery
price index 2010–2016
700
600
$/kWh
500
400
2025 average lithium-ion
battery price: $109/kWh
300
2030 average lithium-ion
200
battery price: $73/kWh
100
0
2010 2012 2014 2016 2018 2020 2022 2024 2026 2028 2030 2032
Year
BNEF observed values
19% learning rate Source: Bloomberg New Energy Finance 19
MOUN
KY
TA
ROC
IN
FROM GAS TO GRID | 16
IN
STIT UTE01: THE EV REVOLUTION IS HERE
Lower battery costs mean that it’s now feasible to calm previously expected, as battery costs plunge, actual
range anxiety at an acceptable price.20 The base rock-bottom maintenance costs become more evident,
model Tesla Model 3, which has begun shipping, sells and EV adoption rates accelerate.26 UBS believes that
for less than $30,000 after the federal tax credit and in Europe, the total cost of ownership of an EV is
sports at least 215 miles of range (and up to 300 miles already nearly equal to that of an equivalent ICE
with an optional larger battery).21 The 2017 Chevrolet vehicle. It expects cost parity on a total cost of
Bolt can be had for less than $30,000 after the federal ownership basis to be reached in Europe by next year,
tax credit, and has a 238-mile range. And by 2020, in China by 2023, and in the U.S. by 2025, without
Ford plans to launch a mass-produced crossover utility incentives or subsidies. And although vehicle
model with at least a 300-mile range, which will be manufacturers are currently losing money on EV sales
priced competitively for the mass consumer market.22 on an EBIT (earnings before interest and taxes) basis,
UBS sees a positive 5% EBIT margin in Europe by
The falling cost of EVs has increased sales, and 2023, in China by 2026, and in the U.S. by 2028.
accelerated sales seem destined to continue.
Worldwide EV sales in 2016 were up 42% over 2015, Even consumers who don’t think about the total cost of
and U.S. sales were up 36% over 2015.23 Total SA, a ownership and only look at the sticker price will soon
major oil company, believes EVs will make up 15–30% be convinced that EVs are cheaper. Bloomberg recently
of new-car sales by 2030.24 In China and India, the new suggested that EVs could be cheaper than their ICE
growth markets for vehicles globally, EVs are expected equivalents by 2030.27 Additionally, the second-hand
to take significant market share. China’s “road map,” market for EVs, which is only just getting started, will
released in April 2017, calls for 20% of new vehicle make earlier models of EVs attractive to segments of
sales to be alternative fuel vehicles by 2025. And in the market for which premium-priced vehicles were out
India, the government is aiming for full electrification of of reach.
all vehicles by 2032.25
A central EV sales forecast from Bloomberg New Energy
The ongoing battery-cost reductions are finally making Finance sees U.S. EV sales rising to over 640,000 per
EVs competitive with ICE vehicles. According to the year by 2021; however, it thinks it’s also possible that
investment bank UBS, EVs are approaching cost parity annual EV sales in the U.S. could rise to nearly 800,000
with equivalent ICE vehicles far more quickly than by 2021, with Tesla selling 250,000 of them.
MOUN
KY
TA
ROC
IN
FROM GAS TO GRID | 17
IN
STIT UTE01: THE EV REVOLUTION IS HERE
FIGURE 6
BNEF EV SALES FORECAST THROUGH 2025
BEV PHEV EV % of new sales
2,500,000 12%
10%
2,000,000
EV sales forecast in the U.S.
8%
1,500,000
% of new sales
6%
1,000,000
4%
500,000
2%
0 0%
10
11
12
13
14
15
16
17
18
19
20
21
22
23
24
25
20
20
20
20
20
20
20
20
20
20
20
20
20
20
20
20
Source: BNEF28
In addition to the market pull of lower prices, EVs will Sticker prices, model options, and range anxiety will soon
benefit from a variety of policy pushes. For example, disappear as impediments to the adoption of electric
both Britain and France have pledged to ban all new vehicles. In fact, the economics and emerging policy
petrol and diesel cars and vans after 2040.29 The targets for EVs indicate that the EV revolution is all but
Netherlands, Norway, and Germany have contemplated inevitable. It’s not an if or even a distant when question
implementing similar bans as soon as 2025.30 The anymore; it’s more one of Can we be ready in time? EV
mere specter of such policies is likely to accelerate EV sales could hit the rapid-growth part of the technology-
adoption, even in the U.S., as elected officials and adoption S-curve as soon as 2026, in the estimation of
drivers seek to position themselves advantageously in Bloomberg New Energy Finance,32 and given the typical
advance of a well-telegraphed major market shift. lead time on utility infrastructure investments, that might
as well be tomorrow. In our view, the balance of risk now
tilts toward deploying charging stations too late and with
“The future is definitely electric, no question in insufficient advance planning, not too early. And there is
my mind, it’s more of, ‘what is the future no benefit to delaying preparations for intelligent EV load
timeline?’ Is it 10 years, 15 years, 40 years?... management. Utilities can realize the benefits of EV-grid
We don’t see an alternative more interesting integration today, and increase their learning with each
[than] that, it’s just a matter of what the new EV that appears on their grids.
adoption hits at the scale that makes this a
slam dunk." The missing link now is widely available charging infra-
–Tom Gebhardt, Chairman and CEO of Panasonic’s structure. How and where to build the charging network,
North American operations31 and who should build it, is the subject of this report.
MOUN
KY
TA
ROC
IN
FROM GAS TO GRID | 18
IN
STIT UTE01: THE EV REVOLUTION IS HERE
ACCELERATING THE EV REVOLUTION: Maven car-sharing service has found that ride-hailing
SHARED MOBILITY AND VEHICLE services using their vehicles tend to charge at times of
AUTONOMY the day when existing DCFC networks have low
High-usage fleet vehicles are prime candidates for utilization, as in the mornings and later in the evenings.
electrification. The total cost of ownership is already DCFC owners could offer time-varying prices for using
lower for EVs than for conventional ICE vehicles. By their chargers that would encourage drivers to charge
concentrating charging at purpose-built charging at times of low demand, which would help fleet
depots, where capital costs can be spread over a operators save money and help DCFC owners increase
larger number of charging events and charging their utilization rates.
behavior can be managed to provide valuable grid
services, fleet operators can lower charging costs Figure 7 shows the five-year total cost of operation
further. What has been lacking for operators of EV (assuming a 10% discount rate) for a fleet of 30 Chevy
fleets is sufficient charging infrastructure of this nature. Bolts driving 25,000 miles per year, and compares
those costs to the cost of operating a fleet of 30
Fleets can also be managed to use public chargers compact ICEs, based on average ICE fleet cost and
(chargers that are available without restriction to the performance.33 (See the Appendix for details on the
public) during times of low demand, and help to methodology of this analysis.) These results
optimize the use of those chargers. For example, GM’s demonstrate the favorable economics of EVs in fleet
FIGURE 7
FIVE-YEAR TOTAL COST OF OWNERSHIP NET PRESENT VALUE FOR A FLEET OF 30 VEHICLES IN COLORADO, ICE VS. EV
$1,600,000 Tax benefits
Vehicle purchase price
Finance
Total cost of ownership (2016 $)
Insurance
$1,200,000
Maintenance
Fuel & Electricity
$800,000
$400,000
$0
ICE EV
MOUN
KY
TA
ROC
IN
FROM GAS TO GRID | 19
IN
STIT UTE01: THE EV REVOLUTION IS HERE
deployment under current capital and operational AND THE SELF-DRIVING PHASE OF THE
costs after federal and Colorado state-level tax REVOLUTION IS EN ROUTE
rebates. As shown in the chart, the primary savings are The takeover of the personal vehicle market by EVs will
from lower maintenance and fuel costs. However, those be accelerated by the penetration of autonomous
savings are largely offset by the cost premium of the (self-driving) vehicle technology. Rocky Mountain
EV. The capital cost of the Chevy Bolt is roughly Institute’s 2016 report, Peak Car Ownership, estimated
$10,000 higher than a typical ICE counterpart, and that shared autonomous electric vehicles (SAEVs)
federal and state tax credits are currently necessary to could obtain roughly a one-third share of the market for
tip the total cost of ownership in favor of EVs. However, light-duty vehicles by the late 2020s.34 According to
as battery costs continue to decline and production our model, automated mobility services could capture
volume increases, the tax credits will no longer be two-thirds of the entire U.S. mobility market in 15 to 20
needed and EVs will be economically favorable over years, starting with urban areas. Other forecasters are
ICEs without the help of subsidies. even more bullish. RethinkX projected in its 2017
report, Rethinking Transportation, that SAEVs will
account for nearly all light vehicle sales by 2030 as ICE
vehicles are made obsolete, rendering 97 million of
them “stranded.”35
FIGURE 8
PROJECTED LIGHT-DUTY VEHICLE DEMAND.
Annual LDV Projected U.S. Light-Duty Vehicle Demand
Demand
20
Personal Vehicles
15
Millions
Automated Mobility
10 Service Vehicles
5 EIA Projected LDV
Sales
0
Peak car ownershio
2015 2020 2025 2030 2035
Year
Source: RMI, Peak Car Ownership (2016)36
MOUN
KY
TA
ROC
IN
FROM GAS TO GRID | 20
IN
STIT UTE01: THE EV REVOLUTION IS HERE
The Brattle Group observes that the many advantages “‘There is a major disruption looming there,’
of SAEVs over individually owned ICE vehicles could [Apple CEO Tim] Cook said on Bloomberg
engender their rapid adoption, apart from other Television, citing self-driving technology,
pressures like decarbonization or utility programs to electric vehicles and ride-hailing. ‘You’ve got
increase load. Lower accident and fatality rates, better kind of three vectors of change happening
access to mobility for underserved populations, generally in the same time frame.’”38
reduced need for urban parking spaces, reduced traffic
congestion, better air quality and lower overall
transportation costs will all attract riders and reduce
the appeal of owning and driving a vehicle.37
Automakers are increasingly invested in the SAEV
future as well. Uber has been testing autonomous
vehicles in Pittsburgh, PA; San Francisco; and Tempe,
AZ. Lyft and Waymo have announced their own
collaboration on autonomous vehicles. Ford, Volvo,
Tesla, GM, Volkswagen, Honda, and Audi have all
made investments in self-driving technology, and some
have begun testing autonomous vehicles. Tesla alone
has already logged more than 200 million “autopilot”
miles. Ford has announced that it will mass-produce
autonomous vehicles for use in ride-hailing services
(with no steering wheel) by 2021. Google, Apple, Intel,
and other major tech firms have also been making
substantial investments in autonomous vehicle
research and development.
Whether the SAEV future arrives in this decade, or
several decades from now, if it is well planned and
executed and built on an EV platform, it can be safer,
cheaper, more enjoyable, and more environmentally
friendly than today’s personal transportation regime.
In fact, its benefits could be so numerous as to make
it inevitable.
But between now and then, we will need to deploy
charging infrastructure, both for today’s rapidly growing
fleet of EVs, and for SAEVs when they arrive in large
numbers. As we discuss in “The impact of ‘Dieselgate’”
on p.35, it will be important to consider the different
charging needs and adoption rates of electric personally
owned vehicles (POVs) and fleets of SAEVs, and plan
the deployment of charging stations accordingly.
MOUN
KY
TA
ROC
IN
FROM GAS TO GRID | 21
IN
STIT UTECHAPTER TITLE
THE ECONOMICS
02 SECTION TITLE OF EVS
AND GRID INTEGRATION
BODY TEXT
Body Text
MOUN
KY
TA
ROC
IN
FROM GAS TO GRID | 22
IN
STIT UTETHE ECONOMICS OF EVS
AND GRID INTEGRATION
Numerous studies from across academia, think tanks, tabulated values). What this exercise demonstrates
consulting firms, and industry trade groups have most clearly is that EVs provide value to all stakeholder
exhaustively analyzed the costs and benefits of vehicle groups, but characterizing that value in a generalized
electrification. Often these studies present the value way is not useful, due to the myriad variances from
and cost of electric vehicles from a single stakeholder place to place. However, we can make the general
perspective and consider only a subset of the full assertion that when EVs are properly integrated
range of values EVs offer. In this report, we aggregate with the grid, they provide value to both customers
and then normalize results from 11 studies and present and the grid, but maximizing the value (and avoiding
the values in dollars per EV, over the lifetime of the unnecessary costs) will require thoughtful planning
vehicle, in 2016 dollars. As shown in Figure 9, the and collaboration across all stakeholder groups. It will
values vary significantly within value categories as also require some courage on the part of decision
well as across them. This range can be attributed to makers to test early and take action before substantial
many factors, including but not limited to: electricity demand materializes, in the interest of protecting utility
market, utility regulation, battery size, tariff structure, customers and society as a whole from hasty, late, and
generation mix, distribution system age and capacity, poorly considered infrastructure investments.
and vehicle characteristics (see Appendix for detailed
FIGURE 9
RANGE OF STAKEHOLDER BENEFITS FOR EVS FROM THE LITERATURE39
$20,000
$18,744
$16,528
Total lifetime benefit per EV (2016 $)
$15,000
$10,000 $10,700 $9,607
$5,000
$3,380
$3,068 $2,186
$2,100 $1,350 $995 $940
$738
$0 $744 $414
$62 $216
-$370
n
gs
fit
05 r
ge
fit
vin ion
03 r
vin ak
*2 ne
*2 ne
tio
ne
ne
sa pe
vin
0
gs
0
gs
tra
sa rat
s w
s w
la
be
be
fit o
fit o
bi
sa
gu
ty U
ne
ne EV
ne PEV
ar
ci TO
er
HG
re
el
ge
G
ay
be P
Fu
G
G
V2
U
ep
V2
TO
pa
t
be
Ra
ca
MOUN
KY
TA
ROC
IN
FROM GAS TO GRID | 23
IN
STIT UTE02: THE ECONOMICS OF EVS AND GRID INTEGRATION
Below we provide a brief description of the major EV capital cost of the vehicles, the fuel economy, the fuel
benefit categories. price, and the driving patterns of the vehicle owner.
However, it is clear that fueling and maintenance costs
Gasoline savings – The difference in the cost of for EVs are considerably lower than for ICE vehicles.
fueling an average ICE vehicle as compared to its
EV counterpart. This value is sensitive to gas and GHG benefit – The value of avoided greenhouse gas
electricity prices as well as to the assumed fuel (GHG) emissions as compared to a typical ICE vehicle,
economy of the vehicle. based on the GHG emission intensity (the emissions
per unit of grid power generated) for a specific utility
Utility customer benefits – Benefits to utility or region, and an assumed vehicle fuel economy. This
customers are often calculated using a standard value is typically derived from an assumed $/ton CO2
ratepayer impact measure (RIM). The RIM is a and is often assumed as an externality that is typically
calculation that measures what happens to a not monetized.
customer’s bill due to changes in utility revenues
and operating costs resulting from implementing V2G regulation – The value of vehicles responding
a new program or tariff. In the case of EV-specific to frequency regulation signals by sending electricity
rates or programs, a positive RIM means the revenue back to the grid, using vehicle-to-grid (V2G)
generated from EV charging is higher than the technology. This value is highly dependent on the
marginal cost to serve those customers and thus power capacity of the battery and the electricity
creates downward pressure on all rates. market in which it is participating. These values are
fairly theoretical, as there are currently no major
Time-of-use generation savings – The difference utilities or vehicles that allow V2G operation at
in cost of energy generation when vehicles charge commercial scale in the United States.
during the off-peak hours of a TOU rate. This value
is highly dependent on the generation mix and the V2G energy arbitrage – The value that can be
economic dispatch order of the generator fleet. captured by charging an EV battery during low-cost
This value is not a net benefit to the grid or to an EV periods and then selling that energy back to the grid
owner. Rather, it should be considered a cost that can during high-cost periods. These values are fairly
be avoided if drivers respond to a time-varying rate theoretical, as there are currently no major utilities or
designed to reduce on-peak consumption. vehicles that allow V2G operation at commercial scale.
Time-of-use peak capacity savings – The avoided G2V services – Although they are currently hard to
cost of building new peaking capacity that can be quantify because they are so new that empirical data
realized by managed charging as compared to is hard to come by (hence their absence from Figure
uncontrolled charging. This value is not a net benefit 9), managed charging can provide numerous ancillary
to the grid or to an EV owner. Rather, it should be services to the grid, as we detailed in our 2016 report,
considered a cost that can be avoided if drivers Electric Vehicles as Distributed Energy Resources.40
respond to a time-varying rate designed to reduce on- These services include demand response, frequency
peak consumption. regulation, voltage regulation, and other technical
grid support services, and are sometimes collectively
PEV net owner benefit – The net benefit or cost of referred to as grid-to-vehicle (G2V) services. Rather
owning a plug-in electric vehicle (PEV) as compared to than sending energy back to the grid as with V2G
an ICE vehicle. This value is highly dependent on the services, G2V services are typically provided by an
MOUN
KY
TA
ROC
IN
FROM GAS TO GRID | 24
IN
STIT UTE02: THE ECONOMICS OF EVS AND GRID INTEGRATION
aggregator who turns a group of charging stations off
(or down) when the grid is stressed, or when the utility
issues a demand-response request. This service
does not require bidirectional inverters, but it does
require that vehicles charge at rates lower than their
maximum capacity to allow for “regulation down”
events (e.g., vehicles increase their charging rate to
lower grid frequency).
Understanding how to interpret and apply these
benefits can be a complicated task. Although a single
EV can and does provide these benefits, it is not
possible to simply add them up to arrive at a single net
benefit, partly because providing one service can limit
the opportunity to realize value from another service.
For example, one might have to be charging during an
on-peak period of a TOU rate in order to be available
to provide a frequency response service to the grid.
Or charging only during the off-peak hours of a TOU
rate may mean charging during times when the GHG
emission intensity is higher (for example, charging
overnight when coal is the marginal generator on some
grids) and thus reducing the GHG-reduction value. This
would not be the case where TOU rates are designed
to shift charging to periods of excess renewable
generation, as is increasingly the case in California.
Therefore, integrating large quantities of EVs into our
electricity system will be a challenging optimization
problem that must consider the needs of the EV owner
or fleet operator, while also considering what is most
cost-effective for the grid, in addition to other social
goals like decarbonization and equitable access to
charging facilities. This necessarily requires granular
and intelligently designed price signals that will allow
users to make economically guided decisions.
MOUN
KY
TA
ROC
IN
FROM GAS TO GRID | 25
IN
STIT UTECHAPTER TITLE
GET READY
03 SECTION TITLE
BODY TEXT
Body Text
MOUN
KY
TA
ROC
Charging stations, courtesy of Felix Kramer
IN
FROM GAS TO GRID | 26
IN
STIT UTEGET READY
EV sales in the U.S. have been growing at a compound to around $6,000 (for a commercial public installation
annual growth rate of 32% for the past four years, involving removing and replacing concrete, trenching,
and monthly 2017 sales data suggests that the sales running conductors, and other tasks). The cost of
rate is accelerating sharply. Under some reasonable installing a bank of Level 2 chargers, for example at a
assumptions, there could be 2.9 million EVs on the workplace or shopping mall, is therefore not negligible.
road in the U.S. within five years, bringing over 11,000
GWh of load to the U.S. power grid, or about $1.5 DCFC chargers are expensive, typically running
billion in annual electricity sales that utilities will need around $50,000 per charger installed, although some
to accommodate well within their current planning installations can cost considerably more. With so few
horizons.41 DCFC chargers installed across the U.S., there is limited
cost data available, and it varies widely. After including
It’s time to focus on how to deploy charging costs for project development, design, permitting, and
infrastructure, so that we can do it deliberately, at the system upgrades, it’s not unusual for the total cost of
lowest possible cost, and with the greatest possible DCFC deployment to run as high as $300,000 each.
benefit, instead of reactively, inefficiently, These costs limit the business opportunity for public
and ineffectually. DCFC chargers. Unfavorable rate design (see “Tariffs”
on p.42) exacerbates the challenge, and low utilization
BARRIERS TO DEPLOYING rates (because there aren’t yet enough EVs on the
INFRASTRUCTURE road) make it very difficult to show the business case
The best practices in deploying charging infrastructure at present. At a retail price for electricity that would be
may vary from place to place. The arguments against on par with fueling with gasoline (around $0.29/kWh,
deploying charging infrastructure may vary from place according to our analysis,42 or around $0.09–$0.13/mile
to place too, depending on the regulatory environment, cost to the driver), recovering the capital from DCFC
the popular perceptions of EVs, and other factors. investments is extremely slow.
We interviewed nearly two dozen experts on EV-grid
integration to get their perspectives on the common SOLUTION
arguments they have heard against investing in Rebates or other incentive programs for homeowners
charging station networks. Here, we address those and businesses to install Level 2 chargers for customers
arguments. and employees are a relatively low-cost way to satisfy
charging needs over the next decade while offering the
THE COST OF INSTALLING CHARGERS IS TOO HIGH greatest grid-interactive flexibility. Therefore, ubiquitous
There are three major types of charger, and their costs deployment of Level 2 chargers should be a top policy
are very different. (See Table 2 Types of Chargers on objective. Many utilities already offer rebates on home
p.33 for details.) and workplace charging stations. With modest support,
it should be within reach of most homeowners and
Level 1 charging is built into every EV, so the only cost commercial businesses to install an appropriate number
is for an extension cord to run from the vehicle to a of charging stations to support their own personal
standard wall outlet. needs or those of their employees and customers.
Level 2 charging requires the installation of a special DCFC installations will need more than rebates;
charging unit and access to 240V service. The cost specifically, they will need larger amounts of “patient
of installing a Level 2 charger can run from around capital” to support their installation and operation
$500 (to buy a unit off the shelf and install it at home) for a decade or longer. DCFC installations will need
MOUN
KY
TA
ROC
IN
FROM GAS TO GRID | 27
IN
STIT UTEYou can also read


