Child Poverty and Deprivation in Refugee-Hosting Areas - EvidEncE from Uganda - Unicef
←
→
Page content transcription
If your browser does not render page correctly, please read the page content below
THE
THE REPUBLIC
    REPUBLICOF
             OFUGANDA
               UGANDA

                        Child Poverty and
                           Deprivation in
                         Refugee-Hosting
                                   Areas
                         Evidence from Uganda
ACKNOWLEDGEMENTS
Building on the inclusion of a module on the consensual approach to measuring child poverty
and deprivation in the Uganda National Household Survey (UNHS, 2016/17) by the ever-innovative
Uganda Bureau of Statistics (UBoS), this study represents the first attempt to compare child
poverty and deprivation in host and refugee communities in the country. Globally, it represents
the first application of the consensual approach to poverty in emergency situations.

The research and drafting of this report was led by Sheila Depio, Gemma Ahaibwe and Ibrahim
Kasirye at the Economic Policy Research Centre (EPRC), in close collaboration with Shailen Nandy
and Marco Pomati at the University of Cardiff, and Nathalie Meyer and Diego Angemi at UNICEF
Uganda.

Frances Ellery provided significant editorial inputs, while Rachel Kanyana designed the report and
all associated advocacy materials.

Photo credits @UNICEF
THE
     THE REPUBLIC
         REPUBLICOF
                  OFUGANDA
                    UGANDA

Child Poverty and Deprivation
  in Refugee-Hosting Areas
     Evidence from Uganda
                             2018
FOREWORD
While Uganda’s rigorous involvement with refugees dates back to the 1960s, the recent influx (starting
in mid-2016) has been the greatest the country has ever experienced. In fact, for the first time in the
country’s history, the number of refugees has crossed the 1 million mark and in some districts such as
Adjumani and Moyo there are now more refugees than host population.

This study provides evidence on the situation and vulnerability of refugees in Uganda, including urban
refugees in Kampala, and that of host communities in the main refugee-hosting regions. It identifies the
determinants of social service sufficiency, and provides practical recommendations on how to manage
social service delivery equitably for both refugee and host communities.

Most importantly, the findings and policy recommendations provide an unprecedented opportunity to
alleviate child poverty and deprivation by strengthening the connections between national development
and humanitarian response. Only by fostering better cohesion and integration between refugees and
hosts will we make progress vis-à-vis the post-2015 SDG agenda and achieve inclusive growth.

Sarah Ssewanyana                                                                               Doreen Mulenga
Executive Director                                                                       Country Representative
Economic Policy Research Centre (EPRC)                                                          UNICEF Uganda

                                     Child Poverty and Deprivation in Refugee-Hosting Areas: Evidence from Uganda   i
CONTENTS
FOREWORD.................................................................................................................................................................i
Acronyms............................................................................................................................................................. vi
Definitions..........................................................................................................................................................vii
Executive Summary........................................................................................................................................viii

INTRODUCTION........................................................................................................................................................1
1.1        Background and overview of refugee hosting in Uganda................................2
1.2	Trends and demographic characteristics of refugees and asylum
    seekers.....................................................................................................................................5
1.3	Policy framework for refugee hosting in Uganda .............................................7
1.4        Extent of vulnerability in refugee and host communities...............................9

METHODOLOGY......................................................................................................................................................13
2.1	Study site selection and study site profiles.........................................................15
2.2	Household survey.............................................................................................................15
2.3        Qualitative data..................................................................................................................16
2.4	Survey design and sample size....................................................................................17

CHILD POVERTY AND DEPRIVATION..................................................................................................................18
3.1	Socially-perceived necessities (SPNs)........................................................................19
3.2	Deprivation of SPNs for children among hosts and refugees.......................20

ACCESS TO BASIC SERVICES..............................................................................................................................24
4.1	Health.....................................................................................................................................25
4.1.1 Access to health services........................................................................................................25
4.1.2 Utilisation of health services...................................................................................................27
4.1.3 Nutrition ...................................................................................................................................29
4.1.4 Barriers to health care access.................................................................................................33
4.1.5 Key findings..............................................................................................................................35
4.2        Education..............................................................................................................................35
4.2.1 Attending school and access to education.............................................................................35
4.2.2 School facilities and expenditure............................................................................................39
4.2.3 Barriers to education................................................................................................................41
4.2.4 Key findings..............................................................................................................................43
4.3	Protection............................................................................................................................44
4.3.1 Birth registration ....................................................................................................................44
4.3.2 Child marriage and teenage pregnancy.................................................................................46
4.3.3 Violence.....................................................................................................................................46

 ii    Child Poverty and Deprivation in Refugee-Hosting Areas: Evidence from Uganda
4.3.4 Child labour..............................................................................................................................47
4.3.5 Protection and justice systems...............................................................................................47
4.3.6 Key findings .............................................................................................................................48
4.4 Clean and safe environment........................................................................................49
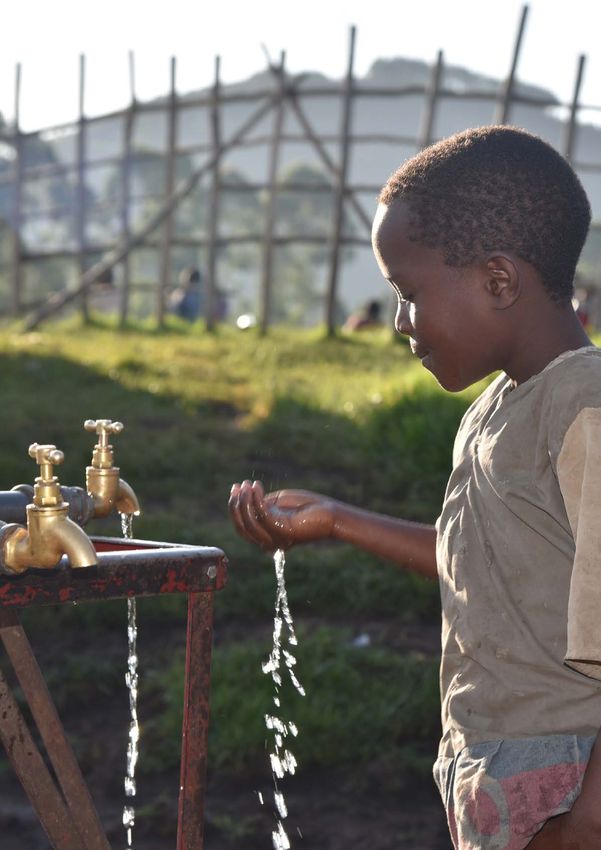
4.4.1 Water infrastructure ...............................................................................................................49
4.4.2 Latrine coverage .....................................................................................................................51
4.4.3 Constraints to WASH................................................................................................................52
4.4.4 Handwashing and hygiene programmes...............................................................................53
4.4.5 Key findings..............................................................................................................................53
4.5 Welfare and economic activity....................................................................................54
4.5.1 Household livelihoods.............................................................................................................54
4.5.2 Access to agricultural land ....................................................................................................55
4.5.3 Key findings .............................................................................................................................57
TOWARDS SOCIAL INTEGRATION.......................................................................................................................58
5.1 Water deprivation .............................................................................................................59
5.2 Sanitation deprivation ...................................................................................................60
5.3 Shelter deprivation...........................................................................................................61
CONCLUSIONS AND RECOMMENDATIONS ....................................................................................................63
6.1 Conclusions........................................................................................................................64
6.2 Policy recommendations ...............................................................................................67
References...........................................................................................................................................................69
Appendices .........................................................................................................................................................72
Appendix 1: Technical notes on methodology ..................................................................73
Appendix 2: Perceptions of items/activities ‘essential’ for children (%), comparing
UNHS 2016/17 with EPRC 2017 refugee survey....................................................75
Appendix 3: Imputing deprivation of socially-perceived necessities (SPNs) among
host and refugee populations........................................................................... 76
Appendix 4: Household head characteristics.....................................................................79
Child Poverty and Deprivation in Refugee-Hosting Areas: Evidence from Uganda iii
List of Figures
Figure 1: Trends in refugees and asylum seekers in Uganda (1961–2017)..............................................2
Figure 2: Map showing refugee settlements in Uganda (February 2018)...............................................3
Figure 3: Refugee summary statistics (2017).........................................................................................6
Figure 4: Households having less than two meals a day by settlement (%)........................................ 10
Figure 5: Proportion (%) of children aged 6–12 years who are out of school....................................... 10
Figure 6: Percentage of households using a protected source for drinking water............................... 11
Figure 7: Ascertaining enforced lack of socially perceived essentials of life/necessities......................14
Figure 8: Deprivations of SPNs for children, hosts versus refugees (%).............................................20
Figure 9: Host and refugee households deprived of SPNs in Kampala (%)..........................................21
Figure 10: Host and refugee households deprived of SPNs in South West (%)...................................22
Figure 11: Host and refugee households deprived of SPNs in West Nile (%)......................................23
Figure 12: Distance to health facility....................................................................................................25
Figure 13: Distance to health facility, by region....................................................................................26
Figure 14: Common diseases .............................................................................................................27
Figure 15: Trends in full vaccination status, Uganda.............................................................................28
Figure 16: Average distance to school ................................................................................................38
Figure 17: Average distance to school, by region.................................................................................39
Figure 18: Children receiving an education scholarship/subsidy (%)....................................................40
Figure 19: Children receiving a subsidy/scholarship, by region.............................................................41
Figure 20: Proportion of children with birth certificates........................................................................44
Figure 21: Proportion of children with birth certificates, by region.......................................................45
Figure 22: Children whose births are registered, by age (%)...............................................................45
Figure 23: Distribution of households by source of drinking water (%)...............................................49
Figure 24: Distance (kms) to nearest water source, travel and waiting times (minutes)......................50
Figure 25: Latrine coverage (%) .........................................................................................................52
Figure 26: Households with access to agricultural land (%).................................................................56
Figure 27: Households with access to agricultural land, by region (%)................................................57
Figure 28: Water deprivation by household type..................................................................................59
Figure 29: Water deprivation by household type and region of residence............................................60
Figure 30: Sanitation deprivation by household type ...........................................................................60
Figure 31: Sanitation deprivation by household type and region of residence.....................................61
Figure 32: Shelter deprivation by household type ..............................................................................62

 iv   Child Poverty and Deprivation in Refugee-Hosting Areas: Evidence from Uganda
List of Tables
Table 1: Type of toilet facility (%)..........................................................................................................12
Table 2: Extent of marriage, pregnancy and orphanhood among children ...........................................12
Table 3: Selected indicators for poverty and deprivation ....................................................................16
Table 4: Qualitative data collection tools and techniques.....................................................................17
Table 5: Distribution of actual survey respondents...............................................................................17
Table 6: Perceptions of items/activities ‘essential’ for children (%)......................................................19
Table 7: Type of facility where first consultation of major illness was sought (%)................................26
Table 8: Immunization coverage (%) for children aged 1–5 years.........................................................29
Table 9: Monthly food rations (quantity and items) by category..........................................................30
Table 10: Proportion of 6–17-year-olds in school (%).............................................................................36
Table 11: School attendance by levels .................................................................................................37
Table 12: Educational attainment (15 years and above)........................................................................37
Table 13: Distance to education services.............................................................................................39
Table 14: Do children get meals at school (%)?....................................................................................40
Table 15: Primary school ownership, infrastructure and enrolment in Bidi Bidi settlement –
Yumbe district.......................................................................................................................................42
Table 16: Main source of livelihood (%)................................................................................................54
Table 17: Main source of livelihood by duration of stay (refugees only) (%).........................................55

                                                       Child Poverty and Deprivation in Refugee-Hosting Areas: Evidence from Uganda                   v
Acronyms
DRC           Democratic Republic of Congo
ECD           Early childhood development
FGD           Focus group discussion
NEMA          National Environmental Management Authority
NPHC          National Population and Housing Census
NPA           National Planning Authority
OPM	          Office of the Prime Minister
ReHoPE	       Refugee and Host Population Empowerment
SDG	          Sustainable Development Goal
SPN	          Socially-perceived necessity
SRS	          Self-reliance strategy
UBoS	         Uganda Bureau of Statistics
UDHS	         Uganda Demographic and Health Survey
UNEPI	        Uganda National Expanded Programme on Immunization
UNDP          United National Development Programme
UNICEF	       United Nations Children’s Fund
UNHCR         United Nations High Commissioner for Refugees
UNHS	         Uganda National Household Survey
VHT	          Village health team
WASH          Water sanitation and hygiene

vi     Child Poverty and Deprivation in Refugee-Hosting Areas: Evidence from Uganda
Definitions
Asylum seekers           Individuals in search of international protection and whose claims for
                         refugee status are yet to be determined

Consensual approach to   Deprivation measured in terms of enforced lack of socially-perceived
Poverty measurement      necessities as determined by public opinion

Equality                 Equal rights for all

Food security            A situation that exists when all people, at all times, have physical, social
                         and economic access to sufficient, safe and nutritious food that meets
                         their dietary needs and food preferences for an active and healthy life.

Hosts                    Nationals who live within a 15km radius of the refugee settlement/
                         community

Refugees                 Individuals recognized under the 1951 United Nations Convention
                         relating to the Status of Refugees; its 1967 Protocol; the 1969
                         Organization of the African Union Convention Governing the Specific
                         Aspects of Refugee Problems in Africa; those recognized in accordance
                         with the UNHCR Statute; individuals granted complementary forms
                         of protection; or those enjoying temporary protection. Since 2007, the
                         refugee population also includes people in a refugee-like situation.

Sanitation deprivation   Deprived if there is no latrine/toilet or if toilet facility is unimproved

Self-settled refugees    Refugees who decide not to live in gazetted settlements and in doing so
                         become ineligible for humanitarian assistance

Shelter deprivation      Deprived if unimproved materials are used for the construction of roof,
                         floor, wall or a combination of all

Social equity            Fairness and/or justice in the delivery of social services regardless of
                         economic resources or personal circumstances

Social services          A range of public services provided by government, private, and
                         non-profit organizations aimed at building stronger communities and
                         promoting equality and opportunity for all

Water deprivation        Deprived if source is unimproved, waiting time and/or travel time exceed
                         30 minutes

                                    Child Poverty and Deprivation in Refugee-Hosting Areas: Evidence from Uganda   vii
Executive Summary viii Child Poverty and Deprivation in Refugee-Hosting Areas: Evidence from Uganda
The Sustainable Development Goals (SDGs) set an ambitious agenda for Uganda to improve the lives of
its population. Target 1.2 of SDG 1 specifically requires governments to have reduced by at least half the
proportion of men, women and children of all ages living in poverty by 2030. The target has three explicit
elements: (i) the multidimensional nature of poverty; (ii) the distinct needs of adults and children; and
(iii) national definitions of multidimensional poverty. Along with other countries, Uganda has to develop
valid and reliable indicators that meet all three elements of the target.

In addition to ending poverty, the SDGs also call on countries to: ensure healthy lives and promote well-
being (SDG 3); guarantee inclusive and equitable quality education and promote lifelong learning (SDG
4); ensure the availability and sustainability of clean water and sanitation for all (SDG 6); and promote
peaceful and inclusive societies for sustainable development – including by providing a legal identity for
all and promoting birth registration among children under 5 years of age (SDG 16).

Uganda has traditionally had a generous and progressive refugee policy and hosted refugees from
across East Africa. However, in 2016/17, largely as a result of the crisis in South Sudan, Uganda’s refugee
population almost doubled, reaching 1.38 million.1 Given the recent upheaval in the Democratic Republic
of Congo (DRC), this figure is likely to escalate even further. Between January and February 2018, more
than 40,000 refugees had already entered Uganda2 from the DRC, against a projection of 60,000 in
Uganda’s integrated refugee response plan for 2018.3

This has put refugee-hosting areas, most of which are extremely poor and lack the economic resources
and technical capacity to support the increasing numbers of refugees, under enormous pressure.
Humanitarian efforts have contributed significantly in responding to the emergency and attempts
have been made to build the resilience and livelihoods of both refugee and host communities. Key
interventions aim to support refugees to integrate and become self-reliant, so that their living conditions
are on a par with that of the host population.

This study assessed child poverty, deprivation and social service delivery in refugee and host
communities in selected districts in the country’s three major refugee-hosting areas: West Nile, a sub-
region of Northern region that borders South Sudan; the country’s South West, which borders the DRC
and Rwanda; and the capital, Kampala. The overall aim was to compare child poverty and deprivation
among refugee and host communities, determine whether there are any (in) equities in the delivery
of social services, and identify impediments to the effective delivery of services. Primary data was
obtained from households and communities in the districts of Arua, Yumbe, Adjumani, Kamwenge,
Isingiro and Kampala.

Emerging evidence suggests that:
1. Refugee children are more deprived of socially perceived necessities.
    For all items perceived by the majority of the population to be necessities for children, refugee
    children are more deprived than hosts’ children, ranging from 8 per cent to 32 per cent depending on
    the item. Refugee children are much less likely to receive gifts on special occasions and less likely to
    have new sets of clothes than hosts’ children.

1    https://ugandarefugees.org/category/policy-and-management/refugee-statistics/?r=48
2    https://reliefweb.int/sites/reliefweb.int/files/resources/UNICEF%20Uganda%20Multi-Hazard%20Humanitarian%20Situation%20
     Report%20-%20February%202018....pdf
3    https://ugandarefugees.org/wp-content/uploads/Uganda-I-RRP-2018pdf.pdf

                                              Child Poverty and Deprivation in Refugee-Hosting Areas: Evidence from Uganda    ix
2. Deprivation among refugees tends to reduce over time.
For selected basic indicators (water, sanitation and shelter), recent arrivals are the most deprived.
Within five years of residence, deprivation rates among refugees are on a par with those of hosts,
the reason being that levels of deprivation among host communities are already high. At the time
of the survey, 62 per cent, 46 per cent and 49 per cent of hosts were deprived of water, sanitation
and shelter respectively, while the corresponding proportions for refugees of more than five years’
residence were 69 per cent, 25 per cent and 42 per cent.
3. There are wide regional disparities in deprivations.
While water deprivation is far lower in Kampala than in other refugee hosting areas, West Nile has
the highest levels of sanitation deprivation, with over 80 per cent of host households deprived.
Among refugees, households that have been in Uganda for ‘less than two years’ experience the
highest rates of deprivation. Shelter deprivation is highest in West Nile, with over 80 per cent of all
households – hosts as well as refugees – being deprived.
4. With the exception of West Nile, access to services tends to be similar for both host and refugee communities.
Service delivery shows some differences – but most of these are not necessarily inequitable. Apart
from a concentration of refugee-specific social service interventions in West Nile – which can be
explained partly by the state of emergency there – host and refugee communities in the same area
tend to experience similar social service conditions.
5. There is an urgent need to facilitate integration.
To sustain the lives and livelihoods of refugees and hosts, there is a need to facilitate integration
– not just in the physical sense. This would improve communication between the various parties
and allow for the peaceful sharing of limited resources. At the intervention level, stakeholders
need to go beyond emergency response and build the livelihoods and resilience of recent arrivals
without compromising that of longer-term refugees, while continuing to prioritize poverty reduction
programmes aimed at lifting Ugandans out of poverty.
6. A special focus in refugee-receiving districts is required.
Overall, both refugee and host communities experience a significant level of deprivation, given
that the main refugee-hosting areas are among the poorest and least developed in the country.
Although conditions for refugees improve over time, basic needs deprivation among hosts remains
high – in some cases higher than among refugees (e.g. water and shelter deprivation in West Nile).
Such situations represent important social challenges in terms of growing resentment and potential
conflict between host and refugee communities. Deliberate and targeted efforts to improve service
delivery and the livelihoods of the host community should be explored as a measure to foster long-
term peaceful coexistence.
x Child Poverty and Deprivation in Refugee-Hosting Areas: Evidence from Ugandachapter one
INTRODUCTION
Child Poverty and Deprivation in Refugee-Hosting Areas: Evidence from Uganda 11.1 Background and overview of refugee
hosting in Uganda
Forced migration is an increasing global challenge and understanding how countries are dealing with
people forced to flee their homes is both a humanitarian and an economic priority. During the past 20
years, the global population of forcibly displaced people nearly doubled – from 33.9 million in 1997 to
65.6 million in 2016 (UNHCR, 2017). At least 34 per cent of those displaced ended up as refugees in a
country other than their own, and 15 per cent were displaced recently, during 2016.
Low-income countries are shouldering an increasing burden of hosting refugees, with 28 per cent (4.9
million) of the global number of refugees receiving asylum in least developed countries. Furthermore,
some of the countries that the highest numbers of people have been forced to flee are in sub-Saharan
Africa – notably South Sudan, Burundi, Central African Republic, DRC and Sudan. According to UNCHR,
the number of refugees from South Sudan increased by 85 per cent in 2016 (UNHCR, 2017).
Uganda is ranked among the top five refugee-hosting countries globally and in 2016 became the country
with the most refugees in sub-Saharan Africa.4 Between December 2016 and May 2017, largely as
a result of the crisis in South Sudan, Uganda’s refugee population almost doubled, reaching more
than 1.38 million.5 Given the recent upheaval in the DRC, this figure is likely to escalate even further.
Between January and February 2018, more than 40,000 refugees had already entered Uganda6, from
the Democratic Republic of Congo (DRC),against a projection of 60,000 in Uganda’s integrated refugee
response plan for 2018.7
Figure 1: Trends in refugees and asylum seekers in Uganda (1961–2017)
1,400,000
1,200,000
1,000,000
800,000
600,000
400,000
200,000
0
2011
2015
1961
1971
2013
2017
1963
1965
1967
1969
1973
1975
1977
1979
1981
1985
1983
1987
1991
1989
1995
1993
1997
1999
2005
2007
2001
2003
2009
Source: Based on UNHCR database (1961–2015) and OPM statistics (2016 up to 31 September 2017)
4 http://ec.europa.eu/echo/files/aid/countries/factsheets/uganda_en.pdf
5 https://ugandarefugees.org/category/policy-and-management/refugee-statistics/?r=48
6 https://reliefweb.int/sites/reliefweb.int/files/resources/UNICEF%20Uganda%20Multi-Hazard%20Humanitarian%20Situation%20
Report%20-%20February%202018....pdf
7 https://ugandarefugees.org/wp-content/uploads/Uganda-I-RRP-2018pdf.pdf
2 Child Poverty and Deprivation in Refugee-Hosting Areas: Evidence from UgandaThe high number of refugees in Uganda is partly explained by the country’s traditional hospitality and
its progressive refugee policy. In fact, many international agencies such as UNHCR and the World Bank
have lauded Uganda’s refugee policy as one of the most progressive in the world (World Bank, 2016) and
the 2016 New York Summit on Refugees declared Uganda’s refugee policy a model. From a regulatory
standpoint, Uganda’s 2006 Refugee Act and 2010 Refugee Regulations offer refugees various rights. Key
among these rights are: the allocation of land to each refugee household for residential and agricultural
use; the right to access public social services including education, health, water and sanitation; the right
to engage in income-generating activities and to seek employment; and the right to documentation,
security and protection, and freedom of movement. These rights and entitlements are meant to provide
a pathway for refugees to establish their own livelihoods and attain some level of self-reliance, thereby
becoming progressively less reliant on humanitarian assistance.
However, despite Uganda’s progressive refugee policy, challenges remain. First, access to good-quality
basic services such as health care, education, water, sanitation and shelter is constrained given that
the main refugee-hosting areas are among the poorest and least developed in the country. Second, the
presence of refugees exacerbates existing vulnerabilities and renders the population in refugee-hosting
areas less resilient to economic and environmental shocks (UNDP, 2017).8
Figure 2: Map showing refugee settlements in Uganda (February 2018)
Figure 2: Map showing refugee settlements in Uganda (February 2018)
Moyo Lamwo
Yumbe
Koboko 163,322 37,407 Lamwo Kaabong
4,606
Koboko
287,801
Yumbe
Pagrinya Palabek Kitgum
Lobule WEST NILE
Maracha Amuru
Arua Ajumani Adjumani Pader
Kotido
Gulu
254,858 239,443 ACHOLI Agago
KARAMOJA
Arua Omoro Abim Moroto
Zombo Nwoya
Pakwach Otuke
Nebbi
Oyam Kole Napak
Lira Alebtong
Kiryandongo
57,639 LANGO
Amuria
Bulisa
Kiryandongo
Dokolo TESO Katakwi
Apac Nakapiripirit
Kaberamaido Soroti
Masindi
BUNYORO Amolatar
Hoima Serere
Ngora
Kumi Bulambuli
64,089
Kween
Nakasongola Bukedea Kapchorwa SEBEI
Kyangwali Buyende
Bukwo
Pallisa Butebo
Sironko
Kyankwanzi Nakaseke BUKEDI Budaka
Kaliro Kibuku
Ntoroko Kagadi Manafwa Bududa
Kakumiro
Butaleja BUGISUMbale
Kamuli
Kibaale Kiboga Luwero Kayunga BUSOGA Namatumba
Bundibugyo
Luuka Tororo
Iganga
Kyenjojo
Kabarole Mubende
Kyegegwa
TOORO Kyegegwa Mityana
Jinja
Bugiri
Busia
Refugee settlements
KAMPALA
Rwamwanja
43,930 BUGANDA Buikwe
Mayuge
Refugee numbers - Feb 2018 by country of origin
Kamwenge Kyaka II (Pie chart size varied nby refugee population
Kasese 77,035 Gomba
Wakiso
Kamwenge Butambala
RWENZORI
Ibanda
Sembabule
Bukomansimbi Mpigi
Mukono
74,000
Kalungu Namayingo
Kiruhura Lyantonde
Rubirizi
Buhweju Buvuma
Burundi
Lwengo
Bushenyi Mbarara Masaka Democratic Republic of Congo
ANKOLE Isingiro Kalangala
Mitooma
Sheema
111,049 Rakai Rwanda
Rukungiri
Kanungu Isingiro Somalia
Ntungamo
Oruchinga
South Sudan
KIGEZI
Kisoro
Other nationalities
Kabale
Source: UNHCR, September 2017
8 https://reliefweb.int/sites/reliefweb.int/files/resources/UNDPUg2017%2520-%2520UNDP%2520Emergency%2520Response%2520%26%
2520Resilience%2520Strategy%25202017%5B1%5D.pdf
Child Poverty and Deprivation in Refugee-Hosting Areas: Evidence from Uganda 3Refugees in Uganda are hosted in 11 districts and in over 30 settlements located in some of the poorest
areas of the country (Figure 2).9 Currently, 70 per cent are hosted in four districts in the West Nile sub-
region – Yumbe, Adjumani, Arua and Moyo – one of the least developed areas of Uganda. The presence
of refugees in such areas, where host communities have limited social capital, less diverse livelihoods
and low levels of assets (OPM, 2016), further undermines coping abilities. According to the 2016/17
Uganda National Household Survey (UNHS), communities in West Nile are most likely to report that
living conditions have worsened during the past three years (90%) compared with non-refugee-hosting
districts (UBoS, 2017). The same survey also shows that a high proportion of children from West Nile are
unable to afford school fees, uniforms and other school equipment (90%) and are deprived of access
to health facilities (77%). In addition, children in West Nile are second only to those in Karamoja in
being deprived of two sets of clothing (UBoS, 2017). These items are all considered essential, or to be
socially-perceived necessities (SPNs), by the majority of Ugandans today and therefore fall within the
consensual definition of poverty.
This study provides evidence on the situation and vulnerability of refugees in Uganda, including urban
refugees in Kampala, and that of host communities in the main refugee-hosting regions. It identifies the
determinants of social service sufficiency, and provides practical recommendations on how to manage
social service delivery equitably for both refugees and host communities. It is the first attempt to
compare child poverty and deprivation between host and refugee communities in the country. Globally,
it represents the first application of the consensual approach to poverty in emergency situations.
Key objectives:
Determine and compare child
poverty and deprivation among
refugees and hosts
Document inequities and/
or equities in access and
outcomes related to social
services
Identify barriers to service
delivery
Provide recommendations to
inform policies and interventions
aimed at supporting the
sustainable delivery of basic
services to refugees and host
populations
Recently arrived refugee children from
South Sudan playing in Bidi bidi Refugee
Settlement in Yumbe district
9 Arua, Adjumani, Yumbe, Lamwo, Isingiro, Kamwenge, Kyegegwa, Hoima, Kiryandongo, Kampala, Moyo
4 Child Poverty and Deprivation in Refugee-Hosting Areas: Evidence from UgandaDavid (right) makes a clay
model at the Early Childhood
Development Centre in
Nyumanzi refugee settlement,
Adjumani district
1.2 Trends and demographic
characteristics of refugees and asylum
seekers
While Uganda’s rigorous involvement with refugees dates back to the 1960s, the recent influx (starting
in mid-2016) has been the greatest the country has ever experienced (Figure 1). In fact, for the first
time in Uganda’s history, the number of refugees has crossed the 1 million mark and in some districts
there are now more refugees than host population. For example, in Adjumani and Moyo districts, the
refugee population accounts for about 59 per cent and 56 per cent of the total population respectively
(Figure 3). As at 31 September 2017, refugees from South Sudan made up 75 per cent of the refugee
population, the remainder consisting of refugees from other countries, mainly the DRC and to a lesser
extent Burundi, Somalia, Rwanda, Eritrea, Ethiopia and others (Figure 3). The proportion of refugees
from the DRC increased in the early months of 2018, and is expected to rise.
Unlike in many other countries where refugees are hosted in camps and have limited rights, refugees
in Uganda are hosted in settlements where, as well as having equal rights to services as Ugandan
nationals, they are provided with basic assistance such as land, food and non-food items. Due to the
dramatic rise in the number of refugees from South Sudan, new settlements have been set up since
July 2016. Bidi Bidi settlement in Yumbe district, which opened in August 2016, has become the biggest
refugee settlement not only in Uganda or Africa but in the world. Other new settlements are located
in Lamwo and Moyo.10 Asylum seekers in Kampala are not housed in settlements. They are defined as
‘self-settled’ and have to rely on themselves or relatives for support.
10 Uganda emergency update on the South Sudan refugee situation (July 2016) https://data2.unhcr.org/en/documents/download/49536
Child Poverty and Deprivation in Refugee-Hosting Areas: Evidence from Uganda 5Figure 3: Refugee summary statistics (2017)
Refugee population by settlement Refugee population by country of origin (%)
300,000
200,000 17.1%
74.9%
100,000
0 South Sudan DR Congo
Yumbe
Adjumani
Arua
Moyo
Nakivale
Kampala
Rwamwanja
Kiryandongo
Kyangwali
Lamwo
Kyaka II
Oruchinga Somalia
Burundi
Rwanda Others
Refugee population by age Refugee versus host population (%)
800,000 100%
80%
600,000
60%
400,000
40%
200,000
20%
0 0
Adjumani
Moyo
Yumbe
Arua
Lamwo
Isingiro
Kiryandongo
Kamwengye
Kyegegwa
Kampala
0-4 5-11 12-17 18-59 60+ Total
Females Males
Host Refugee
Source: Based on OPM statistics as of September 30th 2017
Where refugees settle is influenced by various factors: the availability of land; the area’s proximity to
the refugees’ country of origin; and ethnic similarity between refugees and the local population (Orach
and De Bronwere, 2005). For instance, most refugees from South Sudan have been settled in West
Nile among similar ethnic groups (Lugbra, Kakwa and Madi), while those from the DRC, Rwanda and
Burundi, who belong to the Bantu ethnic group, have been settled among the Bantu people in South
West.
As far as age and gender disaggregation of refugees is concerned, the majority (60%) are children
(below 18 years of age) and more than half are women (Figure 3). The high presence of children among
the refuge population implies that there is a massive demand for critical health services, clean water,
education, food, shelter and other support to help them survive and enjoy their rights as children.
6 Child Poverty and Deprivation in Refugee-Hosting Areas: Evidence from Uganda1.3 Policy framework for refugee hosting in
Uganda
The 2006 National Refugee Act and the 2010 Refugee Regulations introduced to operationalize the 2006
Act are the two major regulatory frameworks that guide the settlement of refugees in Uganda. As noted
earlier, this legal framework provides refugees with, among other things, the right to documentation
(e.g. identity cards, birth certificates, death certificates, etc.), the same rights as Ugandan nationals to
access social services such as health, water and sanitation and education, the right to land for agricultural
use and shelter, the right to work (start a business or seek employment), freedom of movement, the
right to receive fair justice, and the principle of family unity.
Due to the protracted nature of refugee situations in Uganda, a number of interventions had been
implemented prior to the 2006 Refugee Act. Key among these is the self-reliance strategy (SRS) that
was initiated in 1998 to integrate services for refugees and host communities and promote self-reliance
among both communities in the long term. Prior to the SRS, services in the refugee settlements were
run in parallel to those of the host community. Since the refugee community was receiving substantial
humanitarian aid, their services were perceived as better, which compromised harmony between the
two communities (World Bank, 2016).
Other key strategies that have subsequently been implemented by the Government in collaboration
with partners include the Development Assistance to Refugee-Hosting Areas programme, Refugee
Settlement Transformative Agenda, Refugee and Host Population Empowerment (ReHoPE) Strategic
Framework and, more recently, the Comprehensive Refugee Response Framework (CRRF). These
programmes are aimed at strengthening the resilience and self-reliance of host communities and
refugees through multisector and coordinated interventions that involve both refugees and the host
communities. As per the ReHoPE framework, refugees who have been in Uganda for more than five
years are assumed to be self-sufficient in terms of food and other basic needs and are thus not eligible
for assistance unless they fall into the categories of persons with special needs.
Worth noting is the fact that the current National Development Plan (NDP II) includes a Refugee Settlement
Transformative Agenda, which provides for the expansion of services such as health, education, water
and sanitation for refugees and refugee-hosting areas in addition to reviewing domestic laws governing
refugees and receiving/granting asylum to refugees.
Child Poverty and Deprivation in Refugee-Hosting Areas: Evidence from Uganda 7Stages of refugee settlement in Uganda
The standard process of securing refugee status in Uganda involves
three stages: i) the entry phase; ii) the settlement phase; and iii) the
integration phase.
For prima facie refugees (currently from
South Sudan and the DRC), the process is
1 quite straightforward. They are received into
reception and transit centres where they
spend two to three days, during which they
are screened, registered and provided with
food rations and non-food items.
Thereafter the household is allocated
a piece of land for settlement and in
some cases an extra piece of land for
agricultural purposes.
2
During the last phase, through the local
3 integration policy the refugees have access to
social services such as education, health, water,
agricultural extension services and security.
Note: If prima facie refugee status is not granted, a fact sheet is generated
for each asylum seeker and used by the Refugee Eligibility Council in Kampala
or its sub-committees within the settlements to grant or deny refugee status.
Where refugee status is denied, an asylum seeker remains ineligible for
humanitarian assistance
Refugees who choose not to settle in designated refugee settlements (self-
settled refugees in urban areas) are not granted agricultural land and are not
entitled to monthly food rations or cash grants.
Source: Authors’ compilation based on interviews with refugee settlement commandants
8 Child Poverty and Deprivation in Refugee-Hosting Areas: Evidence from UgandaSouth Sudanese refugee
children at a transit camp near
the Busia border
1.4 Extent of vulnerability in refugee and
host communities
While Uganda’s legal framework for refugee settlement is comprehensive, effective implementation
and enforcement of the regulations is ineffective and inadequate, mainly due to underlying poverty and
vulnerabilities (World Bank, 2016). In this sub-section, we profile the extent of vulnerability in refugee
and host districts11 based on the 2014 NPHC and UNHS 2016/17. The focus is on indicators such as food
insecurity, schooling status, access to water and sanitation, teenage pregnancies and orphan status.
Food security: Food insecurity status is determined by household consumption of the minimum number
of meals a day (NPA, 2017; International Phased Classification, 2017). Based on the 2014 NPHC, most
refugee households consume less than two meals per day (Figure 4).
In particular, households located in the refugee settlements in South West (e.g. Nakivale, Oruchinga
and Rwamwanja districts) reported higher percentages of households consuming less than two meals
a day. The proportions range from 30 per cent in Nakivale to about 10 per cent in Kyangwali.
It is also worth noting that at the time of the Census, host community households from Adjumani
district had a slightly higher prevalence of food insecurity than the refugee households. Previous reports
indicate that food insecurity is linked to the inability of refugees to produce their own food, inadequate
food rations, and inadequate income to purchase food from available markets (OPM et al., 2014).
Nonetheless, the relatively lower rate of food insecurity in West Nile settlements shown in Figure 4
should be interpreted in the context of when the census was carried out – in August 2014. At that time,
the number of refugees in Adjumani and Arua was 78,435 and 11,311 respectively.12 As indicated in
Figure 2, by February 2018 the refugee population had increased by more than 200 per cent in Adjumani
to 239,443 and by more than 18 fold in Arua to 254,858. As such, it is possible that the food security
situation of both refugees and host communities may have worsened.
11 We use host district rather than immediate host community due to data constraints.
12 UNHCR Operational Update for the South Sudanese emergency 6-12 August 2014
Child Poverty and Deprivation in Refugee-Hosting Areas: Evidence from Uganda 9Figure 4: Households having less than two meals a day by settlement (%)
40% Refugee community
Host district
30%
29
Percentage (%)
24
20% 22
18 19 14
12
14 14
10% 11 11 10
8 7 6 6
0
le R
S RS RS
a II
RS RS al i * ma
ni *
A ru
a*
i va hi n ga a n ja k on go gw u
N ak r uc a mw Kya y an d Kya
n A dj
O Rw K ir
Source: UBoS (2016b); NPHC 2014: Sub-county profile reports
* For West Nile, the refugee community refers to the sub-county hosting refugees and not the refugee settlement per se.
Education: Although the 2006 Refugee Act entitles asylum seekers to access education – including
through the universal primary education programme – a large proportion of children of primary school-
going age remain out of school. Figure 5 shows the results from the 2014 NPHC, which indicate that
in two settlements – Nakivale and Kyaka II – more than 30 per cent of children aged 6–12 years are out
of school. However, as Figure 5 shows, in some settlements – Kiryadongo, Adjumani and Arua – host
communities have lower school attendance rates than their refugee counterparts. Based on the UNHS
2016/17, across Uganda the two most cited reasons for children aged 6–12 years being out of school
are being too young (43.2%) and parental indifference (e.g. ‘parent did not want’) (19.1%) (UBoS, 2017).
Furthermore, there are wide gender differences in the reasons given for school non-attendance – for
instance, a higher proportion of females cite being too young (55.3%) compared to males (34.9%). The
second most cited reason, parental indifference, is three times more likely to be cited for boys (26.6%)
than girls (8.0%). On the other hand, a similar proportion (14%) of boys and girls cite expensive costs of
schooling as the reason for not attending school.
Figure 5: Proportion (%) of children aged 6–12 years who are out of school
Figure 5: Proportion (%) of children aged 6–12 years who are out of school
40% Refugee community
Host district
34
30% 31
Percentage (%)
21
20%
17
16 16 17
14 15
10% 13 13
10
9
7
0
RS aR
S I RS RS al i * an i
*
A ru
a*
v al e ing ka I ngo ng w um
N ak
i ch Kya y an
do Kya A dj
Or u K ir
Source: Based on 2014 NPHC sub county reports, UBoS
10 Child Poverty and Deprivation in Refugee-Hosting Areas: Evidence from UgandaWater and sanitation: Access to safe water and sanitation reduces morbidity and mortality and enhances
the quality of life. Also, evidence shows that walking long distances and queuing for a long time at
water points is associated with high social costs in the form of lost opportunities for productive work
(UNHCR, 2014). As Figure 6 shows, in 2014 refugees were more likely to use protected sources for
fetching drinking water than host communities in five refugee settlements. These results may in part
be explained by the ease with which water infrastructure can be established for settlements compared
with geographically dispersed host populations.
Figure 6: Percentage of households using a protected source for drinking water
Figure 6: Percentage of households using a protected source for drinking water13
100 %
99 100
95
91
88
80% 81
67
Percentage (%)
60%
53
40%
33 33 33
26
20% 24
21
17
0
Nakivale RS Oruchinga RS Rwamwanja RS Kyaka II RS Kiryandongo RS
Refugee community Host community Host district
Source: Based on 2014 NPHC sub-county reports, UBoS
Safe excreta disposal is an essential element of any WASH programme as it reduces the potential
contamination of water, food or hands.14 It also guarantees privacy and reinforces human dignity.
Compared with hosts, refugees are less likely to have a toilet facility. In some settlements such as
Kiryandongo and Rwamwanja, the proportion of households without any toilet facility is as high as 28.5
per cent and 14.9 per cent respectively (see Table 1). Unlike water infrastructure that is mostly provided
by NGOs and government, the setting up of toilet facilities is largely initiated by households.
13 Protected water sources include piped water, public taps, boreholes, protected well springs and tanker trucks unprotected water
sources include water drawn from unprotected wellsprings and open water sources like rivers, streams and lakes
14 http://www.who.int/water_sanitation_health/hygiene/settings/hvchap4.pdf?ua=1
Child Poverty and Deprivation in Refugee-Hosting Areas: Evidence from Uganda 11Table 1: Type of toilet facility (%)15
Refugee community Host district
Improved Un-improved No Toilet Improved Un-improved No Toilet
Nakivale 20.6 73.0 6.5 15.7 80.8 3.6
Oruchinga 35.8 58.3 5.9 15.7 80.8 3.6
Rwamwanja 12.2 72.9 14.9 19.3 77.9 2.8
Kyaka II 48.1 42.6 9.3 15.7 80.7 3.7
Kiryandongo 32.2 39.3 28.5 16.9 69.2 13.9
Source: Based on 2014 NPHC sub county reports, UBoS
Marriage and fertility choices: Teenage pregnancy obstructs girls’ education and places both the young
mother and her child at increased risk of sickness and death. On average, children in Nakivale (aged
12–17 years) from refugee households were more likely to have started child bearing than children of
the same age range in the host community. The opposite is true in Kiryandongo (Table 2).
Despite the existence of a law banning marriage before the age of 18, cases of child marriage still exist.
Child marriage leads to lower educational attainment for girls and their children, higher population growth,
substantial health risks, higher intimate partner violence, lower earnings for women and higher levels
of poverty (World Bank, 2017). The reasons for child marriages are rooted in discriminative traditional
and social norms, as well as factors such as poverty, and biases against girls’ education (Ahaibwe et
al., 2017). Apart from Nakivale refugee settlement, hosts reported higher levels of early marriage than
refugees.
Table 2: Extent of marriage, pregnancy and orphanhood among children
Refugee community Host district
Ever Married Ever had a birth Orphan hood Ever Married Ever had a birth Orphan hood
Nakivale 9.1 17.4 12.4 7.0 10.7 8.1
Oruchinga 6.8 9.1 19.4 7.0 10.7 8.1
Kyaka II 5.0 9.3 15.3 8.0 9.3 8.1
Kiryandongo 5.9 6.9 18.7 10.6 11.1 8.1
Source: Based on 2014 NPHC sub county reports, UBoS
Orphanhood: Traditionally in Uganda, communities and relatives tend to absorb orphaned children into
the extended family. However, given that more than one-fifth (21.4%) of the population lives in poverty
(UBoS, 2017), many households are already overburdened and often lack the capacity to support these
children. The situation is worse among displaced people such as refugees because some children are
likely to have lost their parents during times of conflict. As Table 2 shows, children born to refugees are
nearly twice as likely as their hosts to be orphaned. If not supported, these children are likely to end up
on the streets or be engaged in exploitative work as means of survival.
15 Improved toilet facilities include flush toilet, VIP latrine, covered pit latrine with a slab, ecosan composite toilets while unimproved
toilet facilities include covered pit latrine without a slab, uncovered pit latrine with a slab, uncovered pit latrine without a slab and
where there is no facility e.g. open defecation, polythene, bags, buckets etc.
12 Child Poverty and Deprivation in Refugee-Hosting Areas: Evidence from Ugandachapter two
METHODOLOGY
Child Poverty and Deprivation in Refugee-Hosting Areas: Evidence from Uganda 13The first Sustainable Development Goal (SDG), and target 1.2 specifically, requires governments to
report on poverty in all its dimensions, for men, women and children of all ages, according to national
definitions. The target has three explicit elements, for each of which a reliable and successful indicator
must reflect: (i) the multidimensional nature of poverty; (ii) the distinct needs of adults and children;
and (iii) national definitions of multidimensional poverty. Countries have to develop valid and reliable
indicators that meet all three elements of the target meaningfully.
The analytical approach used in this report to measure child poverty and deprivation is commonly
referred to as the consensual approach. Based on the work of Peter Townsend (1987) and others (Mack
and Lansley, 1985; Gordon and Pantazis, 1997), the approach enables researchers to develop socially-
realistic indicators of multidimensional deprivation and poverty that are of relevance to men, women and
children of all ages and reflect national definitions of poverty. The approach has been used successfully
in high-, medium- and low-income countries around the world (Guio et al., 2016; Gordon and Nandy,
2016; Abe and Pantazis, 2013; Noble et al., 2004), and has attracted growing interest from countries
intending to report on progress towards SDG 1.2.
In essence, the consensual approach asks a representative sample of a country’s population whether
they consider items/activities from a predetermined list to be either essential or desirable, or neither,
for people to have an acceptable standard of living. A follow-up question is then asked of respondents
to ascertain whether they themselves have/do the item/activity, or do not have/do the item/activity. If
respondents report not having an item, they are then asked if this is because they do not want it or
(importantly) if because they cannot afford it. This final question establishes whether the lack of an
item is enforced (i.e. a lack due to insufficient resources) or simply the result of choice. Items/activities
that a majority of respondents (>50%) consider ‘essential’ are thus identified as ‘socially-perceived
necessities’ (SPNs). Separate lists of items/activities can be used to reflect the distinctive needs of
children and adults (Noble et al., 2006), and households for whom there is an enforced lack of SPNs can
be said to be deprived (see Figure 7).
Figure 7: Ascertaining enforced lack of socially perceived essentials of life/necessities
Figure 7: Ascertaining enforced lack of socially perceived essentials of life/necessities
Is it essential? Do you have it?
Yes No Yes No
Is this because
you cannot afford it?
The essentials of life Yes No
DEPRIVATION
Source: Adopted from Saunders, P. (2011)
14 Child Poverty and Deprivation in Refugee-Hosting Areas: Evidence from UgandaYou can also read


