A National Minimum Wage for South Africa - Gilad Isaacs July 2016 - NATIONAL MINIMUM WAGE RESEARCH INITIATIVE
←
→
Page content transcription
If your browser does not render page correctly, please read the page content below

CSID - School of Economics and Business Sciences

A National Minimum Wage
for South Africa
Gilad Isaacs ┃ July 2016

NATIONAL MINIMUM WAGE RESEARCH INITIATIVE

SUMMARY REPORT 1

University of the Witwatersrand
www.nationalminimumwage.co.za

       A National Minimum Wage for South Africa

                          Gilad Isaacs
                  University of the Witwatersrand
                   SOAS, University of London
                             July 2016

NATIONAL MINIMUM WAGE RESEARCH INITAITIVE
Summary Report No. 1
www.nationalminimumwage.co.za

With thanks to:


                               i

The National Minimum Wage Research Initiative (NMW-RI) is an independent academic
research project run by the Corporate Strategy and Industrial Development (CSID)
Research Unit in the School of Economic and Business Sciences (SEBS) at the University
of the Witwatersrand. It is undertaken in the context of a national dialogue on wage
inequality and the potential introduction of a national minimum wage in South Africa.
Information on the NMW-RI can be found at www.nationalminimumwage.co.za.

The NMW-RI has benefitted from the insight and expertise of our Oversight Committee
made up of local and international experts, as well as labour and civil society leaders
who originally suggested the research. The Oversight Committee members are:

       •   Basani Baloyi – SOAS, University of London
       •   Dr Patrick Belser – International Labour Organisation
       •   Dr Neo Bodibe – National Union of Metalworkers
       •   Neil Coleman – Congress of South African Trade Unions
       •   Yoliswa Dwane – Equal Education
       •   Professor Ben Fine – SOAS, University of London
       •   Isobel Frye – Studies in Poverty and Inequality
       •   Professor Carlos Salas Paéz – Universidade Estadual de Campinas
       •   Dennis George – Federations of Unions of South Africa
       •   Prof Hansjörg Herr – Berlin School of Economics
       •   Dr Erika Kraemer-Mbula – Tshwane University of Technology
       •   Prof Christopher Malikane – University of the Witwatersrand
       •   Professor Robert Pollin – University of Massachusetts, Amherst
       •   Dr Nicolas Pons-Vignon – University of the Witwatersrand
       •   Professor Imraan Valodia – University of the Witwatersrand
       •   Dr Robert van Niekerk – Rhodes University

For their on-going support, the NMW-RI would also like to thank:
    • Professor Jannie Rossouw – Head of School of the School of Economic and
        Business Sciences, University of the Witwatersrand;
    • Professor Imraan Valodia – Dean of the Faculty of Commerce, Law and
        Management, University of the Witwatersrand;
    • Those who generously provided funding: Friedrich-Ebert-Stiftung (FES) South
        Africa, Oxfam GB in South Africa, LO-Norway, and the PERSA research project.
    • The staff of the School of Economic and Business Sciences, University of the
        Witwatersrand;
    • Our research team.


                                           ii
This summary report draws, in part, on a series of working papers commissioned by the
National Minimum Wage Research Initiative:

Adelzadeh, A. and Alvillar, C., 2016. The impact of a national minimum wage on the
    South Africa economy. University of the Witwatersrand, National Minimum Wage
    Research Initiative, Working Paper Series No. 2.
Finn, A., 2015. A national minimum wage in the context of the South Africa labour
    market. University of the Witwatersrand, National Minimum Wage Research
    Initiative, Working Paper Series No. 1.
Mudronova, J., 2015. The international experience of the relationship between
   inequality, poverty and the minimum wage. University of the Witwatersrand,
   National Minimum Wage Research Initiative, Working Paper Series No. 3.
Storm, S. and Isaacs, G., 2016. Modelling the impact of a national minimum wage in
    South Africa: Are general equilibrium models fit for purpose? University of the
    Witwatersrand, National Minimum Wage Research Initiative, Working Paper Series
    No. 5.
Strauss, I. and Isaacs, G., forthcoming. Labour compensation growth in the South African
     economy: assessing its impact through the labour share using the Global Policy
     Model. University of the Witwatersrand, National Minimum Wage Research
     Initiative, Working Paper Series No. 4.
Takala-Greenish, L. and Sipula, M., forthcoming. Minimum Wages and Employment: A
    review of recent debates and evidence. University of the Witwatersrand, Working
    Paper No. 3.

This report is complemented by another Research Summary focusing on the policy
dimensions of the Initiative’s work: Policy Considerations for the Design and
Implementation of a National Minimum Wage for South Africa by Ruth Castel-Branco.

The author would like to thank the following people who have provided comments on
early drafts of this report or the individual working papers:

       •   Dr Asghar Adelzadeh – Advanced Research Development Solutions
       •   Dr Patrick Belser – International Labour Organization
       •   Jeronim Capaldo – International Labour Organization
       •   Neil Coleman – Congress of South African Trade Unions
       •   Dr Ourania Dimakou – SOAS, University of London
       •   Professor Ben Fine – SOAS, University of London
       •   Dr James Heinz – University of Massachusetts, Amherst
       •   Professor Alan Manning – London School of Economics
       •   Professor Robert Pollin – University of Massachusetts, Amherst
       •   Dr Uma Rani – International Labour Organisation
       •   Professor Servaas Storm – Delft University of Technology

For copy-editing and design thanks to: Jesse Harber, Helen Isaacs, Fix Mthembu, and
Helen Philippou.

Minor corrections were made to this report in August 2016 due to incorrect percentages
given on page iii and a rounding error on page 54, no material aspects of the analysis are
affected.


                                          iii

Executive summary
       “We need to ensure that the benefits of growth are more equitably shared. We need to
       confront poverty and inequality … We need to examine and understand income inequality,
       and develop measures to reduce it. Among other things, we need to examine the value and
       possible challenges of implementing a national minimum wage.”

                        - Address by Deputy President Cyril Ramaphosa at the 19th Nedlac
                        Annual Summit, 5 September 2014

The Ekurhuleni Declaration on 4 November 2014 brought to the fore the long-standing
issue of a national minimum wage in South Africa. Since then, this issue has elicited
great debate. This report investigates the viability of instituting a national minimum wage
in South Africa, drawing on a series of working papers commissioned by the National
Minimum Wage Research Initiative at the University of the Witwatersrand. It
contextualises the debate within an understanding of the South African labour market
and current minimum wage system (Sections 2 and 3) and reviews the available local
and international evidence regarding the potential consequences of a national minimum
wage (Sections 4 and 5). Centrally, it employs economic modelling using the United
Nations’ Global Policy Model and the Dynamically Integrated Macro-Micro Economic
Simulation Model (DIMMSIM) developed by Applied Development Research Solutions
(ADRS) to project the likely effects that a national minimum wage will have in South
Africa (Section 6).

Minimum wages establish wage floors below which no employers are permitted to pay
the employees covered. According to the International Labour Organization (ILO), the
purpose of minimum wages is to ensure wages are able to cover the basic needs of
workers and their families, taking into account relevant economic factors. A national
minimum wage sets a single economy-wide wage floor. In South Africa, a national
minimum wage is also being explored as a tool to reduce inequality and transform the
inherited apartheid wage structure.

Such a national wage floor would be an advance over the current sectorally-set minima
in South Africa. Compared with a sectorally-differentiated system, a national minimum
wage covers all workers, is easier to enforce, and does not set lower minima for sectors
with high proportions of vulnerable workers (as has been shown to occur under
differentiated systems). Further, a national minimum wage can be set to take account of
broad policy objectives such as reducing inequality, and economy-wide economic
impacts rather than only narrow sectoral considerations.

This report shows that a national minimum wage in South Africa, if set at an appropriate
and meaningful level, can achieve its central objectives of reducing working poverty and
inequality. As the ILO insists, economic factors must also be considered. This report
shows that a national minimum wage can also support economic growth. Minimum
wages do not aim to raise employment levels – for that, other policies are needed – but a
national minimum wage can be implemented without significant employment effects.
These findings are supported by an extensive international literature, showing the
success of minimum wages in reducing poverty and inequality without negative
employment impacts, and by the statistical modelling undertaken for South Africa itself.
This evidence confirms the logical assumption that firms and the economy adjust to
higher wage costs through a variety of mechanisms and that higher wages – particularly

                                              ii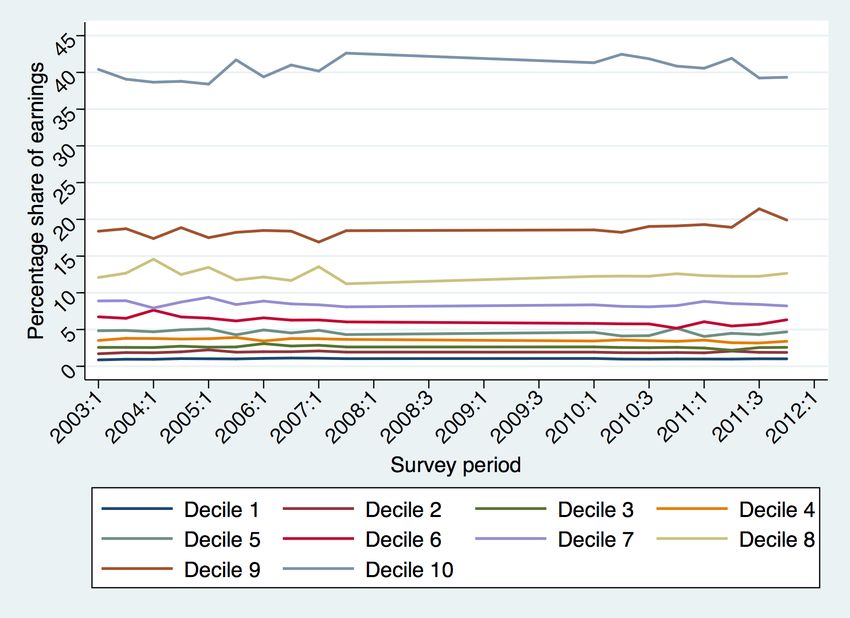
for low-income households – can spur a positive growth- and output-enhancing demand
stimulus.

South Africa has the highest level of inequality in the world (see Section 2); in 2014, the
average income of the top 10% of full-time employees was 82 times the average income
of the bottom 10%. Inequality in South Africa is driven by wage differentials. There is a
growing international consensus, led by the IMF, World Bank, and OECD, that
inequality retards economic growth. Inequality also undermines social cohesion.
Working poverty is also dire in South Africa: 54% of full-time employees – 5.5 million
workers – earn below the working-poor line of R4 125, and so cannot meet the most
basic needs of themselves and their dependents (see Section 2.3). High dependency
ratios mean wages in South Africa stretch to cover many dependents. Higher wages for
low-wage workers would benefit both the employed and the unemployed.

Collective bargaining, covering approximately 32% of lower-wage workers, has
managed to maintain wage levels but is unable on its own to combat working poverty.
Sectorally-set minimum wages, enacted via eight sectoral determinations, cover
approximately 46% of lower-wage workers. Since their institution the levels of the
sectoral determinations have increased by between 16% and 81% in real terms (see
Section 3.1). However, many workers in these sectors still earn exceptionally low wages:
75% of agricultural workers earn below R2 600, 90% of domestic workers below R3
120 (see Section 2.4).

Minimum wages have been successful at raising wages for low-wage earners in both
developed and developing countries (see Section 4). In Latin America, a 10% increase in
minimum wages led to an increase in average wages of between 3% and 6%, with low-
wage workers benefiting disproportionately. In South Africa, minimum wages of
between approximately R3 500 and R5 500 would raise average wages over ten years,
in real terms, by between 21% and 38%. Without a national minimum wage, average
wages, in 2010 rands over our forecast period (2016-2025), are projected to be R7 814.
With national minimum wage levels beginning at approximately R3 500 and R4 600,
average wages would rise to R9 462 and R10 781, respectively. Wages for low-wage
workers are disproportionately boosted (see Section 6.2.5).

The result would be a rise in household income, particularly for low-wage workers, with
the household-income growth rate potentially doubling, thus spurring greater consumer
spending and hence increased output and raised levels of growth, together with rising
productivity. There is a growing body of literature – particularly from OECD countries –
that establishes the aggregate demand, productivity, and growth enhancing nature of
minimum wages (see Section 5.4). In South Africa, the level of economy-wide output
would be 2.1% higher with a national minimum wage (beginning at levels between R3
500 and R4 600) and the average GDP growth rate is projected to be 2.8%-2.9% instead
of 2.4% without a national minimum wage (see Section 6.2.5).

Minimum wages have directly reduced inequality in the formal and informal sectors
across Latin America, and in Indonesia, Russia, China, India and Europe (see Section 3).
The South African statistical modelling projects a fall in the Gini coefficient in South
Africa (see Section 6.2.5). Raising the coverage or level of minimum wages can also
cause a shift in income from capital towards labour and this is also shown to be
beneficial to the overall South African economy (see Section 6.2). Given that poverty
lines and minimum wages are close together, rising minimum wages have also reduced
poverty in almost all developing countries studied (see Section 4.2.3); in Thailand and

                                            iii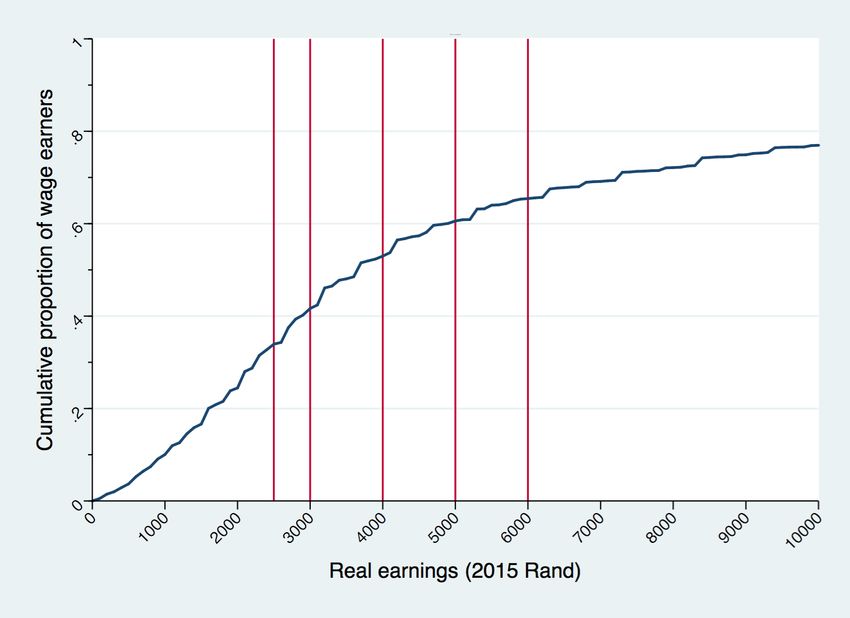
the Philippines, for example, a 1% increase in the minimum wage has been shown to
reduce poverty by 0.5%. In South Africa, the poverty headcount is projected to fall by
around 2%; the decline is greatest for black South Africans (see Section 6.2.5).

In the international literature, the aggregate effect on employment is marginally negative
or neutral, and often statistically undetectable. As Schmidtt (2013, p. 2) notes: “The
weight of that evidence points to little or no employment response to modest increases
in the minimum wage.” This is confirmed in our review of the seven most recent meta-
analyses (studies synthesising the large body of existing empirical research) (see Section
5.1). A 10% rise in minimum wages, where there is an effect at all, leads to somewhere
between a 0.003% and 0.7% fall in aggregate employment (the effect, of course, varies
across country, population group, industry etc., as discussed in Section 5.2). In South
Africa, minimum wages have been shown to have no significant impact on employment
in five of the six sectors studied; agriculture is the exception (see Section 5.3). The results
from the South African statistical modelling are in line with local and international
research: employment is projected to be up to 0.3% lower with the institution of a
national minimum wage (see Section 6.2.5). Our statistical modelling differs from other
common models used, in that raising wages, in our models, may lead to either a positive
or negative outcome as is observed in practice; previous South African studies have used
a family of models in which economic deterioration is the only possible outcome from
minimum wages (see Section 6.1).

The modest effects on employment are because firms and economies adjust to higher
minimum wages in a number of ways (see Section 5.4). The most important channels of
adjustment are productivity increases due to organisational efficiency and increased
effort by workers (‘efficiency wages’), reductions in wages of higher earners (wage
compression), and small price increases. In addition, the boost to aggregate demand
from higher wages counteracts negative pressures on employment levels; while raising
wages may place pressure on individual businesses it can be beneficial to businesses
overall. The level at which the national minimum wage is set will strongly influence the
manner in which firms and the economy adjust.

We explore three benchmarks for guiding the setting of the national minimum wage:
average wages, existing collective bargaining agreements, and poverty lines (see Section
0). In middle-income countries minimum wages are on average set at 48% of the
average wage; this translates into R4 161 (in April 2015 rands) in South Africa. In 2015,
the weighted average minimum wage for private-sector bargaining councils was R4 355,
and for public- and private-sector bargaining councils R5 747. In April 2015 a family of
four required R5 276 to meet their most basic needs and not live in poverty; the
working-poverty line was R4 125 (based on an analysis of dependency ratios and
multiple income sources). The relevant indicators therefore cluster between R4 000 and
R5 500. This range is similar to our two ‘indexation’ scenarios modelled in which the
national minimum wage begins at levels between R3 500 and R4 600 reaching
approximately R3 900 and R5 100 after five years; a national minimum wage set at these
levels is shown to be both positive and sustainable.

The national minimum wage policy must be carefully designed (see Castel-Branco 2016)
and the wage set at a level that is able meaningfully to improve workers’ livelihoods
with sustainable ramifications for the wider economy. It can reduce poverty and
inequality, while boosting economic growth, without significant negative economic
consequences. This report shows that this has been achieved in other countries and can
be emulated in South Africa.


                                              iv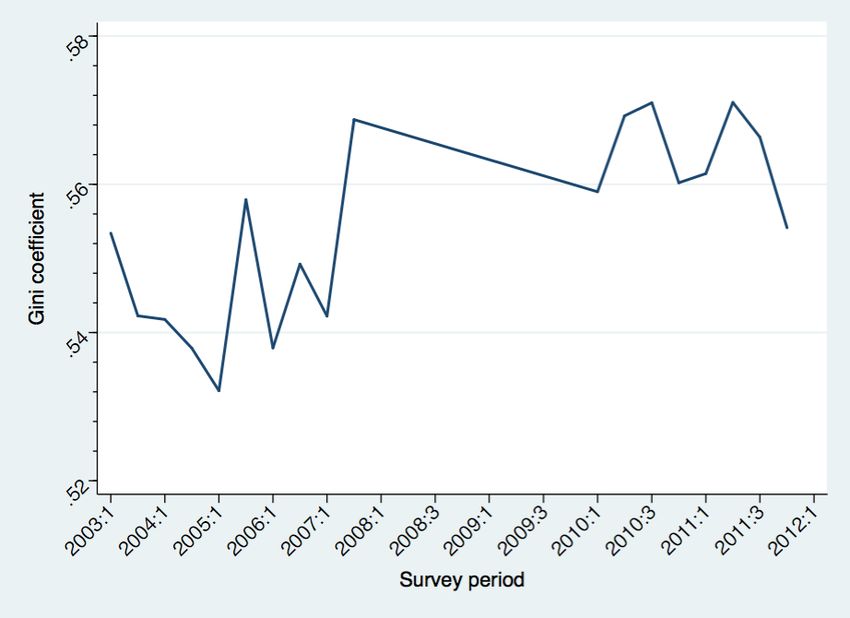
Table of contents
Executive summary                                                                       ii
Table of contents                                                                       v
List of figures                                                                         vi
List of tables                                                                         vii
1       Introduction                                                                    1
2       The South African labour market and the working poor                            3
       2.1 Introduction: wages, poverty and inequality                                  3
       2.2 Labour market trends over time                                               5
       2.3 The ‘working poor’                                                           9
       2.4 The contemporary labour market                                              11
       2.5 Where would a potential national minimum wage bind?                         15
       2.6 Conclusion                                                                  18
3       South African minimum wage systems and setting a national minimum wage         19
       3.1 Current minimum wage systems in South Africa                                19
       3.2 Anchoring the national minimum wage                                         22
       3.3 Conclusion                                                                  25
4       Literature review: the impact of minimum wages on inequality and poverty       26
       4.1 Evidence from developed countries                                           27
       4.2 Evidence from developing countries                                          28
       4.3 Conclusion                                                                  33
5       Literature review: the impact of minimum wages on employment                   34
       5.1 Aggregate evidence on employment effects from meta-analyses                 36
       5.2 Disaggregated evidence on employment effects from meta-analyses             38
       5.3 The South African evidence on employment effects                            39
       5.4 Explaining the findings – economic theory and empirical reality             40
6       Modelling the impact of a national minimum wage in South Africa                 45
       6.1 Statistical models used to evaluate the impact of a national minimum wage in
       South Africa                                                                     45
       6.2 The consequences of a rising labour share: UN Global Policy Model            47
       6.3 The potential impact of a national minimum wage: the ADRS DIMMSIM model
                                                                                        55
7       Conclusion                                                                     65
References                                                                             67
Appendix A: Summary of employment meta-analyses                                        74
Appendix B: United Nations Global Policy Model summary                                 78
Appendix C: ADRS’ Dynamically Integrated Macro-Micro Economic Simulation Model
(DIMMSIM) summary                                                           81

                                              v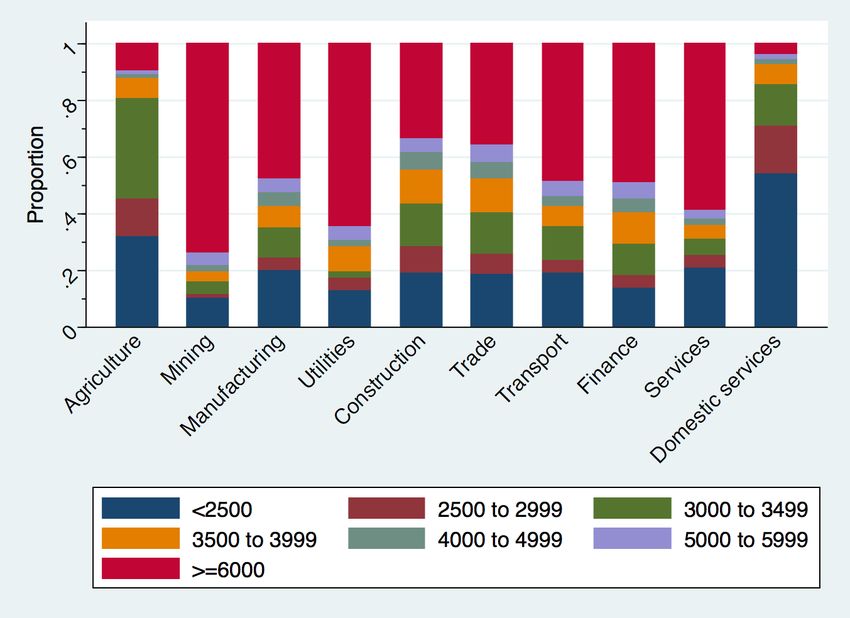
List of figures
Figure 1: Dependency ratios for earners in poor households                                      5

Figure 2: Shares of total composition by sector, 2003 and 2012                                  6

Figure 3: Earnings inequality over time (2003 – 2012)                                           8

Figure 4: Shares of total wages going to each decile in the earnings distribution (2003 – 2012) 8

Figure 5: Percentage of full-time workers above and below working-poor line by race            11

Figure 6: Percentage of full-time workers above and below working-poor line by gender          11

Figure 7: Cumulative distribution function of earnings                                         15

Figure 8: Where a minimum wage would bind, by sector                                           16

Figure 9: Where a national minimum wage would bind, by sector, adjusting for under-reporting
                                                                                               17

Figure 10: Where a minimum wage would bind, by smaller SIC sector                              17

Figure 11: Where a minimum wage would bind, by disaggregated manufacturing sector              18

Figure 12: Coverage by type of minimum wage institution (2014)                                 20

Figure 13: Real wage growth for sectoral determinations (2002 – 2015)                          21

Figure 14: Percentage increase in hourly sectoral determinations since institution             21

Figure 15: Minimum-to-mean wage ratios (all countries)                                         23

Figure 16: Minimum-to-median ratios (all countries)                                            23

Figure 17: National minimum wages and inequality in four Latin American countries (2000-2012)
                                                                                               29

Figure 18: Labour share in South Africa (1990 – 2014)                                          48

Figure 19: Labour share in South Africa in baseline vs. three scenarios as percentage of value
     added (2014 – 2025)                                                                       51

Figure 20: Private consumption in baseline and three scenarios as percentage of GDP (2014 –
     2025)                                                                                     52

Figure 21: GDP growth rate in baseline and three scenarios (2014 – 2025)                       52

Figure 22: Employment rate in baseline and three scenarios (2014 – 2025)                       53

Figure 23: Economy-wide average real wage levels and household real gross income average
     annual growth rate (2016 – 2025)                                                          59

Figure 24: Household consumption expenditure (2015 – 2025)                                     59

Figure 25: Economic output: average annual percentage change relative to baseline (2016 –
     2025)                                                                                     60

Figure 26: GDP: average annual real growth rate (2016 – 2025)                                  61

Figure 27: Labour productivity: average annual percentage change relative to baseline (2016 –
     2025)                                                                                     61

Figure 28: Employment: average annual percentage difference relative to baseline (2016 – 2025)
                                                                                               62

Figure 29: Inequality relative to baseline in 2025                                             63

Figure 30: Poverty headcount by race relative to baseline in 2025                              64

Figure 31: Main modules and linkages in GPM                                                    80

Figure 32: MEMSA sectors                                                                       84

Figure 33: DIMMSIM general architecture                                                        84


                                                 vi
List of tables
Table 1: Gini coefficients for select years                                                3

Table 2: Poverty and wages                                                                 4

Table 3: Poverty and race                                                                  4

Table 4: Mean and median earnings 2003 and 2012                                            7

Table 5: Working-poor line                                                               10

Table 6: Proportions above and below working-poor line by different categories           10

Table 7: Mean and median under different assumptions                                     12

Table 8: Summary statistics of earnings by different categories                          14

Table 9: Updated poverty lines (February 2016)                                           22

Table 10: Minimum-to-mean wage ratios, various country groups                            22

Table 11: Minimum-to-median wage ratios, various country groups                          23

Table 12: Percentage of mean and median wages for South Africa (2015)                    24

Table 13: Current collectively bargained minimum wage levels using Department of Labour data
                                                                                         25

Table 14: Current minimum wage levels from Labour Research Services (2015)               25

Table 15: Summary of South African employment studies                                    40

Table 16: Summary of adjustment mechanisms                                               43

Table 17: Percentage points increase in key variables relative to baseline by 2025       54

Table 18: Key variables by 2025 for baseline and all three scenarios                     54

Table 19: Meta-analyses on employment effects: aggregate summary                         74

Table 20: Meta-analyses on employment effects: disaggregated summary                     76


                                               vii
1 Introduction
The Ekurhuleni Declaration on 4 November 2014 brought to the fore the long-standing
issue of the possible implementation of a national minimum wage in South Africa. The
declaration acknowledged the role of wages as “the most important component of
income for South Africa’s working people” and the need to reduce high levels of
inequality, as well as the importance of promoting employment. In light of this the
‘social partners’ – comprising Business, Community, Government, and Labour – at the
National Economic Development and Labour Council (Nedlac) committed to “engage
on the modalities of introducing a national minimum wage in South Africa” (Nedlac
2014).

Minimum wages are a common labour-market policy tool with over 90% of
International Labour Organization (ILO) member states having some form of minimum
wage system. Minimum wage regimes can be established on the basis of multiple
minima, differentiated by sector, region and/or occupation; on the basis of one national
minimum wage that applies across the broad; or with some combination of the two.
They can be set by either government decree or through engagements between the
social partners, or a combination of both. Approximately half of ILO member states
with minimum wage systems have national minimum wages while the other half have
differentiated minima. South Africa currently has a complex system whereby minimum
wages are set by sector, occupation and/or region, through sectoral determinations
published by the Minister of Labour, collective bargaining agreements through
bargaining councils, and bilateral (company-by-company) agreements (see Section 3).

Minimum wages, according to the ILO’s resolution No. 135, are “one element in a
policy designed to overcome poverty and to ensure the satisfaction of the needs of all
workers and their families”. Further, the “fundamental purpose of minimum wage fixing
should be to give wage earners necessary social protection” (ILO 2014a). More recently
the ILO has stressed the importance of “adequate protection in accordance with the
Decent Work Agenda” and noted that for a minimum wage to be “meaningful” it must
“be set at a level that covers the needs of workers and their families, while taking into
account economic factors” (ILO 2015a). Minimum wages are also seen as a means
through which to reduce inequality and encourage labour productivity. A single
national minimum wage is preferred by the International Labour Organization (ILO)
and minimum wage experts because it:

       •   covers all workers;
       •   is easier to enforce and enjoys higher compliance;
       •   benefits all workers equally (while sectoral minima have been shown to
           discriminate against vulnerable groups such as women and youth);
       •   can be set to serve broader policy objectives such as the reduction of poverty
           and inequality;
       •   can be set to take account of workers’ needs and macroeconomic growth
           impacts, not only narrow sectoral considerations.

In the context of the proposed institution of a national minimum wage in South Africa,
the National Minimum Wage Research Initiative at the University of the Witwatersrand
(Johannesburg, South Africa) undertook a wide-ranging research project, reviewing the
international literature, undertaking South Africa specific labour market analysis and
statistical modelling, and interrogating minimum wage policy frameworks. This reports

                                             1
draws on that research and is complemented by another report, Considerations for the
Design and Implementation of a National Minimum Wage for South Africa (Castel-
Branco 2016), which summarises the policy work undertaken by the Initiative.

This report begins with an analysis of the South African labour market in Section 2,
followed by a discussion in Section 3 of the current minimum wage regime in South
Africa and possible benchmarks for a future national minimum wage. Section 4 and
Section 5 review the international literature on the impact of minimum wages on
poverty and inequality, and employment, respectively. In Section 6 we present the
findings of two statistical modelling exercises that estimate the potential impact of a
national minimum wage. Section 7 concludes.

                                          2
2 The South African labour market and the working poor1

2.1 Introduction: wages, poverty and inequality

The South African labour market is characterised by high levels of inequality, poverty,
and unemployment. While poverty has declined in the post-apartheid period,
inequality has remained high and unemployment has increased. The labour market is
central to these trends. Wages remain the largest source of income for the majority of
South Africans, although the lowest 40% of earners also rely heavily on government
social grants.

The South African Gini coefficient – the most commonly cited measure of inequality,
which ranges from 0 (perfect equality) to 1 (perfect inequality) – is 0.66 (see Table 1),
by many accounts the highest in the world. Income inequality is driven by differences
between earners: wage differentials account for 62% of inequality while the presence
of zero earners (the unemployed) accounts for 38% (Leibbrandt et al. 2012). When
differentiating by income source – wages, social grants, remittances, and investment
income – the relative contribution of wage income to overall inequality in South Africa
was just over 90% in 2012, highlighting the centrality of wage earnings to measures of
inequality.2

                                                                                                                                                                       Table 1: Gini coefficients for select years
                                                                                                                                                                                                                                   1993       2000   2008   2012
                                                                                          Gini coefficient                                                                                                                         0.66       0.68   0.70   0.66
                                                                                                                                                                               Source: Leibbrandt et al. (2010) and Finn (2015)

The national poverty headcount rate – the percentage of the population living below
the national poverty line – was 62% in 2012.3 The poverty line chosen is based on
Budlender et al. (2015) and is R1 319 in April 2015 rands (and R1 386 in February
2016 rands). Unsurprisingly, the presence or absence of a wage earner in a household
is highly correlated with household poverty. From Table 2, the poverty rate in
households without any wage earner was 88% in 2012, while the rate in households
with at least one resident wage earner was 50%, showing the centrality of wage
earnings to poverty as well as inequality.4 However, as discussed below, 55% of full-
time workers can be categorised as ‘working poor’.


1 This section predominantly summarises work for this project from Finn (2015) A national
minimum wage in the context of the South African labour market. At times, paragraphs or
sections are reproduced verbatim. For more details – including methodological specifics – the
full      paper      can        be     found     at:     http://nationalminimumwage.co.za/wp-
content/uploads/2015/09/NMW-RI-Descriptive-Statistics-Final.pdf.
2 Investment income is far more unequally distributed than wage income (see Daniels et al.
2012) but because wage income is a far larger share of income, its relative contribution to
inequality is also much greater.
3 This uses household data from the National Income Dynamics Survey (NIDS), for which the
most recent publically available data, Wave 3, is from 2012.
4 “Poor households”, here and below, are defined as those in which monthly per capita income
is less than the poverty line of R1 319.
                                                                                                                                                                                                                                          3
                                                                                                                                                                                                                        Table 2: Poverty and wages
                                                                                                                                                                                                                      No earner in household            Earner in household
                                                                                                                                     Non-poor                                                                                         11.9                     50.0
                                                                                                                                     Poor                                                                                             88.1                     50.0
                                                                                                                                                                                                                                      100                      100
                                                                                                                                                                                Source: Finn (2015) from NIDS Wave 3 dataset.

The poorest households are least likely to have wage earners present: in 2012, 85% of
people in the poorest decile were not co-resident with an earner. This proportion only
falls below 50% from decile 4 onwards. By contrast, over 90% of people living in the
top three deciles are co-resident with at least one wage-earner. These data illustrate two
important roles that wages play in poverty. First, that lack of access to wage income is a
major contributing factor to poverty. Second, that having access to wages does not
guarantee household income per capita will rise above the poverty line (see below on
the working poor).

It is important to note that poverty remains differentiated along racial lines.5 As seen in
Table 3, almost 71% of Africans fall below the poverty line, with the corresponding
poverty rates for Coloured, Asian/Indian and White respondents standing at 57%,
20.5% and 4%, respectively.

                                                                                                                                                                                                                               Table 3: Poverty and race
                                                                                                                                                                             Population group                                            Non-poor       Poor
                                                                                                                                                                                                   African                                       29.3   70.8   100
                                                                                                                                                                                                   Coloured                                      43.2   56.8   100
                                                                                                                                                                                                   Asian/Indian                                  79.5   20.5   100
                                                                                                                                                                                                   White                                         95.9   4.1    100
                                                                                                                                                                                Source: Finn (2015) from NIDS Wave 3 dataset.

It is also important to appreciate the demands placed on wage earners vis-à-vis the
distribution of these wages to dependents. The average household size in South Africa
is 3.3, but this does not capture the average number of people dependent on each
wage earner. To do this we must take account of co-resident non-earners plus those
who are non-resident but receive remittances. The average dependency ratio for all
earners is 1.55. For non-poor earners the ratio is 1, meaning that each earner in a non-
poor household supports herself plus one other person. For earners living in poor
households, the ratio is far higher, at 2.65, indicating the extra burden placed on
earners in poor households. As shown in Figure 1 below, almost 10% of poor wage
earners support themselves and four other people, 6% support five others, 4% support
six others and some poor wage earners support up to ten dependents.


5          Population groups are reported with the labels provided in all Stats SA statistical releases.
                                                                                                                                                                                                                                             4
Figure 1: Dependency ratios for earners in poor households
Source: Finn (2015) from NIDS Wave 3 dataset.
2.2 Labour market trends over time
Trends in the composition, earnings, hours worked and inequality of the South African
labour market are explored in depth in Finn (2015); here we point to some key findings.
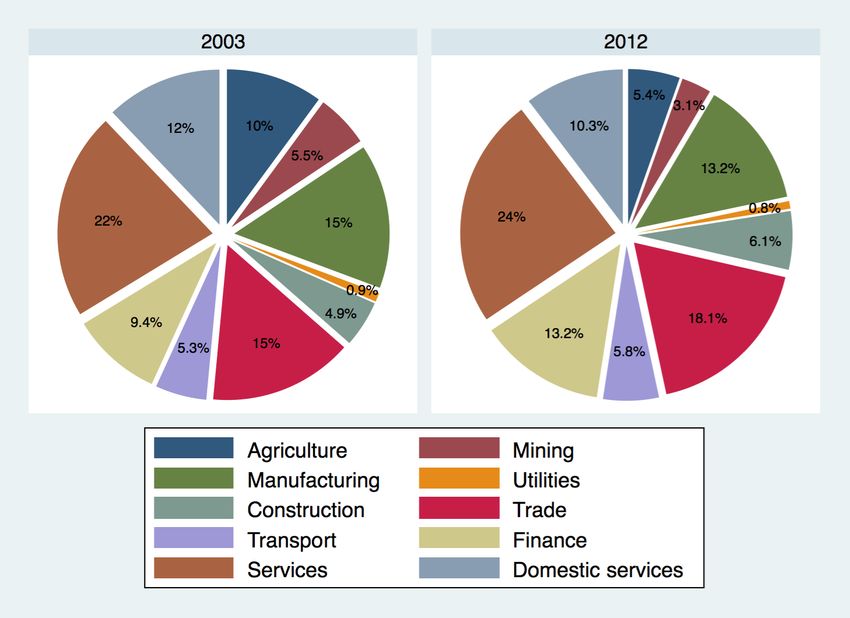
Figure 2 presents the compositional shares of the labour force by sector for 2003 and
2012. We see some important changes over that period. The share of the labour force
in the primary sector dropped significantly, from 10% to 5.4% in agriculture and from
5.5% to 3.1% in mining. Declining employment in agriculture (and the primary sector
more generally) is normal in developing countries but requires a pro-active government
response. More concerning is the fall in manufacturing as a share of total employment,
from 15% to 13.2%, employing just over 1.5 million in 2012. This is accompanied by a
steady rise in employment in the tertiary sector with the services, finance, and trade
sectors expanding proportionately and in real terms, increasing by close to 800 000
workers.
5
           Figure 2: Shares of total composition by sector, 2003 and 2012

                          Source: Finn (2015) from PALMS dataset.

Between 2003 and 2012, private sector employment grew from 7.7 to 9.4 million,
peaking above 10 million in 2007/8 and falling in the wake of the global financial
crisis. Public sector employment grew steadily from 2 million to 2.4 million. The
number of African workers grew sharply between 2003 and 2008, with about 2 million
jobs being added to this group. There was then a sharp drop between 2009 and 2010
of about 750 000 jobs. Most of these were low-wage jobs in the agriculture and
manufacturing sectors and indicate that African workers were worst affected by the
deterioration in the economic climate. This was followed by something of a recovery
from 2010 onwards. Trends for the other groups were more or less flat, and they appear
to have been relatively well shielded from the global financial crisis of 2008/2009.

Average real wages rose across almost all sectors and demographics between 2003 and
2012. Large average wage gains were made in agriculture, mining, construction, trade
and domestic work (see Table 4). However, median earnings – the midpoint in the
wage distribution above (and below) which 50% of workers earn – rose more slowly.
We see this in Table 4 where real mean wages for all workers rose by 35% during this
period while real median wages rose by only 22%. The same trend is observable for the
majority of sectors, all race groups but Asian/Indian, and both genders. Most stark is
that mean wages in agriculture rose by 114% but median wages by only 39%. The
growth in the real mean outpacing growth in the real median is indicative of growing
earnings inequality within these sectors and demographic groups (shown in more detail
in Finn 2015). This is because wages at the bottom of the distribution are growing more
slowly than wages at the top, a trend confirmed in Wittenberg (2014).

                                            6
Table 4: Mean and median earnings 2003 and 2012
Mean Median
Percent Percent
2003 2012 2003 2012
increase increase
Overall 5 517 7 443 35 3 187 3 897 22
Industry
Agriculture 1 352 2 889 114 1 125 1 559 39
Mining 6 004 10 245 71 3 937 7 195 83
Manufacturing 5 958 7 654 28 3 750 4 197 12
Utilities 10 509 11 063 5 5 624 7 195 28
Construction 3 553 5 162 45 2 531 3 118 23
Trade 4 417 6 192 40 2 625 3 597 37
Transport 7 230 8 142 13 4 687 5 036 7
Finance 10 295 9 624 -7 5 249 5 396 3
Services 8 465 10 474 24 7 499 7 195 -4
Domestic services 1 096 1 695 55 844 1 439 71
Race
African 4 059 5 445 34 2 437 2 998 23
Coloured 4 241 7 058 66 2 437 3 897 60
Asian/Indian 7 825 11 701 50 5 624 8 993 60
White 14 468 16 581 15 11 249 11 991 7
Gender
Male 5 963 8 299 39 3 375 4 317 28
Female 4 849 6 399 32 2 435 3 118 28
Source: Own calculations from PALMS dataset. Observations weighted using the bracketweight variable.
Outliers excluded.
Persistently high levels of wage inequality are evident from Figure 3 and Figure 4.
Figure 3 shows the Gini coefficient of earnings6 was almost identical at the start of the
period (0.553) and at the end (0.554). This compares to a higher Gini coefficient of
household income per capita of between 0.65 and 0.70 over the period (Leibbrandt et
al., 2012). The compressed bottom half of the labour market is evident in Figure 4, as
the total share going to the bottom 60% of the distribution (deciles one to six) is only
20%. The share of wages going to the highest paid decile alone (the highest paid 10%)
is about 40%, and this is just over double the share going to the next highest 10% of
the earnings distribution (the ninth decile).
6 This is different to the Gini coefficients presented earlier. We are now focused on earnings
inequality only, while before we focused on household income inequality.
7
                    Figure 3: Earnings inequality over time (2003 – 2012)

Source: Finn (2015) from PALMS dataset. Observations weighted using the bracketweight variable. Outliers
                                              excluded.

       Figure 4: Shares of total wages going to each decile in the earnings distribution
                                        (2003 – 2012)

Source: Finn (2015) from PALMS dataset. Observations weighted using the bracketweight variable. Outliers
                                              excluded.

These labour market trends capture the difficulties South Africa has had in growing its
economy, expanding employment, and reducing poverty and inequality. We turn now
to focus specifically on the current labour market, beginning with an investigation of
the ‘working poor’.

                                                   8
2.3 The ‘working poor’

There is no agreed method for defining which workers constitute the ‘low-wage’ or the
‘working poor’. In some international literature, and in usage by statistical agencies in
the EU, the term ‘working poor’ is used to refer to workers who live in households in
which income is less than approximately two-thirds of the national median. Given how
low the median is relative to the mean in South Africa (both in absolute terms and
compared to other countries), we avoid defining ‘working poor’ in relative terms and
choose instead to focus on workers who live in households in which monthly
household income per capita falls below the poverty line. This is the approach taken by
the US Bureau of Labor Statistics, which considers wage earners living in households
that fall below the poverty line as ‘working poor’ (US Bureau of Labor Statistics, 2012).

The question at the centre of our definition of a working-poor line is: What wage level
would it take, on average, to bring a household living below the poverty line which has
at least one worker, up to the poverty line? This raises a number of issues. First,
dependency ratios (including co-resident and non-co-resident dependents) must be
taken into account, including that poorer households face higher dependency ratios as
discussed above. Second, poverty must be defined. In this study we use the most recent
cost-of-basic-needs poverty line available for the country, the upper line7 of which is
R1 319 per capita per month in April 2015 rands (Budlender et al. 2015).8 Third, we
also take into account how far below the poverty line each household is (the depth of
poverty). It is worth emphasising that poverty lines represent little more than a
subsistence level of living and are not normative levels of what is required for a
‘decent’ standard of living. The line also enforces a strict cut-off – a household that has
a per capita income of just R1 over the poverty line is considered non-poor.

In calculating our ‘working-poor’ threshold we first identify ‘full-time’ wage earners
who work at least 35 hours a week (for reasons discussed below), and live in poor
households, taking household size and a cost-of-basic-needs poverty line into account.
We then calculate the household poverty gap – the total amount of money required to
lift a poor household up to the poverty line – and average the poverty gap per earner in
each working-poor household. This tells us the depth of poverty in each of these
households. Next, we compute the mean wages of earners in these households. This
mean is then added to the average poverty gap per earner for each household; the sum
is sufficient to bring household income per capita in each of these households up to the
poverty line. In order to calculate this threshold we use the NIDS Wave 3 (2012) data.


7 Most poverty measurements calculate three poverty lines: food, lower and upper. The food
poverty line is derived by working out the cost of meeting a basic daily energy requirement of
approximately 2 100 kilocalories. The lower poverty line is the food poverty line plus the
average amount spent on non-food items (essentials) by households whose total expenditure
equals the food poverty line. The upper poverty line is the food poverty line plus the average
amount spent on non-food items by households whose food expenditure equals the food
poverty line. The upper poverty line is the most widely used, including in this report. This is
higher than the StatsSA line (2015) but similar to a previous line devised by Özler (2007), which
is used in a number of academic publications on poverty in the country (for example Leibbrandt
et al. 2010, 2012) and stands at R1 365 per capita per month in 2015 rands.
8 The line presented in the Budlender et al. paper is R1 307 in March 2015 rands. In order to
convert this to its real April 2015 equivalent we follow the methodology suggested by the
authors and adjust the food and non-food components of the line separately for food and non-
food inflation, respectively.
                                                                                                                                                                                                                                   9
We arrive at a working-poor line of R4 125 per month in April 2015 prices (or R4 317
in February 2016 prices) as shown in Table 5 (see Finn 2015 for further detail and
methodological caveats).

                                     Table 5: Working-poor line
                        Study            Poverty line (2015)     Working poor line
                     Budlender et al.          1 319                    4 125
                           Source: Finn (2015) from NIDS Wave 3 dataset.

Table 6 shows the proportion in each labour-market category that earns above or
below the working-poor line. 95% of those employed in domestic services earn less
than R4 125 per month, while the corresponding figure for those employed in
agriculture is 89.6%. About half of those employed in manufacturing and transport earn
below this line. The industries with the lowest proportion of working poor are mining
and utilities, with 23% and 31%, respectively. Around 60% of African workers and
56% of Coloured workers earn below R4 125, while the same holds for 37% of
Asian/Indian workers and 22% of White workers. 50.6% of men are considered to be
working poor, according to our definition, while the proportion of women is close to
58%. While only 46% of the working poor are women, 58% of women fall below the
working-poor line. Similarly, while 22% of White workers fall below the working-poor
line, they make up only 5% of these workers – less than half their share of overall
earners. This confirms that the relative distribution of the working poor is in line with
the racially and gender skewed wage earnings and poverty in South Africa.

       Table 6: Proportions above and below working-poor line by different categories

                      Industry                 Above line      Below line
                         Agriculture              10.4           89.6       100
                         Mining                   77.1           22.9       100
                         Manufacturing            50.8           49.3       100
                         Utilities                68.9           31.1       100
                         Construction             36.9           63.1       100
                         Trade                    39.8           60.2       100
                         Transport                52.5           47.5       100
                         Finance                  52.7           47.4       100
                         Services                 61.2           38.8       100
                         Domestic services        4.8            95.2       100
                           Source: Finn (2015) from LMDSA 2014 dataset.

                                                10
       Figure 5: Percentage of full-time workers above and below working-poor line by race

                                 100
                                                                                                                               78

                                      25 50 75
                                                                                    63

                 Percentage of full-time workers                                                        44
                                                            41
                   -50 -25     0

                                                                                                                      -22
                                                                            -37

                                                   -59                                        -56
                                 -100 -75

                                                    Africans            Asians/Indians        Coloureds                   Whites

                                                           Below working-poor line                     Above working-poor line

                                                     Source: Own calculations from LMDSA 2014 dataset.

         Figure 6: Percentage of full-time workers above and below working-poor line by
                                              gender

                                                                            All full-time workers

                                                                             46%
                                                                                              54%

                                                   Male full-time workers                           Female full-time workers

                                                                                                      42%
                                                    49%              51%
                                                                                                                      58%

                                                               Below working-poor line          Above working-poor line

                                                     Source: Own calculations from LMDSA 2014 dataset.

2.4 The contemporary labour market

We now consider the South African labour market in 2014, using Statistic South
Africa’s Labour Market Dynamics South Africa (LMDSA) 2014 dataset. This provides
context for our analysis of where a national minimum wage would ‘bind’, considered
in the next subsection. The composition of the labour market in 2014 is not greatly
different to that shown for 2012 above and is not discussed here. Note that when
                                                                                         11
discussing earnings we now limit our sample set to those working 35 hours and above:
our measure of ‘full-time’ work. This is important. If we are to discuss and model a
monthly national minimum wage – that is, the monthly wage that a full-time worker
would receive – and understand what proportion and which segments of the wage
structure this will influence, then we need to measure this against mean and median
wage earnings for full-time workers.

The various means and medians displayed in Table 7 – each reflecting different
restrictions that have been applied to the data – are crucial.9 The lowest mean and
median come from a ‘naïve’ approach of using the data without any adjustments.
Doing so returns a mean of R8 138 and a median of R3 193. The number of
observations – 65 058 – is higher than in any of the other approaches because every
possible earner is included. Such an approach is hardly ever used: it is standard
practice to remove zero earners and outliers as is done in rows 3 to 11 of Table 7.10
Excluding the 327 zero earners (row 2) raises the mean and the median to R8 173 and
R3 224, respectively. In row 3, the 63 outliers are also removed, raising the mean
slightly from R8 138 to R8 168, with the median the same as for row 2.

                                                                                                                  Table 7: Mean and median under different assumptions
                                  Assumptions                                                                                                                                                                                           Mean     Median   Number11
                                                       1. Naïve                                                                                                                                                                         8 138    3 193     65 058
                                                       2. Zero earners removed                                                                                                                                                          8 173    3 224     64 731
                                                       3. Outliers and zero earners removed                                                                                                                                             8 168    3 224     64 668
                                                       4. 35 hours plus                                                                                                                                                                 8 669    3 640     54 757
                                                       5. 40 hours plus                                                                                                                                                                 8 675    3 640     51 401
                                                       6. Hourly average × 45 × 4.3                                                                                                                                                     8 989    3 510     62 927
                                                       7. Formal only (full-time)                                                                                                                                                       9 809    4 368     44 284
                                                       8. Formal ex. domestic (full-time)                                                                                                                                               9 965    4 507     43 115
                                                       9. Formal ex. agriculture (full-time)                                                                                                                                            10 102   4 680     41 739
                                                       10. Formal ex. agriculture and domestic (full-time)                                                                                                                              10 274   4 680     40 570
                                                       11. Inflated by 40% for under-reporting (full-time)                                                                                                                              12 136   5 097     54 757
                                                                                                                   Source: Finn (2015) from LMDSA 2014 dataset.
                                                                                                         Note: Full-time workers are those who work at least 35 hours per week.

Rows 4 through 6 show different approaches to calculating a monthly full-time
equivalent. Limiting the earnings distribution to those workers who worked at least 35
hours in the last week returns a mean of R8 669. Extending the cut-off to 40 hours
raises this by R6. The median for both cut-offs is the same, and stands at R3 640. Given
how little the choice between these two hourly cut-offs matters for the mean and
median, we use the 35-hour cut-off as a definition of ‘full-time’ work because it is


9 For a full explanation of the methodologies applied see Finn (2015).
10 Zero earners are those workers who are employed (in our case for at least 35 hours per week)
but report an income of zero. They are excluded because it is implausible that there are
employed workers who earn nothing. One example of a high outlier in the data is an individual
who was coded as earning over R9 million a month. An example of a low outlier in the data is
someone who reported working 48 hours a week in the formal sector, yet reported a monthly
wage of R4.80.
11 ‘Number’ refers to the number of observations in the LMDSA 2014 dataset used to calculate
the means and medians under different assumptions.
                                                                                                                                                                                                                                   12
associated with a larger sample size. Another way of calculating wages for an
equivalent of full-time work would be to calculate an average hourly wage for all
workers (excluding outliers and zero-earners), which stands at R46.45, and multiply
this by 45 – the maximum work week before overtime takes effect, as outlined in the
Basic Conditions of Employment Act (Republic of South Africa, 1997) – and then by 4.3
(the average number of weeks in a month).12 Row 6 of Table 7 shows that the mean, at
R8 989, is higher than the mean in row 5, though the median is lower, at R3 510.13
From this point onwards we calculate means and medians for full-time workers
working 35 hours or above, unless otherwise stated.

Restricting the sample to reflect only the earnings of those in the formal sector drops the
sample size to under 45 000, and raises the mean and median to R9 809 and R4 368,
respectively. Excluding workers from the two lowest paid sectors (agriculture and
domestic work) returns a mean of R10 274, and a median of R4 680.

There are a number of South African studies which suggest that the QLFS earnings data
are under-reported when benchmarked against other sources such as the QES,
administrative data, and industry-level data (Burger et al., forthcoming; Kreuser, 2015;
Seekings, 2007; van der Berg et al., 2007; Wittenberg 2014a; Woolard, 2002). The
potential level of under-reporting clusters around 40% and so we apply a ‘correction’
by inflating the QLFS/LMDSA data by this percentage, displayed in row 11. This is done
so that an upper bound for the true mean and median of monthly earnings for full-time
workers may be derived.14 This crude adjustment raises the mean to R12 136, which is
almost R2 000 higher than the next highest level in the table, while the resulting
median of R5 097 is also the highest in the table. The appendix of Finn (2015) contains
means and medians for different assumptions, and these are reported so that
policymakers have the full range at their disposal.

Table 7 is crucial because we will benchmark potential levels of the national minimum
wage against existing mean and median wages in Section 3 and use these when
modelling the national minimum wage in Section 6.

Table 8 gives summary statistics for earnings of different groups in the economy. The
means of each industry range from a low of R2 210 per month in domestic services to
highs of between R10 000 and R13 000 in finance, services, and utilities. This shows
that inequality between sectors is significant (even though inequality within sectors has
come to play an increasingly prominent role). This is evidenced by the fact that the 90th
percentile of wages in the agricultural sector is the same as the 25th percentile in
mining, and is five times less than the 90th percentile in the finance sector. Medians
range from R1 577 in domestic services to R7 281 in utilities. The national median is
R3 640. The mean of public sector wages was almost R5 000 higher than the mean in
the private sector, and this difference was slightly lower at the median. Earnings by


12 Any method for calculating a monthly ‘full-time equivalent’ from the LMDSA data carries an
element of arbitrariness. The objective must be to limit the extent of this. We believe that
adopting a 35-hour week is best suited in this regard. The problem with multiplying the hourly
wage by 45 hours and 4.3 weeks a month, is that the mean and median are extremely sensitive
to the number of hours by which you multiply the hourly rate, and there is no agreed upon
number of hours that constitutes full time. A full analysis of the different approaches used can be
provided upon request.
13 The hourly wage for those working less than 35 hours a week is R47.16.
14 Again, we refer the interested reader to Finn (2015) where this is dealt with in more depth,
and various caveats given.
                                                                                                                                                                                                                                   13
race show that the mean for African earners is R2 209 lower than the corresponding
mean for Coloured workers, and R4 671 and R12 441 lower than the Asian/Indian and
White means, respectively. The differences in the wage levels for various sectors or
demographic groups at points along the wage distribution highlights that a national
minimum wage would cover a different proportion of workers in each of these sectors
and groups, an issue to which we now turn.

           Table 8: Summary statistics of earnings by different categories
        Industry                 Mean      p10      p25     Median        p75      p90
           Agriculture           3 381     832     1 560    2 253        2 600    4 160
           Mining               10 279    1 768    4 160    7 281        11 441   19 762
           Manufacturing         9 053     901     2 184    4 160        8 338    18 930
           Utilities            13 071    1 248    3 120    7 281        15 602   26 003
           Construction          6 670    1 126    2 028    3 155        5 409    11 441
           Trade                 7 549    1 040    2 080    3 328        6 241    15 602
           Transport             8 360     936     2 253    4 160        9 361    19 242
           Finance              10 716    1 352    2 600    4 160        11 441   20 802
           Services             11 435     936     2 080    6 241        14 562   20 802
           Domestic services     2 210     728     1 040    1 577        2 288    3 120
        Total                    8 669     988     2 080    3 640        9 014    18 722
        Private/Public
           Private               7 696    1 040    1 976    3 155        7 281    16 642
           Public               12 582     926     2 600    7 385        15 602   22 102
        Race
           African               6 761     936     1 803    3 120        7 073    15 602
           Coloured              8 970     728     2 141    3 536        7 801    16 642
           Asian/Indian         11 432    1 421    2 912    6 241        15 602   21 842
           White                19 209    1 577    4 160    11 441       20 802   36 404
        Gender
           Male                  9 429    1 040    2 229    4 056        9 361    19 762
           Female                7 651     884     1 768    3 120        8 321    16 642
        Province
           Western Cape         12 049     728     2 253    3 640        8 841    18 306
           Eastern Cape          6 727     728     1 560    2 912        6 761    15 602
           Northern Cape         6 711    1 248    2 028    2 600        6 033    14 874
           Free State            6 698     832     1 664    3 120        7 801    16 642
           KwaZulu-Natal         5 376     884     1 577    2 912        6 241    13 521
           North West            6 649    1 248    2 080    3 605        8 321    15 602
           Gauteng              10 711    1 248    2 600    4 680        12 620   21 842
           Mpumalanga            7 142    1 144    2 080    3 640        8 321    16 642
           Limpopo               5 391     832     1 404    2 496        6 241    14 125
        Geotype
           Urban formal         10 441    1 040    2 288    4 507        11 441   20 802
           Urban informal        4 811    1 040    1 872    3 016        4 889    9 014
           Tribal areas          4 469     728     1 248    2 288        4 699    10 401
           Rural formal          4 269    1 144    1 768    2 366        3 380    8 113
                          Source: Finn (2015) from LMDSA 2014 dataset.
                                              14
You can also read


