Social Research Practice - ISSUE 9 SPRING 2020 The Social Research Association journal for methods in applied social research - SRA
←
→
Page content transcription
If your browser does not render page correctly, please read the page content below

Social                                               ISSUE 9 SPRING 2020

Research
Practice
The Social Research Association journal for methods in applied social research
2

                                                  SOCIAL RESEARCH PRACTICE // ISSUE 9 SPRING 2020

Contents
03   Editorial
     Richard Bartholomew

     ARTICLES

04   From headline statistics to lived experiences:
     a new approach to measuring the poverty premium
     Andrea Finney and Sara Davies

17   Using vignettes to examine preferences for paying for
     long-term social care in online and interview surveys
     Bob Erens, Sanna Read, Martin Knapp, Gerald Wistow, Raphael Wittenberg
     and Nicholas Mays

41   Handmade object elicitation: using handmade objects
     to prompt richer interview data
     Ian Blackwell

     RESEARCH NOTES

52   Co-producing research with people who have experienced
     severe and multiple disadvantages
     Kerry Dowding

55   Capacity building in practice: how involving early career
     researchers in research awards can contribute to their
     development
     James Rupert Fletcher, Giulia Cavaliere, Guntars Ermansons, Sebastian
     Fonseca, Caroline Green, Tara Mahfoud, Emma Maun, Sam McLean,
     Emma Wynne Bannister and Anthea Tinker
3
SOCIAL RESEARCH PRACTICE // ISSUE 9 SPRING 2020
Editorial
Richard Bartholomew
Editor
Welcome to this ninth issue of Social Research Practice.
In From headline statistics to lived experiences: a new approach to measuring the poverty
premium Andrea Finney and Sara Davies describe their ingenious study to obtain more realistic and
disaggregated estimates of the ‘poverty premium’ – that is those additional costs poor households incur
as a direct result of having very low incomes. For example, having to use prepayment meters or cards, or
having to use more expensive local convenience stores because they have no car or find public transport
too expensive. The study used a creative combination of conceptual work, costing exercises, surveys and
cluster analysis to understand the heterogeneity of people’s experiences of the poverty premium.
How to pay for long-term social care is one of the most vexed policy questions of today. Arguably it was
Prime Minster Theresa May’s misjudged proposals on this which derailed her 2017 election campaign.
But asking people who they think should pay and how much is very challenging. In Using vignettes to
examine preferences for paying for long-term social care in online and interview surveys Bob Erens
and colleagues show how they developed a set of vignettes or scenarios describing different types of
need to test out people’s views. At the same time, they were able to compare the validity of two different
survey approaches to eliciting the views of those aged 65 to 75 – an online panel and a face-to-face
omnibus survey based on a random location sample design. Their results suggest that concerns over
data quality in online surveys may be misplaced. As ever, it is the representativeness of the samples
used which is crucial.
Using objects to help elicit responses in qualitative interviews is a well-established technique, especially
for discussions with children and members of vulnerable groups. Using objects can help to ‘break the
ice’, overcome shyness and engage people, notably when discussing sensitive or personal topics. But
how much does it matter what types of objects are used and how they were made? In Handmade
object elicitation: using handmade objects to prompt richer interview data, Ian Blackwell explores
the advantages of using objects handmade by young children and their fathers at four ‘dads’ groups’.
Importantly, the children were encouraged to select objects that had meaning to them, and this allowed
them more control of the flow and content of the semi-structured interview.
Our two research notes look at different aspects of the research process itself. Firstly, the advantages and
challenges of using co-productive approaches in research (Co-producing research with people who
have experienced severe and multiple disadvantages by Kerry Dowding). Secondly, the views of junior
researchers, based on their own experiences, on how research awards can be used more effectively to
develop the practical experience and skills of those embarking on research careers (Capacity building
in practice: how involving early career researchers in research awards can contribute to their
development by James Fletcher et al).
We welcome proposals for new articles or shorter research notes. If you are interested in offering
a research note or a full article you can find more information on the SRA website.4
SOCIAL RESEARCH PRACTICE // ISSUE 9 SPRING 2020
From headline statistics to lived
experiences: a new approach to
measuring the poverty premium
Andrea Finney and Sara Davies, University of Bristol
Abstract
The poverty premium, when households pay more for essential goods and services because they are
poor, remains a problem in the UK today. Previous attempts to measure it, however, have been crude.
This research aimed to take the measurement of the poverty premium beyond an illustrative figure to
something which better reflects the lived experiences of poorer households. To achieve this, we developed
a conceptual framework to understand how the poverty premium arises, taking a process-driven rather than
a traditional sector-based approach to identify components of the poverty premium. We then calculated a
typical cost for each component and surveyed lower-income households to measure exposure to them. The
average poverty premium incurred was £490. Finally, cluster analysis explored the underlying heterogeneity
of the poverty premium. Importantly, our approach reveals the breadth and depth of people’s experience
of the poverty premium and the pathways which contribute to it. It has highlighted the implications of
behaviour and constraint for effective practice and policy intervention, and will make it possible to
monitor the poverty premium more accurately and meaningfully over time.
Funding acknowledgement
The Oak Foundation
Introduction
Given that poverty describes, rather simply, a lack of resources (Townsend, 1979), the notion that poorer
households should then pay more to access essential goods and services than better-off households is
counter-intuitive. However, the term ‘poverty premium’ was first coined in 1960s USA (Caplovitz, 1963)
to reflect the recognition that poor households were indeed paying more for their essential goods and
services because they were poor. Sadly, the poverty premium remains a real and important issue in the
UK today, and represents structural disadvantage for those least able to afford it (for example Strelitz
and Lister, 2008; Bevan, 2009; Stewart, 2010; Hirsch, 2013; Richards, 2015).
A resurgence in interest began in 2007 with work by Save the Children and Family Welfare, which
estimated the poverty premium to be just over £1,000. By 2010, the poverty premium had risen to an
estimated £1,300 per family per year (Save the Children, 2010). These estimates were important in raising
the profile of the problem, stimulating discussion and informing the social policies needed to resolve it
(for example Joseph Rowntree Foundation, 2016).5
SOCIAL RESEARCH PRACTICE // ISSUE 9 SPRING 2020
However, there were significant limitations to the estimates from these studies. They were essentially
illustrative figures, and for the low-income households they were intended to relate to, they remained
hypothetical. In particular, the calculation of the premium was predicated on the assumption that a low-
income household incurred all of the individual elements of the premium, from a home contents insurance
premium costing £32 to buying a cooker costing an extra £430 (Save the Children, 2010). Yet, in reality,
any given household may or may not incur a particular premium. Qualitative research has shown not only
how profound the impact of the poverty premium can be on households, but also that exposure to it can
vary widely (Cambium Advocacy, 2015). Without knowing the breadth and depth of the lived experience
of the poverty premium, these headline figures risked overstating the scale of the poverty premium, and
potentially directing disproportionate amounts of policy attention to costly but relatively uncommon poverty
premiums. In addition, poverty itself was not always established clearly as a key contributory factor in the
extra costs arising and this could also risk overstating the reality of the poverty premium. As such, the
estimates were limited in the extent to which they reflected the reality of households’ experiences.
Our research (Davies et al, 2016a) undertook to measure, comprehensively, the poverty premium as
it exists in Britain today. Our aim was to seek a new approach to measuring lower-income households’
exposure to the poverty premium which better reflected their lived experiences of it; something previous
studies had not done. This would relate poverty as a key, contributory factor to additional costs arising
(defining the premium as a poverty premium) and reflect households’ actual and varied exposure to
these extra costs in their daily lives.
The measurement challenge
The study we conducted was ambitious; not just to take the measurement of the poverty premium
beyond a nominal figure of what this extra cost could represent to poorer households, but also to
reconceptualise the poverty premium to better reflect its contemporary nature. This ambition permeated
throughout our approach: from how we thought about the essential living costs potentially affected by
a poverty premium; through how we measured exposure to the poverty premium among lower-income
households; to how we explored the different exposure of different groups of lower-income households.
We carried out the research in 2016 in three linked stages:
◗ First, we undertook a conceptualisation exercise to identify the range of poverty premium components
which exist today. This needed to take account of the changing poverty premium landscape and
identify the pathways through which a poverty premium could be understood to arise. From this,
we developed a new measurement framework, which we validated in focus groups
◗ Second, we completed a costing exercise to identify a representative, nominal cost for each
component in the final measurement framework. At this stage, we also undertook a survey of lower-
income households to measure exposure to each one. This enabled us to calculate the average, lived
cost of the poverty premium given the depth (the nominal cost) of each component and its breadth
(percentage of households experiencing it)
◗ Finally, we carried out cluster analysis of the survey data to explore the heterogeneity of the lower-
income households’ experiences of the poverty premium. This identified significant variations in
households’ experiences and highlighted important socio-demographic drivers of these
For the purposes of this study, we defined lower-income households as those with incomes equivalised
for household size of below 70% of national median income by life-stage (working age or state-pension
age). This ensured that we included those whose incomes were below the relative poverty threshold,1
and those above the threshold whose low incomes still resulted in them incurring poverty premiums.
1
60% median income equivalised for household size.6
SOCIAL RESEARCH PRACTICE // ISSUE 9 SPRING 2020
We used a mixed-methods design, which included an extensive review of empirical literature of
poverty, money management and the poverty premium; a desk-based review of the sectors in which
a poverty premium might arise; and a costing exercise to identify representative nominal costs for each
component in the final measurement framework. We also undertook seven focus groups in England and
Scotland with lower-income householders of working and state-pension age. We developed a bespoke
questionnaire to capture the main components of the poverty premium in a nationally representative face-
to-face omnibus survey, with a final sample of 947 lower-income householders. A stakeholder group of
research, industry and charity experts convened specially for the study was consulted at all key stages
of the research. For more details about the fieldwork and definitions see Davies et al (2016b).
Stage 1: from poverty to the poverty premium:
developing a new framework
In creating a new measurement framework to account for the poverty premium as it exists today,
we needed to establish, front and centre, the extra costs that can occur when people buy essential
goods and services, which could constitute a poverty premium. Our overriding concern lay in establishing
that any extra costs lower-income households incurred had their roots in poverty. Viewing the poverty
premium through the lens of the consumer was at the heart of this.
Developing a new conceptual underpinning
Unlike previous research, our approach involved developing a conceptual model which emphasised
the behavioural pathways through which poverty leads to the poverty premium. This saw the poverty
premium as arising from the circumstances, needs, choices and constraints of lower-income households,
including the interaction of these with other factors. To ensure that our initial conceptualisation remained
grounded in the lived experiences of lower-income households, we drew heavily on the empirical research
literature of experiences of poverty and of household money management in this context. Key elements of
our initial model were then refined and validated through focus groups with people in or near poverty and
the stakeholder group convened specially for the project.
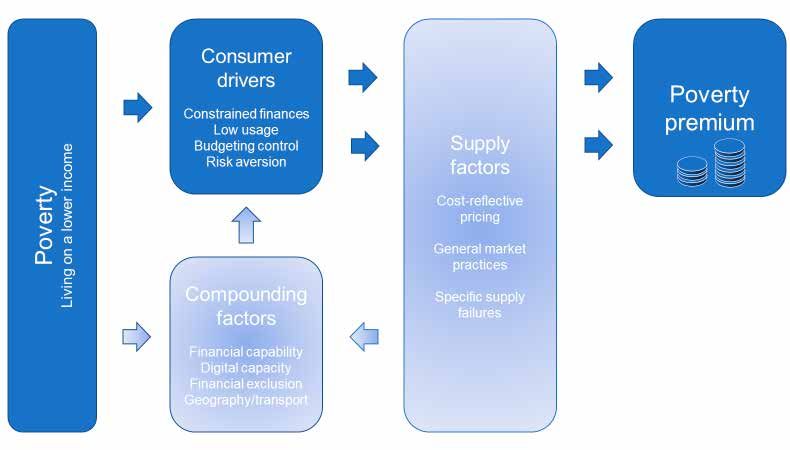
The final conceptual model (Figure 1) summarises the main pathways from poverty (‘living on a lower-
income’) to the poverty premium. It emphasises the direct role of low incomes on consumption behaviour
in dark shading and the indirect role of supply and other compounding factors in light shading.
Figure 1: Conceptualising pathways to the poverty premium7
SOCIAL RESEARCH PRACTICE // ISSUE 9 SPRING 2020
Drivers, factors and their interactions
The key influences in the model come from the ‘consumer drivers’, or demand-side factors. For lower-
income households these relate to how those with constrained finances behave; the difficulties in affording
lump-sum and up-front costs and accessing money quickly; the lower spending power realised through
low usage, including in smaller, more frequent shopping trips; and the need for insurance for smaller
minimum values. The need for tight budgeting control in lower-income households can also result in
smaller, more frequent shops and a preference for cash spending, prepayment meters or paper billing.
Finally, limited resources can make lower-income households averse to risks such as unexpected costs,
leading to more costly billing or payment method choices and a reluctance to switch providers
(for example Davidson et al, 2016; Gregory, 2015; Toynbee Hall, 2014).
However, consumer drivers do not exist in isolation. Hirsch (2013) identified three main types of supply-side
factors – cost-reflective pricing, general market practices and specific supply failures – which contribute
to the higher prices that lower-income households pay. In effect, supply factors act as a structural filter
in the marketplace, shaping the choices that lower-income households have available to them; in some
cases taking those choices away (such as access to affordable credit) and in others offering new choices
(such as higher-cost credit). The role of supply markets can be more profound when providers charge low
users more because they are considered more expensive to serve, as is often claimed for fuel prepayment
meters (for example Save the Children, 2010; McBride and Purcell, 2014).
However, supply structures also shape consumer behaviour through compounding factors. Compounding
factors describe influences on behaviour that occur across the income spectrum but are more prevalent
or pronounced among lower-income households. These encompass difficulties choosing products
(financial capability); lower rates of internet access or digital literacy (digital capacity); no or limited access
to appropriate affordable financial products (financial exclusion); and where people live (geography/
transport) as barriers to getting the best prices for goods and services (for example Finney and Hayes,
2015; Helsper, 2008; Tinson et al, 2014).
Crucially, the interaction of factors emerged as important, and this was clearly demonstrated in the
ongoing ‘marketisation’ of essential services. The assumption that a competitive market confers power
on consumers to switch to better deals in fact disproportionately disadvantages those lower-income
households which may stand to benefit financially but are not only risk averse, and may also lack the
financial capability or digital inclusion to make those switching choices. Thus, while a ‘loyalty penalty’
(Citizens Advice, 2018) may not obviously arise from poverty, the factors that affect those in poverty or
affect them more acutely – an aversion to direct debit, a bad credit score, or imposed supply methods
– together, make it harder for them to get a good deal.
The importance of pathways
Conceptualising the pathway for each potential component individually, from poverty to poverty premium,
conferred two key advantages. First, those components for which a contributory pathway of poverty
could be evidenced were supported for inclusion in our measurement framework, while those for
which poverty was not clearly evidenced (such as school uniforms) could be excluded. The analysis of
compounding factors, in particular, enabled us to exclude costs which arose purely due to other factors,
such as age or living in a rural area.
Second, it enabled us to identify overlaps between components and to reconcile potential double-
counting. For example, the reasons why lower-income households might shop in convenience stores
included low usage, budgeting control and lack of private transport. Counting transport costs as a
poverty premium in this context as well as a shopping premium would be to double count. Accounting
for the use of higher-cost credit allowed us to capture the premiums some people on lower incomes pay
when they cover the bulky expense of Christmas or white goods, again without double-counting these.8
SOCIAL RESEARCH PRACTICE // ISSUE 9 SPRING 2020
Validating a new measurement framework
Our conceptual model produced a list of poverty premium components for further empirical investigation.
A desk-analysis of the markets quickly identified that some potential components were outdated and no
longer carried a premium in 2016. For example, water bills were excluded because there was no clear
evidence that low-income households incurred greater costs. In other markets, such as pay-as-you-go
mobiles, prices had become much more competitive in recent years.
The focus groups in turn highlighted important misconceptions about the sectors and situations in which
a poverty premium might arise. For example, we found that while lower-income households were highly
unlikely to switch their fuel suppliers they nonetheless felt able to negotiate good deals on their internet
and TV packages: leaving a poverty premium component in one sector but not the other. We also needed
to be pragmatic, which ruled out very complex potential poverty premiums, such as regressive taxation,
savings interest rates and transportation costs (though noting that the last is partly addressed through
the shopping premium). While this meant potentially understating the size of the poverty premium, albeit
in known ways, understating the poverty premium was more tenable than overstating it, in our view, for
the credibility of the findings.
As a result of this empirical approach, we identified 31 individual components (detailed in appendix
A) of the poverty premium for measurement in our framework, which we have classified here into four
categories of: non-standard payment methods; non-standard bill methods; products and services; and
accessing money (Figure 2). Significantly, our categorisation is cross-sectoral: for example, multiple
sectors (fuel and telecoms) penalise lower-income consumers for preferring paper billing; and insurance
also appears as a poverty premium in more than one sector. Our conceptualisation ultimately led us from
a traditional sector-driven approach (which considers sectors in silos) to a process-driven approach which
addresses why the poverty premium exists.
Figure 2: Final framework for measuring the poverty premium
Non-standard payment methods Access to products and services
Fuel prepayment meters: electricity; gas Not switching fuel supplier in the last two years
Payment on receipt of bill: electricity; gas Shopping in convenience stores
Monthly insurance payments: home contents; car Deprived area insurance: home contents; car
Using prepaid cards Specific item insurance: appliances; mobile phone
Non-standard billing methods Accessing money
Paper billing: electricity; gas; landline/broadband; Fee-charging cash machines
mobile phone
Fee-charging cheque-cashing
Using higher-cost credit9
SOCIAL RESEARCH PRACTICE // ISSUE 9 SPRING 2020
Stage 2: From hypothetical costs to lived costs
The final framework enabled us to calculate representative costs of each poverty premium component
if they were incurred by lower-income households: the nominal costs of the poverty premium. It also
enabled us to design questions to measure exposure to the poverty premium in the lived experiences
of lower-income households.
The nominal costs of the poverty premium
Nominal costs allocated to each component needed to be single, but typical, extra costs that a lower-
income household would have to pay to access goods and services as a result of their lower incomes.
This involved an extensive desk exercise, calculating costs for a range of comparable products from
a range of providers.
While the calculations were often complex (see Davies et al, 2016c) they were nonetheless underpinned
by some general principles. The premium was calculated by comparing the cost incurred by mainstream
or non-poor customers (a low-cost benchmark) with the cost incurred by customers on lower incomes.
For some components, such as cash machine charges, the benchmark was zero. For others, such as
household fuel, we used a typically low-cost option as the benchmark, but not the lowest in case this was
not widely accessible. When using price comparison websites to source prices, we used the average of
the lowest options returned; when using provider websites, we took neither the lowest nor the highest;
when a single provider dominated the market, we used that provider’s cost. These principles ensured
the conservative calculation of nominal costs (appendix A).
Prevalence of the poverty premium and the lived costs
The resulting nominal costs illustrated the potential depth of the lived experience of the poverty premium,
that is, how costly it is when it is incurred. However, these costs remained hypothetical unless low-income
households actually incurred them.
Our key innovation when calculating the lived costs of the poverty premium was to estimate the
prevalence of lower-income households’ exposure to it. This was achieved through a nationally
representative survey of lower-income households to measure households’ experiences of the
components in our framework.
The survey found that the poverty premium is widely experienced: nearly all lower-income households in
2016 (99%) had experienced at least one additional cost because they were poor. Nonetheless, exposure
to the individual components varied considerably, from less than 1% of lower-income households
incurring a premium from using a pawnbroker to 52% of households who paid more for home contents
and car insurance because they lived in a deprived area (appendix A).
For each component, therefore, the survey findings provide a measure of the breadth of the poverty
premium experience (percentage of households experiencing it). When applied against the depth of
that experience (the nominal cost of the component) we could calculate the average, lived cost of each
component. Calculating the costs of individual poverty premium components in this way enabled us to
estimate the scale of the poverty premium as a realistic reflection of the lived experience of lower-income
households; for the very first time. Across all components, the average total poverty premium lower-
income households incurred in 2016 was £490.
Compared with the previous hypothetical cost of the poverty premium of £1,300 (Save the Children,
2010), the estimated lived cost of the poverty premium to lower-income households by this new method
is much lower. However, it is still substantial. Moreover, our analysis showed how unevenly the poverty
premium was experienced across lower-income households. For example, for couple families with two
children it was estimated at £504 per year, or about 2.5% of average annual income. For a single-adult
household it was lower at £465 per year but represented 5.5% of their annual income.10
SOCIAL RESEARCH PRACTICE // ISSUE 9 SPRING 2020
Stage 3: from lived costs to lived experiences
Having estimated the average lived cost of the poverty premium and found it varied by family type,
we used cluster analysis to explore the unevenness of households’ experience of the poverty premium
further given their patterns of exposure to the individual components. The advantage of this, data-driven,
approach was the ability to analyse the large number of components simultaneously. It could, therefore,
account more adequately for the underlying heterogeneity in households’ poverty premium exposure
while still summarising their experiences meaningfully.
We undertook a two-stage cluster analysis to allocate lower-income households into groups, maximising
the similarity of poverty premium exposure within groups while maximising differences between them
(Davies et al, 2016b). This returned seven groups, typifying seven distinct patterns in the nature of
households’ experiences. The average poverty premium ranged from a large group incurring £350
(across three components on average) to a small group spending an estimated extra £750 (across
eight components, Figure 3). We nonetheless interpreted the groups primarily from the pattern of their
exposure. Alongside an analysis of each group’s typical socio-demographic and other characteristics,
this highlighted some of the reasons why some households may pay more than others. For the full
statistics underlying Figure 3, see Davies et al (2016a).
For example, ‘very highly exposed’ households (incurring a poverty premium of £750 on average) were
defined by their use of fuel prepayment meters, the use of higher-cost credit, and insurance-related
premiums. These were often tenants in their family years, living in multi-adult households and in work.
They were significantly more likely than average to own cars (adding to their exposure to insurance-
related premiums) and to make internet purchases. Together, this paints a picture of lower-income
consumers who were active across a number of spending areas, possibly as a result of active lifestyles.
Contrast this with the ‘involuntarily exposed’, who made up 20% of all lower-income households.
This group also incurred a high average poverty premium (£530), in this case across five components,
with fuel prepayment meters and higher-cost credit featuring highly. However, members of this group
were much more clearly drawn from lower occupations and had the lowest incomes of all the groups.
They were also less likely than others to have switched their fuel supplier; less likely than most groups
to have made recent internet purchases; and the least likely of all the groups to have a car or home
contents insurance. With their exposure to the poverty premium high relative to their means, this group
was apparently financially constrained. Therefore, while households in severe poverty pay a lower poverty
premium, it is because they cannot afford some of the goods and services that incur poverty premiums
or else are excluded in some other way.11
SOCIAL RESEARCH PRACTICE // ISSUE 9 SPRING 2020
Figure 3: A typology of the poverty premium experience
Poverty premium experience Average Wider characteristics Share of
exposure lower-income
households
‘Very highly exposed’ £750 Typically in work, tenants, 7%
car-owning and digitally-
Defined by prepay meters, 8 components
engaged
insurance, fee-charging cash
machines and higher-cost credit
‘Highly exposed’ £560 Typically families, 7%
especially lone parents,
Defined by deprived area 8 components
in non-metropolitan
insurance, reliance on
urban areas and
convenience stores, fee-charging
digitally-engaged
cash machines, higher-cost credit
and paper billing
‘Involuntarily exposed’ £530 Typically social tenants, 20%
lower occupations and
Defined by prepay meters 5 components
the lowest income
and higher-cost credit
‘Traditional money managers’ £520 Typically older, single- 7%
adult households on
Defined by non-standard 7 components
low-to-middle incomes,
payment methods, paper
outright owners and not
billing (fuel) and reliance
digitally-engaged
on convenience stores
‘Controlled fuel payers’ £500 A cross-section 14%
of households
Defined by non-standard billing 7 components
methods and non-standard
payment methods for fuel
‘Risk averse’ £500 Typically homeowners, 19%
in work with the highest
Defined by insurance-related 7 components
incomes of all and
components
digitally-engaged
‘Premium minimisers’ £350 A cross-section 26%
of households
Defined by typical or low 3 components
exposure across the components12
SOCIAL RESEARCH PRACTICE // ISSUE 9 SPRING 2020
Conclusions
This study has calculated the lived costs of the poverty premium to lower-income households in a
new measurement framework. In achieving this, it has conceptualised the pathways from poverty to
the poverty premium, and it has done so with the needs, choices and constraints of the lower-income
consumer at its heart. The use of a mixed-methods approach not only enabled the breadth and depth
of the poverty premium to be measured, but also ensured that any components identified in the previous
literature as falling within the poverty premium were tested and validated by people living on lower
incomes, rather than being imposed or assumed by the researcher.
As a result of taking this new approach, we have produced a much more realistic estimate of the poverty
premium, and highlighted important misconceptions about the sectors in which a poverty premium might
arise. We have found the poverty premium to be smaller than previous research has identified. However,
at £490 per household on average in 2016, and with very few lower-income households left untouched,
it is still substantial.
We have also identified significant heterogeneity in lower-income households’ experience of the poverty
premium. While these differences are often underpinned by households’ different needs, choices
and preferences, the apparent protection of some poorer households from some poverty premium
components is more than likely due to their inability to afford the essential goods and services that
carry a poverty premium; instead, they simply go without.
Being able to estimate the scale of the poverty premium as an accurate and realistic reflection of the lived
experience of lower-income households is important for the credibility of the poverty premium problem.
It has already gained traction in industry and policy circles, in helping to shape priorities for future policy
and practice. This includes informing the new Fair by Design Fund which aims to address the poverty
premium in fuel, finance and insurance markets by investing in ventures which provide alternative services
to people on low incomes (Joseph Rowntree Foundation, 2017).
Moreover, a process-driven framework allows for the continued measurement and monitoring of the
poverty premium as the policy and practice landscape changes. For example, since we first estimated
the poverty premium in 2016, a temporary price cap on non-fixed fuel prepayment meter deals was
introduced in 2017 to better align prices between payment methods. Another cap came into effect in
2019 for all customers on standard variable and default tariffs to reduce the penalty for customers who
do not switch (Ofgem, 2019).
In July 2018, we updated the nominal costs to evaluate the impact of the 2017 prepayment meter price
cap. We found that this cap has had a substantial effect on the gap between the average prepayment
meter tariff and the best prepayment meter tariff, reducing it from £229 to just £21. At this point in time,
the average prepayment meter tariff was, in fact, cheaper than the standard variable tariff paid by direct
debit. This has had a knock-on effect on the poverty premium overall, which reduced 15%. Nonetheless,
a gap of £174 annually remained between the average prepayment tariff cost and cost of the best online-
only, direct debit tariffs. The recalculation also highlighted a large increase in insurance poverty premiums,
through both geographical risk-based pricing and monthly payments.
Ultimately, a new methodology for measuring the poverty premium has not only produced a more
accurate description of the nature and extent of the contemporary poverty premium. It can also be
used to monitor the poverty premium experience of households over time. In doing so, it provides an
opportunity to assess how each market is evolving and the extent to which changes in policy and practice
– whether business-driven or from regulation – have been effective in protecting the poor in society.13
SOCIAL RESEARCH PRACTICE // ISSUE 9 SPRING 2020
Acknowledgements
Stakeholder group: William Baker (head of fuel poverty, Citizens Advice) Juliette Burroughs
(senior research and policy officer, National Energy Action) James Langford (strategy consultant,
PricewaterhouseCoopers) Steve O’Neill (group marketing director, PayPoint) Faith Reynolds (financial
services consumer panel) Katie Schmuecker (poverty programme manager, Joseph Rowntree
Foundation) Joseph Surtees (StepChange Debt Charity). Expert consultants: Professor Donald Hirsch
(Loughborough University) and Professor Elaine Kempson (emeritus professor, University of Bristol).
Co-researcher: Yvette Hartfree. Survey fieldwork: Penny Bowden and Ross Connell (Ipsos MORI).
References
Bevan Foundation. (2009). Paying the price of being poor. Ebbw Vale: Bevan Foundation.
Cambium Advocacy. (2015). Still addressing the poverty premium. Citizens Advice Scotland.
Caplovitz, D. (1963). The poor pay more: consumer practices of low-income families.
Free Press of Glencoe, Collier-Macmillan.
Citizens Advice (2018) The cost of loyalty: exploring how long-standing customers pay more
for essential services? Citizens Advice: London.
Davies, S., Finney A. and Hartfree, Y. (2016a). Paying to be poor: uncovering the scale and nature
of the poverty premium. University of Bristol, Oak Foundation.
Davies, S., Finney A. and Hartfree, Y. (2016b). Paying to be poor: uncovering the scale and nature
of the poverty premium: methodological appendix. University of Bristol, Oak Foundation.
Davies, S., Finney A. and Hartfree, Y. (2016c). Paying to be poor: uncovering the scale and nature
of the poverty premium: costing appendix. University of Bristol, Oak Foundation.
Davidson, S., Hockaday, C., Ozgul, I. and Setterfield, L. (2016). Poverty premium in Scotland.
Ipsos MORI. Scotland: Edinburgh.
Finney, A. and Hayes, D. (2015). Financial capability in Great Britain 2010-2012. ONS.
Gregory, R. (2015). The poor pay more – prepayment meters and self-disconnection.
Christians Against Poverty: Bradford.
Helsper, E. (2008). Digital inclusion: an analysis of social disadvantage and the information society,
Department for Communities and Local Government: London.
Hirsch, D. (2013). Addressing the poverty premium – approaches to regulation.
Consumer Futures: London.
Joseph Rowntree Foundation. (2016). UK poverty: causes, costs and solutions.
Joseph Rowntree Foundation: York.
Joseph Rowntree Foundation. (2017). ‘Poverty premium: New Fair By Design Fund aims to raise £20m
and disrupt markets’. Online: https://www.jrf.org.uk/press/poverty-premium-new-fair-design-fund-
aims-raise-20m [Accessed 4 February 2020].
McBride, K. and Purcell, S. (2014). Food, fuel, finance – tackling the poverty premium.
Church Action on Poverty: Salford.
Ofgem. (2019). ‘Default tariff cap – information for suppliers’. Online: https://www.ofgem.gov.uk/
electricity/retail-market/market-review-and-reform/default-tariff-cap-information-suppliers
[Accessed 4 February 2020].14
SOCIAL RESEARCH PRACTICE // ISSUE 9 SPRING 2020
Richards, B. (2015). Bargaining on a low-income – a better deal for consumers.
Social Market Foundation: London.
Save the Children and Family Welfare Association. (2007). The poverty premium –
how poor households pay more for essential goods and services. Save the Children: London.
Save the Children. (2010). The UK poverty rip-off – the poverty premium 2010.
Save the Children: London.
Strelitz, J. and Lister, R. (eds.) (2008). Why money matters: family income, poverty and children’s lives.
Save the Children: London.
Stewart, T. (2010). ‘Addressing financial exclusion among families living in poverty’.
Journal of Poverty and Social Justice, 18(2): 185-92.
Tinson, A., Kenway, P., Bushe, S. and MacInnes, T. (2014). Poverty and the cost of living:
an evidence review. Joseph Rowntree Foundation: York.
Townsend, P. (1979). Poverty in the United Kingdom. Allen Lane: London.
Toynbee Hall. (2014). The poverty premium in Tower Hamlets. Toynbee Hall: London.15
SOCIAL RESEARCH PRACTICE // ISSUE 9 SPRING 2020
Appendix A: the nominal and lived costs of the poverty premium
Poverty premium component Nominal % of Average
annual cost households lived cost
incurring it
Non-standard payment methods
Fuel prepayment meter: electricity £35 32 £11
Fuel prepayment meter: gas £35 27 £9
Payment on receipt of bill: electricity £38 7 £3
Payment on receipt of bill: gas £38 7 £3
Monthly insurance payments: home contents £9 32 £3
Monthly insurance payments: car £81 31 £25
Fee-charging prepaid cards £25 3 £1
Non-standard billing methods
Paper billing: electricity £5 26 £1
Paper billing: gas £5 24 £1
Paper billing: landline/broadband £23 28 £6
Paper billing: mobile phone £23 13 £3
Product and service choices
Not switching fuel supplier in last 2 years £317 73 £233
Best prepayment meter tariff £227 8 £18
Best payment on receipt tariff £43 1 £16
SOCIAL RESEARCH PRACTICE // ISSUE 9 SPRING 2020
Poverty premium component Nominal % of Average
annual cost households lived cost
incurring it
Access to cash
Fee-charging cash machines £25 27 £7
Fee-charging cheque-cashing £30 4 £1
Higher-cost credit: rent-to-own £315 2 £7
Higher-cost credit: payday loans £120 1 £2
Higher-cost credit: home collection £540 3 £17
Higher-cost credit: pawnbroking £5017
SOCIAL RESEARCH PRACTICE // ISSUE 9 SPRING 2020
Using vignettes to examine
preferences for paying for
long-term social care in online
and interview surveys
Bob Erens, London School of Hygiene & Tropical Medicine; Sanna Read,
London School of Economics and Political Science; Martin Knapp, Gerald Wistow
and Raphael Wittenberg, LSE; Nicholas Mays, LSHTM
Abstract
A novel approach using ‘vignettes’ to elicit public attitudes towards paying for long-term social care for
older people was administered in two surveys: 1) for people aged 18-75, a web survey using an online
volunteer panel; and 2) for older people aged 65+, a face-to-face interview was included within a national
random location omnibus survey. Given the different sampling approaches and modes of data collection,
we examined whether our key results differed between the two surveys by comparing responses for the
65-75 age group that was included in both. While responses to the vignettes were significantly different in
the two surveys, after adjusting for differences in socio-demographic characteristics, the vignette results
were comparable. The variations in response between the surveys thus appear to be due to differences
in sample profile rather than to measurement differences due to survey mode.
Funding acknowledgement
This paper is based on independent research commissioned and funded by the National Institute for
Health Research (NIHR) Policy Research Programme via its core support for the Policy Innovation &
Evaluation Research Unit (PIRU) (102/0001). The views expressed in the publication are those of the
authors and are not necessarily those of the NIHR or the Department of Health and Social Care.18
SOCIAL RESEARCH PRACTICE // ISSUE 9 SPRING 2020
Introduction
Survey aims
Unlike the NHS in England, which is free at the point of delivery, social care is means-tested, and only
people on lower incomes and with no or few capital assets receive funding from the state to cover some
or all of the costs of meeting some or all their care needs. In addition, about half of those receiving
formal social care in England privately financed at least part of their care costs (Charlesworth and
Johnson, 2018). Cuts to public social care funding since 2009 (Phillips and Simpson, 2017), combined
with growing demand for social care, have reinforced – indeed amplified – views among the public and
policymakers that changes to social care funding systems are required.
Previous research into the public’s views on social care funding has shown that:
◗ Public understanding of the current system is poor, with many adults believing that social care costs,
like health care, are almost entirely funded by the state (Bottery et al, 2018; Ipsos MORI, 2018;
Gregory, 2014; IPPR, PriceWaterhouseCoopers, 2011)
◗ Few adults save over the long-term in order to pay for social care costs, should the need arise
(Ipsos MORI, 2016)
◗ Most adults in England do not think their housing assets should be used to fund social care
(as they may be in the current system) (Overton and O’Mahony, 2017)
◗ Most people say they do not want to rely on informal (that is, unpaid) care from family members
when they are older (Bottery et al, 2018; Ipsos MORI, 2018)
However, there is limited consensus among the public and policymakers on a number of key issues,
including the balance between individual and state funding responsibilities; the level of income or assets
above which individual service users should be expected to contribute to their own care costs; and
whether there should be an upper limit on the costs that users should be required to pay. This last is
important as lifetime care costs are £100,000+ for about 10% of adults (Commission on Funding of
Care & Support, 2011). Research on future funding options is often hampered both by the lack of public
understanding of how the current complex system works and by the implications of proposals for change
in the tax and inheritance systems, as well as their distributional consequences (for example between
different age groups and socio-economic groups) and the consequences for overall public expenditure.
Over the past few years, the Department of Health and Social Care (DHSC) in England has been
examining a range of policy options for reforming the current system of paying for social care. To inform
the policy process, the DHSC commissioned the Policy Innovation & Evaluation Research Unit (PIRU)
to carry out a survey among the general population to secure greater understanding of public attitudes
to financing social care for older people. Our study took a novel approach and attempted to simplify
the process of eliciting survey respondents’ views by starting from a ‘blank slate’ (that is, disregarding
the current means tests for income and assets) and asking them to focus on only three key personal
parameters – income, savings and housing assets – when deciding whether the state, the service user,
or a mixture of both, should pay for the social care costs of an older person. After a very brief description
of the current system in England, respondents were shown four situations, or vignettes, describing the
social care needs of an older person, and in each vignette, one of the parameters was varied while the
other two remained the same. The vignettes are described more fully below. A key aim of the research
was to look at the factors associated with differing attitudes to paying for care, such as age, partnership
status, ethnicity, socio-economic position, health status and experience of informal caring.19
SOCIAL RESEARCH PRACTICE // ISSUE 9 SPRING 2020
Methodological issues
Given time and cost constraints, the research team decided to administer the vignettes using Kantar’s
online panel. The use of online panels to carry out surveys of the general population has increased
significantly over the past 20 years, initially in the market and social research sectors, and more recently
among academic researchers. Despite concerns over possible coverage, sampling and response bias
(Zack et al, 2019; MacInnis et al, 2018; AAPOR, 2010; Erens et al, 2014; Nicolaas et al, 2014; Yaeger et
al, 2011), the use of online surveys is likely to continue to increase because they allow relatively cheap
and quick data collection, which contrasts with the rising costs of traditional face-to-face interview
surveys at a time when response rates to such surveys are decreasing.
However, online surveys are not appropriate for all groups in the population, especially those without
access to the internet, which includes many older people in the UK and other countries (AAPOR, 2010;
Duffy et al, 2005; Hirsch et al, 2013; Bethlehem, 2010). Despite the inter-generational gap in internet
usage narrowing in the past decade, older adults in the UK are still the least likely to use the internet.
According to 2019 figures from ONS, 29% of adults aged 65 and older have never used the internet,
down from 58% in 2011 (compared with only a six percentage-point reduction to 2% for those aged
16-64) (Office for National Statistics, 2019). Among adults aged 75+, over half (53%) were not recent
(that is, in the last three months) internet users, compared with 17% of those aged 65-74 and only 1% of
individuals aged 16-44. In particular, older women are least likely to use the internet: among adults aged
75+, 46% of men and 59% of women had not used the internet in the past three months. Given the poor
coverage of older people in online surveys, we set an upper age limit for the online survey at 75 years.
In order to obtain the views of the large group of older people who are not internet users, we adopted
to carry out a separate survey of older people (65+) using face-to-face interviews. The interviews were
administered as part of Kantar’s continuous omnibus survey.
Having administered the vignettes in two surveys using different modes of data collection (online and
face-to-face) and different sampling approaches, the question arises as to how comparable the results
are from these surveys. Existing evidence shows that different survey modes may provide different
answers, even when the questionnaire administered is identical, as was the case in our surveys (Burkill
et al, 2016; Prah et al, 2015; Heerwegh and Loosveldt, 2008; Link and Mokdad, 2005). Also, there may
be differences due to the different sampling approaches used by our two surveys, particularly given
the considerable evidence showing that online panels made up of members who have volunteered (in
contrast to online panels that have been recruited using probability sampling methods) do not necessarily
provide good representation of the population in general, whether on socio-demographic characteristics
(some of which can be controlled for in online surveys by the setting of quota controls), or on the variables
of interest to the survey (MacInnis et al, 2018; Pennay et al, 2018; Schonlau and Couper, 2017; Sturgis
et al, 2016; Erens et al, 2014; Yaeger et al, 2011; AAPOR, 2010; Chang and Krosnik, 2009). Previous
studies have shown that, compared with the general population, online panel members over-represent
those who are voters, white, active internet users, in better health, have a higher income and more
education, among other characteristics (which may vary from country to country) (Couper, 2017;
AAPOR, 2010; Callegaro et al, 2014; Pennay et al, 2018; Zack et al, 2019; Duffy et al, 2005).
This paper, therefore, aims to:
◗ Describe the study’s methodology including the achieved sample sizes and representativeness
of both the online and interview surveys, as well as provide details of the vignettes and the derivation
of analysis variables
◗ Describe the differences in the results between the two surveys and explore whether these are
due to differences in survey mode and/or sample characteristics
The second objective is achieved by examining vignette responses and socio-demographic
characteristics for the 65-75 age group that was included in both the online and interview surveys.20
SOCIAL RESEARCH PRACTICE // ISSUE 9 SPRING 2020
Methods
Study design
In collaboration with Kantar, Public Division, we carried out two surveys of the general population in
England. The first used the online panel run by the Kantar Profiles Division which numbers over 150,000
adults. Panel respondents are invited to take part in surveys by email and are incentivised with points
which they can later trade for vouchers. The online survey aimed to achieve a sample of 3,000 individuals
aged 18 to 75, split equally between men and women, and with quotas set for age in order to be
representative of the population of England (18-24, 13%; 25-34, 19%; 35-44, 18%; 45-54, 20%;
55-64, 16%; 65-75, 14%). The online survey was administered from 6 to 19 December 2018.
Given the relatively high percentage of older adults who do not use the internet, we included the same
questions on Kantar’s continuous face-to-face interview omnibus survey as we felt that would provide a
more robust sample than an online survey of an older group. The omnibus survey is carried out weekly
among a cross-section of adults aged 16+ living in private households in the UK. Each survey covers a
range of topics. The omnibus survey uses a random location sample design (a form of quota sampling).
The sample frame consists of the postcode address file (PAF), from which clusters of a small set of
homogenous streets are selected. Interviewers are given a list of addresses in these streets at which they
must call, in order to restrict interviewer discretion in where they carry out interviews. Interviewers are also
instructed to work during different days of the week and times of day when completing their assignments.
Quotas (on region, gender, age, working status, and whether there are children in the household) are set
for each interviewer assignment to help prevent natural variations in response propensity. Our module
of questions on funding social care was completed by the 466 respondents aged 65+ years who were
interviewed as part of the omnibus survey between 30 November and 4 December 2018.
Representativeness
Comparing the achieved samples with independent population data suggests that both the online
(general population) and interview (older people) surveys provide reasonable representation of the target
populations, at least for the socio-demographic variables for which reliable external data are available.
Tables 1 and 2 show how the samples compare (although the comparisons may not be exact due to
differences in the questions between the online and interview surveys and those used for the external
comparisons). The online survey sample (Table 1) shows under-representation of young men (especially
ages 18-34) and older women (ages 45-75), residents in London, non-white adults, adults who were
married/cohabiting, adults who own their property with a mortgage, adults with no formal educational
qualifications and adults in full-time work. By contrast, the groups who are over-represented in the online
survey include older men (ages 45-64), younger women (especially ages 18-34), residents in northern
England, white adults, adults who are not married/cohabiting, and adults who are unemployed. However,
the differences between the online survey and external population data for these socio-demographic
variables are generally quite small.21
SOCIAL RESEARCH PRACTICE // ISSUE 9 SPRING 2020
Table 1: Socio-demographic comparison of achieved online survey sample with independent population data
Online survey Population data Difference
achieved (survey –
sample3 population)
n=3000
Gender1 % % %
Men 50.0 49.6 0.4
Women 50.0 50.4 -0.4
Age within gender1
All
18-24 13.0 12.0 1.0
25-34 19.0 19.1 -0.1
35-44 18.0 17.8 0.2
45-54 20.0 19.4 0.6
55-64 16.0 16.6 -0.6
65-75 14.0 15.0 -1.0
Men
18-24 8.0 12.5 -4.5
25-34 15.3 19.4 -4.1
35-44 17.1 17.9 -0.8
45-54 22.6 19.3 3.3
55-64 22.6 16.4 6.2
65-75 14.3 14.6 -0.3
Women
18-24 18.0 11.6 6.4
25-34 22.7 18.8 3.9
35-44 18.9 17.8 1.122
SOCIAL RESEARCH PRACTICE // ISSUE 9 SPRING 2020
Online survey Population data Difference
achieved (survey –
sample3 population)
45-54 17.4 19.5 -2.1
55-64 9.4 16.8 -7.4
65-75 13.7 15.5 -1.8
Region1
North East 5.6 4.8 0.8
North West 13.6 13.0 0.6
Yorkshire & Humberside 10.0 9.8 0.2
East Midlands 10.1 8.6 1.5
West Midlands 10.1 10.4 -0.3
East of England 10.9 10.9 0.0
London 13.0 16.2 -3.2
South East 16.0 16.2 -0.2
South West 10.7 10.0 0.7
Ethnic group2
White 90.9 85.6 5.3
Mixed 2.2 1.2 1.0
Asian/Asian British 3.8 7.2 -3.4
Chinese 0.7 0.6 0.1
Black/African/Caribbean/Black British 1.8 3.4 -1.6
Other 0.6 1.9 -1.3
Marital status2
Married/civil partnership/cohabiting 60.8 64.9 -4.1
Single/separated/widowed/divorced 39.2 35.1 4.1
Tenure223
SOCIAL RESEARCH PRACTICE // ISSUE 9 SPRING 2020
Online survey Population data Difference
achieved (survey –
sample3 population)
Own outright 34.1 29.6 4.5
Mortgage/loan 26.6 36.4 -9.8
Part rent 1.8 0.7 1.1
Rent 35.1 32.6 2.5
Other 2.3 0.8 1.5
Highest educational qualification2
Degree or higher (or equivalent) 42.1 40.3 1.8
Other 53.0 51.6 1.4
No formal qualifications 4.9 8.1 -3.2
Employment status2
Working full time 44.7 50.6 -5.9
Working part time 18.5 17.2 1.3
Unemployed 9.4 2.8 6.6
Inactive 27.4 29.5 -2.1
1
Population data based on ONS mid-term population estimates for 2018 for ages 18-75.
2
Population data based on Annual Population Survey (APS) 2018 for ages 18-75.
3
The survey data are unweighted.
Table 2 shows the same comparisons with population data for the achieved interview sample of
older people aged 65+. The interview sample of older adults shows the following groups to be under-
represented: women; men aged 75-84; women aged 85+; older adults who are married/cohabiting; older
adults who are home owners; older adults with any educational qualifications; and older adults in work.
By contrast, the groups who are over-represented include: men; women aged 75-84; older adults in
the northern parts of England (aside from the North East); older adults who are not married/cohabiting;
older adults who live in rented accommodation; those with no formal educational qualifications; and older
adults who are inactive/retired. As for the online survey, the differences between our older adult sample
and older adults in the general population are generally quite small.24
SOCIAL RESEARCH PRACTICE // ISSUE 9 SPRING 2020
Table 2: Socio-demographic comparison of achieved interview survey sample for older people aged 65+
with independent population data
Interview Population data Difference
survey achieved (survey –
sample3 population)
n=466
Gender1 % % %
Men 50.2 45.7 4.5
Women 49.8 54.3 -4.5
Age within gender1
All
65-74 55.6 54.5 1.1
75-84 31.8 32.1 -0.3
85+ 12.7 13.4 -0.7
Men
65-74 59.4 57.5 1.9
75-84 27.4 31.8 -4.4
85+ 13.2 10.7 2.5
Women
65-74 51.7 52.0 -0.3
75-84 36.2 32.3 3.9
85+ 12.1 15.7 -3.6
Region1
North East 2.8 5.1 -2.3
North West 16.1 13.3 2.8
Yorkshire & Humberside 11.8 10.0 1.8
East Midlands 11.2 9.1 2.125
SOCIAL RESEARCH PRACTICE // ISSUE 9 SPRING 2020
Interview Population data Difference
survey achieved (survey –
sample3 population)
West Midlands 9.7 10.7 -1.0
East of England 12.2 12.0 0.2
London 9.9 10.4 -0.5
South East 14.8 17.3 -2.5
South West 11.6 12.1 -0.5
Ethnic group2
White 94.6 95.2 -0.6
Mixed 0.4 0.2 0.2
Asian/Asian British 2.4 2.5 -0.1
Chinese 0.2 0.2 0
Black/African/Caribbean/Black British 2.2 1.3 0.9
Other 0.2 0.5 -0.3
Marital status2
Married/civil partnership/cohabiting 55.2 62.9 -7.7
Single/separated/widowed/divorced 44.8 37.1 7.7
Tenure2
Own outright 73.4 76.2 -2.8
Mortgage/loan 2.4 5.0 -2.6
Part rent 0.2 0.3 -0.1
Rent 24.0 17.4 6.6
Other 0.0 1.0 -1.0
Highest educational qualification2
Degree or higher (or equivalent) 22.8 32.3 -9.5
Other 38.4 48.6 -10.2You can also read


