A Social Media Study on Demographic Differences in Perceived Job Satisfaction
←
→
Page content transcription
If your browser does not render page correctly, please read the page content below
A Social Media Study on Demographic Differences in
Perceived Job Satisfaction
KOUSTUV SAHA, Georgia Institute of Technology, USA
ASRA YOUSUF, Georgia Institute of Technology, USA
LOUIS HICKMAN, Purdue University, USA
PRANSHU GUPTA, Georgia Institute of Technology, USA
LOUIS TAY, Purdue University, USA
MUNMUN DE CHOUDHURY, Georgia Institute of Technology, USA
Effective ways to measure employee job satisfaction are fraught with problems of scale, misrepresentation,
and timeliness. Current methodologies are limited in capturing subjective differences in expectations, needs,
and values at work, and they do not lay emphasis on demographic differences, which may impact people’s
perceptions of job satisfaction. This study proposes an approach to assess job satisfaction by leveraging
large-scale social media data. Starting with an initial Twitter dataset of 1.5M posts, we examine two facets of
job satisfaction, pay and supervision. By adopting a theory-driven approach, we first build machine learning
classifiers to assess perceived job satisfaction with an average AUC of 0.84. We then study demographic
differences in perceived job satisfaction by geography, sex, and race in the U.S. For geography, we find that
job satisfaction on Twitter exhibits insightful relationships with macroeconomic indicators such as financial
wellbeing and unemployment rates. For sex and race, we find that females express greater pay satisfaction but
lower supervision satisfaction than males, whereas Whites express the least pay and supervision satisfaction.
Unpacking linguistic differences, we find contrasts in different groups’ underlying priorities and concerns,
e.g., under-represented groups saliently express about basic livelihood, whereas the majority groups saliently
express about self-actualization. We discuss the role of frame of reference and the “job satisfaction paradox”,
conceptualized by organizational psychologists, in explaining our observed differences. We conclude with
theoretical and sociotechnical implications of our work for understanding and improving worker wellbeing.

CCS Concepts: • Human-centered computing → Empirical studies in collaborative and social computing;
Social media; • Applied computing → Psychology.

Additional Key Words and Phrases: job satisfaction, demographic differences, sex, gender, race, geography,
Twitter, social media, macroeconomic constructs, workplace

ACM Reference Format:
Koustuv Saha, Asra Yousuf, Louis Hickman, Pranshu Gupta, Louis Tay, and Munmun De Choudhury. 2021.
A Social Media Study on Demographic Differences in Perceived Job Satisfaction. Proc. ACM Hum.-Comput.
Interact. 5, CSCW1, Article 167 (April 2021), 29 pages. https://doi.org/10.1145/3449241

Authors’ addresses: Koustuv Saha, Georgia Institute of Technology, Atlanta, GA, USA, koustuv.saha@gatech.edu; Asra
Yousuf, Georgia Institute of Technology, Atlanta, GA, USA, ayousuf@gatech.edu; Louis Hickman, Purdue University,
West Lafayette, IN, USA, lchickma@purdue.edu; Pranshu Gupta, Georgia Institute of Technology, Atlanta, GA, USA,
prangupt@gatech.edu; Louis Tay, Purdue University, West Lafayette, IN, USA, stay@perdue.edu; Munmun De Choudhury,
Georgia Institute of Technology, Atlanta, GA, USA, munmund@gatech.edu.

Permission to make digital or hard copies of all or part of this work for personal or classroom use is granted without fee
provided that copies are not made or distributed for profit or commercial advantage and that copies bear this notice and 167
the full citation on the first page. Copyrights for components of this work owned by others than ACM must be honored.
Abstracting with credit is permitted. To copy otherwise, or republish, to post on servers or to redistribute to lists, requires
prior specific permission and/or a fee. Request permissions from permissions@acm.org.
© 2021 Association for Computing Machinery.
2573-0142/2021/4-ART167 $15.00
https://doi.org/10.1145/3449241

 Proc. ACM Hum.-Comput. Interact., Vol. 5, No. CSCW1, Article 167. Publication date: April 2021.
167:2 Koustuv Saha et al.

1 INTRODUCTION
Every economy strives to ensure that the demand for employment is met, because jobs are not
just a source of income, but also an avenue for people to learn, grow, and prosper. Organizations
and policymakers increasingly recognize that promoting worker wellbeing is not merely good
for the worker, it can also improve organizational outcomes [42]. Therefore, these stakeholders
seek to foster a healthy work environment by offering a vibrant work culture, equal opportunities
for all, platforms to learn new skills, and miscellaneous other benefits [91]. Job satisfaction
is the primary indicator of worker wellbeing, that captures whether workers are doing well
at work, and is closely associated with positive work experiences, job performance, and career
success [17, 21, 73, 89, 114]. While job satisfaction is known to positively impact one’s performance
and wellbeing, job dissatisfaction could result in decreased motivation and commitment, resulting
in poorer outcomes [35, 74, 103]. For these reasons, countries seek to assess population-level worker
wellbeing to complement economic indicators, and job satisfaction is a critical component [43].
 However, assessing job satisfaction suffers from challenges. Current practices include conducting
self-report surveys. These methods are expensive, intrusive, time-consuming, lack the temporal
granularity to be actionable, and have substantially low response rates (9% within the U.S.) [8,
12, 144]. When conducted within an organization, respondents’ privacy concerns are amplified,
leading to social desirability and non-response biases, and under-representation of counter-views
or less popular opinions [55, 75]. Typical job satisfaction measures summarize multi-dimensional
information into a single metric, however, individuals lay varying importance to different aspects
of jobs [149]. Cultural differences in people from varying geographic locales, race, and sex, may
also drive distinct beliefs and perceptions of one’s workplace [46, 149]. When these nuances are not
captured in existing summative approaches of assessing job satisfaction, it may lead to inaccurate
conclusions regarding fairness, equity, and inclusiveness at workplaces. Moreover, organizational
psychologists have argued that such surveys may suffer from the limitation of “oversimplification
of social reality” [115], and may misrepresent or suppress the voices of the underrepresented and
historically disadvantaged groups in the workforce, or their varied and unique experiences [150].
 This paper is motivated by the growing interest in understanding worker wellbeing at scale, as
well as by the observations in organizational science that differences in perceived job satisfaction
lie in individual differences in beliefs about careers, opportunities, concerns, and livelihood across
demographics. We leverage social media data to infer and study job satisfaction, since it enables
candid self-disclosure of personal and social experiences, and can provide us with inexpensive,
naturalistic, and non-intrusive open-ended data to measure worker wellbeing, particularly people’s
perceived job satisfaction. This paper targets the following research aims:
Aim 1: To assess perceived job satisfaction via social media data.
Aim 2: To study demographic differences in perceived job satisfaction by geography, sex, and race.
Aim 3: To examine linguistic differences in job satisfaction expressions between majority and
 minority demographic groups in the workforce.

 Recognizing that job satisfaction is a multi-faceted construct [145], we focus on two facets, pay
and supervision satisfaction. Pay forms a crucial element, as individuals often consider pay as the
most important aspect of their satisfaction [82]. Supervisor support is important in influencing
individuals’ wellbeing and can serve as a coping resource against stressors [139]. Our work collects
over one million Twitter posts related to self-expressed pay and supervision satisfaction. For our
first aim, we adopt a theory-driven approach to expert-annotate 12,000 pay-related and 11,000
supervision-related posts on 1) their relevance to job satisfaction, and consequently, 2) the valence
(positive or negative) of posts relevant to job satisfaction. We use the annotated data to build
machine learning classifiers (average AUC of 0.84) to infer perceived job satisfaction at scale.

Proc. ACM Hum.-Comput. Interact., Vol. 5, No. CSCW1, Article 167. Publication date: April 2021.
A Social Media Study on Demographic Differences in Perceived Job Satisfaction 167:3

 For the second aim, by focusing on U.S. based Twitter posts, we examine the demographic
differences in perceived job satisfaction by geography, sex, and race. For geography, we compare
job satisfaction on Twitter against state-wise macroeconomic and worker wellbeing indicators,
finding convergent validity for our measurement. We investigate the relationship between perceived
job satisfaction and sex, race, and sex-race intersections. For sex, we find that females show greater
pay satisfaction but lower supervision satisfaction than males, and for race, we find racial minorities
are more likely to show greater job satisfaction (in both facets) than Whites. We address our third
research aim by examining if social media language of different demographic groups explains
differences in the underlying priorities, concerns, and nuances that may affect their perceived job
satisfaction. We find that under-represented minorities largely express concerns regarding basic
livelihood and alternate income sources, whereas the historically privileged majorities express
concerns regarding self-actualization, professional development, and career opportunities.
 We situate our findings in the literature on worker wellbeing concerns, demographic differences,
frame of reference effects, and the well-known “job satisfaction paradox” [28, 72]. Our work reveals
how social media can function as a naturalistic data source to delineate multi-faceted workplace
concerns. We discuss the implications for understanding and improving workplace wellbeing, while
accounting for underlying demographic (i.e., sex, race, geography) differences. We revisit what job
satisfaction may mean to different people based on their (minority/majority) identities. To conclude,
we outline socio-technical interventions that can correct for biases due to differing expectations
and subjective interpretations of workplace experiences.
Privacy, Ethics, and Reflexivity. Because our work uses publicly accessible Twitter data without
any interaction with individuals whose data is analyzed, it did not qualify for ethics board approval.
However, we are committed to securing the privacy of the individuals in our dataset. This paper
uses de-identified data for analyses and presents paraphrased quotes to reduce traceability, yet
provide context in readership. We recognize the privacy and ethical sensitivities of our study since
we work with location, sex, and race attributes of social media users. We acknowledge that our
work considers only binary sex (male / female) and only the four major races in the U.S. This
is primarily because of the limits of state-of-the-art demographic attribute inference algorithms.
The concepts surrounding demographic groups also lack clear agreement, as there is no widely
agreed-upon guideline for sex and race representation in the scholarly literature. Our work can
be argued to be non-inclusive of certain marginalized communities or potentially reinforcing
stereotypes about certain demographic groups. However, as a team comprising social computing
and organizational psychology researchers who hold diverse gender, racial, and cultural identities,
we intend to showcase this work as a feasibility study of using social media to unpack underlying
cross-demographic differences in the perception of a workplace wellbeing metric (job satisfaction).
We believe our proposed methods can be extended to study other minority identities in the future
and identify the broader societal and structural factors contributing to the perceived differences.
Section 8 discusses the ethical implications and limitations further.

2 RELATED WORK
2.1 Job Satisfaction: Definition and Measurement
One of the early definitions of job satisfaction is credited to Locke who describes it as a pleasurable
or positive emotional state resulting from the appraisal of one’s job or job experiences [95]. While many
researchers consider job satisfaction to be an attitude towards one’s job [18], more recently Weiss
deconstructed it to include evaluative judgments, affective experiences, and beliefs about jobs [149].
Job satisfaction is widely studied in organizational sciences [62] and is related to employee stress [17],
affect [31], performance [73], and turnover [24].

 Proc. ACM Hum.-Comput. Interact., Vol. 5, No. CSCW1, Article 167. Publication date: April 2021.
167:4 Koustuv Saha et al.

 Although researchers and practitioners agree on the importance of job satisfaction, there are
some notable differences in how it has been operationalized and measured [145]. Job satisfaction
has been measured using a variety of instruments, including global instruments for jobs in general,
instruments for specific jobs, and instruments that tap multiple facets of job satisfaction [61, 116].
Over the years, researchers have been increasingly recognizing the importance of addressing the
multifaceted nature of job satisfaction, as reflected in scales such as the Job Diagnostic Survey [61]
and the Job Descriptive Index (JDI) [64]. The homogeneous nature of each facet, and their indepen-
dence from other facets, makes it possible to independently study the effects of macroeconomic
factors and workplace conditions on each facet. The JDI is the most widely used assessment of job
satisfaction, and encompasses multiple facets, including but not limited to: the work itself, pay,
promotion opportunities, supervision, and colleagues [64]
 Researchers have studied and compared the reliability and validity of different job satisfaction sur-
veys [7, 145, 149]. Scholars note that survey questions may not only be responded “carelessly” [86],
but also, because of their underlying parsimonious design, may not be interpreted the same way
across individuals and groups, which may bias survey response. More pertinently, the use of survey
methods for assessing job satisfaction at the population-level is limited. It is costly to implement
it at scale to assess job satisfaction with high temporal granularity (e.g., to estimate day-to-day
changes). Further, Pew survey estimates that response rates for surveys are very low (9% within the
U.S.) [8, 12, 144] and will get lower as time passes due to the use of caller ID and spam protection.
This leads to concerns of representativeness at large. Our work explores a different method to
address the issue of understanding population-level job satisfaction. We capture people’s naturalis-
tic, self-motivated and self-initiated expressions on social media to quantify their perceived job
satisfaction. By grounding our assessment in a theory-driven approach that captures facet-wise
job satisfaction, and validating it with macroeconomic indicators, we illustrate its potential as a
proactive tool to inform interventions for improving workplace wellbeing.

2.2 Antecedents and Determinants of Job Satisfaction
Given that we are interested in uncovering how different demographic groups express their per-
ception of job satisfaction on social media, we review prior research that has identified factors
associated with job satisfaction. Adopting a comprehensive approach, Agho et al. discussed sev-
eral determinants of job satisfaction. These encompass distributive justice, supervisory support,
organizational labor market, integration and coordination among coworkers, and pay [3]. Other
determinants of job satisfaction include organizational constraints [111], role constructs [83], work-
family conflict [14], work values [85], and work schedules [47]. While job satisfaction has primarily
been studied at the individual level, macroeconomic conditions affect job satisfaction as well. For
instance, higher unemployment rates lead to increased demands among the workers that remain
employed, resulting in lower job satisfaction [22, 137]. Further, average income levels in an area
affect overall job satisfaction [22], as greater income provides workers in that area with a resource
that helps them cope and protects them from other stressors [118].
 A body of research in this space also highlights group-level differences in job satisfaction across
demographic groups [19, 104]. Kaiser conducted a large-scale survey to understand job satisfaction
across Europe and found that women reported significantly higher job satisfaction than men, despite
women being more disadvantaged in the workforce of the countries considered in the survey [84].
Prior work found evidence of a job satisfaction paradox among under-represented, disadvantaged
minorities at work — these include the apparent inconsistency that women express greater job
satisfaction than men [28, 88], and Blacks more than Whites [11], despite them possessing worse
objective employment outcomes and conditions, measured in terms of pay, quality of life, and living
conditions [133, 135, 143]. Similarly, an early work by Hulin found that job satisfaction was higher

Proc. ACM Hum.-Comput. Interact., Vol. 5, No. CSCW1, Article 167. Publication date: April 2021.
A Social Media Study on Demographic Differences in Perceived Job Satisfaction 167:5

in relatively disadvantaged areas, explaining the counter-intuitive result based on the different
frames of references of the participants [72]. Focusing on geographical differences, Hulin studied job
satisfaction of people employed in the same job but at different locations, finding that 1) in relatively
advantaged areas, the job paid poorly compared to available alternatives, and the participants’
frame of reference suggested the job was a poor one, whereas 2) in relatively disadvantaged areas,
the job paid quite well, and the participants suggested the job was a good one [72].
 The above studies have focused on differential expectations as a prime determinant of these
demographic differences in job satisfaction. Indeed, theory regarding the job satisfaction paradox
has focused on workers’ expectations as the likely cause of the paradox [27]. A man and woman
with the same jobs and expectations would be expected to report identical job satisfaction, but Clark
argued that women’s expectations are lower than men’s for a variety of reasons, including traditional
gender roles [27]. Along the lines of these differences in perception, Usui found that while women
primarily focus on the pay and not the job amenities, men tend to appreciate both [143]. Also,
work values differ significantly across genders as men prioritize promotion prospects, pay and
security, whereas women greatly value good relations with managers, work itself, work hours,
and the ability to use one’s own initiative [27, 133]. In the case of ethnic minorities, studies have
found Hispanics in the U.S. to be more satisfied than Whites, given that some of them compare
their present income to their potential income in their country of origin [59, 92].
 Our work examines the demographic differences in perceived job satisfaction expressions on
social media. Social media data allows us to investigate linguistic cues that may be associated with
factors contributing to one’s perceived job satisfaction. By examining the language differences,
our work provides insights into the disparities in priorities and concerns of different demographic
groups that affect their frame of reference when perceiving job satisfaction.

2.3 Assessing Job Satisfaction and Worker Wellbeing using Social Media
Over a decade ago, John et al. envisioned that online interactions would rigorously evolve over
the years, where the individual and collective power of people to contribute and share content,
experiences, ideas, expertise, etc. would open up new research opportunities to study social con-
structs and sociological functioning [79]. A growing body of research has used social media data
to advance our understanding of wellbeing [32, 40, 122, 128]. Compared to surveys, social media
provides an unobtrusive means to study longitudinal, real-time, and naturalistic data at scale [56].
 Related to workplace wellbeing in particular, several studies in CSCW and HCI have leveraged
web and social media data to study employee behavior [26, 40, 71, 78, 99]. Ehrlich and Shami studied
employees’ motivations for using social media [48]. Employees interact and share opinions, and
express work practices on both internal and external social media platforms availing platform
affordances and design [140, 154, 155]. Prior studies report that social media use positively correlates
with workplace wellbeing [65, 120]. A series of studies at IBM examined employee engagement
on social media [44, 106, 107, 129]. A variety of language and network dynamic approaches have
investigated workplace wellbeing constructs, including employee engagement [106, 129], affect [40],
social pulse [130], reputation [76], role constructs [125], workplace culture [39, 60]. Recently, within
the context of the ongoing pandemic, Das Swain et al. studied how social media and ubiquitous
technologies can assist the wellbeing and productivity of remote workers [37].
 These studies reveal the value of using unobtrusive data sources in multi-dimensional evaluation
of worker wellbeing. In recent work, Jaidka et al. compared several approaches of social media
language based inferences against population-scale wellbeing estimates [77]. With respect to
employee job satisfaction, Hernandez et al. adopted dictionary-based methods to measure city-
level job satisfaction on Twitter [70], while Llorente et al. examined national-level unemployment
with Twitter data [94]. Recently, Foong et al. studied gender differences in pay expectations [52],

 Proc. ACM Hum.-Comput. Interact., Vol. 5, No. CSCW1, Article 167. Publication date: April 2021.
167:6 Koustuv Saha et al.

 Table 1. Seed keywords used to collect Twitter data on job satisfaction expressions.
 Facet Seed Keywords
 Pay pay raise, my raise, my pay, my salary, my income, my wage, got a raise, my bonus, got a bonus, my
 wages, get a raise, get a bonus, hourly pay, bump in pay
 Supervision my boss, my supervisor, my director, team lead, my team lead, my manager, my director, my foreman,
 my mngr, my mgr, my ceo

Fig. 1. Example word-trees built around “raise” and “boss” on snippets of Twitter posts in our dataset. The
font sizes are proportionate with relative occurrence.
and Maaranen and Tienari studied hyper-masculinity in work cultures via social media [97]. As
noted earlier, conventional techniques focus on smaller samples of the population and are not
representative of different subpopulations. Building on the above literature, our study bridges this
gap by offering a scalable approach for assessing job satisfaction. Our study further elucidates
demographic differences in perceptions of job satisfaction as reflected in social media language. We
gain insights on job-related concerns around geography, sex, and race, which collectively contribute
to CSCW’s long-standing interest in building technologies to improve workplace experiences.

3 COLLECTING SOCIAL MEDIA DATA ON JOB SATISFACTION EXPRESSIONS
This paper studies perceived job satisfaction as expressed on social media, particularly Twitter.
Twitter is one of the most popular social media platforms [58], and its public-facing, micro-blogging
based design enables candid self-disclosure and self-expressions [50]. For the purpose of the study,
we collect Twitter posts based on a list of pay and supervision related search terms curated using
keywords present in the Job Desriptive Index (JDI) and the Job in General Scale (JIG) [9, 64]. Table 1
reports the seed keywords for our data collection, corresponding to the two facets of job satisfaction
that we study- pay and supervision. Using these seed keywords, we employ the Twitter API to
collect a total of 939,101 posts containing keywords related to pay satisfaction and 573,554 posts
containing keywords related to supervision satisfaction. These posts pertain to the period between
January 2012 and December 2019 and were posted by 855,508 unique users (mean=1.77 posts per
user). We also collect each user’s name, location, and description. To give the reader a broad sense
of our dataset, we present example word-trees in Fig. 1 which show examples of post snippets of
how people express about “raise” and “boss” on Twitter. For example, we find expressions around
“pay raise”, “raise of taxes”, and “raise of minimum wage”, and around “my/our boss is [..]”.

4 AIM 1: MEASURING PERCEIVED JOB SATISFACTION ON TWITTER
4.1 Annotating Job Satisfaction on Twitter
In the absence of labeled ground-truth social media data on job satisfaction expressions, we adopt
a theory-driven annotation approach grounded in organizational science. We manually annotate

Proc. ACM Hum.-Comput. Interact., Vol. 5, No. CSCW1, Article 167. Publication date: April 2021.
A Social Media Study on Demographic Differences in Perceived Job Satisfaction 167:7

 Table 2. Example posts excerpts along with their relevance and valence annotation.
 Example Post Relevance Valence
 Pay-Related
 how the fuck have I spent 90% of my pay in 2 days Not Relevant NA
 I just remembered my bonus funds are reset for this semester Not Relevant NA
 I got overtime on this paycheck...We get a bonus on next paycheck.#WinWin Relevant Positive
 it may be years until the day, my dreams will match up with my pay Relevant Negative
 Supervision-Related
 I jut said I forged my mom’s signature In front of my supervisor Not Relevant NA
 God Bless all Small Businesses all work hard because Jesus is our Boss IJN Amen Not Relevant NA
 I LOVE my supervisor! Relevant Positive
 I cannot decide who do I hate the most among my father, my supervisor, and my ex. Relevant Negative

a random sample of 1.5% of our entire dataset: 12,000 Twitter posts related to pay and 10,000
posts related to supervision. Two coauthors, who are industrial-organizational psychologists,
designed a short frame of reference training for undergraduate research assistants, employed
as annotators. The training started with defining and describing job satisfaction and its facets
of pay and supervision satisfaction. Example scales for pay and supervision satisfaction facets
were presented, including the Minnesota Satisfaction Questionnaire [148] and the Job Descriptive
Index [64]. We explained the annotation scheme to the annotators, who then participated in practice
coding and received feedback. After the two annotators completed their coding, consensus was
reached through discussion by the two industrial-organizational psychologists. On this initial
curated dataset, our annotation approach included two further tasks on each post — 1) labeling
relevance (binary labels of relevant or irrelevant, to remove noisy posts unrelated to job satisfaction),
and 2) labeling valence (if a post expresses positive or negative pay/supervision satisfaction).
 Table 2 shows example posts, labeled relevant and irrelevant in our dataset. For annotating post
relevance, the raters show a high agreement of 92% for pay and 93% for supervision satisfaction.
Out of the initial sample of 12,000 pay-related posts, we find 2,244 (19%) posts to be relevant, and
out of the initial sample of 11,000 supervision-related posts, we find 1,337 (12%) posts to be relevant.
The same Table 2 also shows valence annotations for the relevant posts. For valence, the raters
again show a high agreement of 92% for pay satisfaction and 93% for supervision satisfaction posts.
We find a reasonably balanced distribution of positive and negative posts in our hand-labeled
dataset — 1,112:1,132 for the 2,244 relevant pay satisfaction posts and 759:578 for the 1,337 relevant
supervision satisfaction posts.

4.2 Building A Machine Learning Classifier of Job Satisfaction
To infer perceived job satisfaction in social media expressions at scale, we draw on natural language
analysis techniques to build machine learning classifiers on the annotated dataset. We describe our
approach, features, and models below.

4.2.1 Machine Learning Features. Inspired from several prior works in social media language [77,
123, 124, 128], our work uses three kinds of features:
Open-Vocabulary ( -grams). Open-vocabulary features have enabled several prediction studies
capturing rich linguistic expressions and descriptions of experiences [128]. These features are based
on keywords/phrases and their co-occurrences. We use the top 500 most frequent -grams ( =1,2,3).
Psycholinguistic Attributes (LIWC). Linguistic Inquiry and Word Count (LIWC) is a lexicon of
keywords grouped into a variety of psycholinguistic categories (50 in total) [136]. These categories
encompass affect, cognition and perception, interpersonal focus, temporal references, lexical density
and awareness, biological, personal, and social concerns.

 Proc. ACM Hum.-Comput. Interact., Vol. 5, No. CSCW1, Article 167. Publication date: April 2021.
167:8 Koustuv Saha et al.

Table 3. Median metrics of pay satisfaction classifiers in -fold ( =5) 1.0

cross-validation. 0.8

 True Positive Rate
 Model Relevance Valence 0.6

 Precision Recall AUC Precision Recall AUC 0.4

 Logistic Reg. 0.73 0.72 0.80 0.80 0.80 0.89 0.2
 KNN 0.81 0.63 0.70 0.72 0.72 0.81 Relevance
 Valence
 SVM (Linear) 0.73 0.73 0.81 0.80 0.80 0.89 0.0
 0.0 0.2 0.4 0.6 0.8 1.0
 Random Forest 0.83 0.65 0.80 0.72 0.74 0.82 False Positive Rate

 AdaBoost 0.83 0.66 0.80 0.79 0.79 0.87
 MLP 0.81 0.67 0.77 0.76 0.76 0.86 Fig. 2. ROC curves of pay sat-
 isfaction classifiers.
 Table 4. Top features of pay satisfaction classifier.
 Relevance Valence
 bless, bonus, check, constantly, get bonus, get raise, got food, increasing, need, pay, reduce, salary, spend, taxes,
 raise today, income, income tax, pay, pay check, pay raise, wage, LIWC: (Anger, Causation, 1st P. Pl., 2nd P., Fu. Tense,
 raise today, LIWC: (1st P., Work), reduce, tax, today, week Aux. Verb, Relative, Achievement), Sentiment: (Pos., Neg.)

Sentiment. Because our work concerns identifying satisfaction and dissatisfaction in language, we
include sentiment of text as a feature. We use Stanford CoreNLP’s deep learning based sentiment
analysis library [98] to label sentiment of a post as positive, negative, and neutral.

4.2.2 Modeling Approach. Using the above features, we train machine learning models for both
relevance and valence classification separately for the pay and supervision satisfaction data. We
consider multiple classifiers including Logistic Regression, K-Nearest Neighbors (KNN), Support
Vector Machine (SVM), Random Forest, Adaboost, and Multilayered Perceptron (MLP) models. We
conduct grid search and -fold ( =5) cross-validation for parameter tuning and evaluating our
models. We use K-best univariate statistical scoring model using mutual information to obtain
relative importance and statistical significance of features in our machine learning classifiers.

4.2.3 Classifying Pay Satisfaction. Table 3 reports the accuracy metrics of pay-related job satis-
faction predictions. The SVM classifier performs the best in case of both relevance (area under
receiver operating charateristic curve, AUC = 0.81) as well as valence (AUC = 0.89) classifications
(refer Fig. 2 for ROC curves). We use these classifiers to label our entire dataset. The relevance
classifier labeled 6.07% (56,977 out of 939,101) posts as relevant, out of which, the valence classifier
labeled 18,428 posts as positive (pay satisfaction) and 38,549 posts as negative (pay dissatisfaction).
 Table 4 reports the top features of the pay satisfaction classifiers. We find keywords contextually
related to pay, e.g., bonus, get raise. The presence of LIWC: 1st person pronoun indicates that instead
of capturing more general commentary on workplace pay, the classifier can capture self-expressions
of pay satisfaction, e.g., “y’all, i am excited to share that i got a raise and bonus at my job today!”.
Some of these features also appear in the valence classifier, along with emotional and affective
keywords, as revealed by the prevalence of sentiment and LIWC: Anger features, e.g., “it just makes
me superrr angry to see so much taxes deducted out of my pay check”. The valence classifier is also
dominated by LIWC categories of achievement, causation, and relative, which may suggest how
people psycholinguistically express needs, earnings, and competitiveness at work, e.g., “i do have a
problem because i need to do 2-3 jobs to achieve a living wage”.

4.2.4 Classifying Supervision Satisfaction. Table 5 reports the performance metrics of supervision-
related job satisfaction accuracy. The SVM models again perform the best in both relevance (AUC

Proc. ACM Hum.-Comput. Interact., Vol. 5, No. CSCW1, Article 167. Publication date: April 2021.
A Social Media Study on Demographic Differences in Perceived Job Satisfaction 167:9

Table 5. Median metrics of supervision satisfaction classifiers in -fold 1.0

( =5) cross-validation. 0.8

 True Positive Rate
 Model Relevance Valence 0.6

 Precision Recall AUC Precision Recall AUC 0.4

 Logistic Reg. 0.71 0.70 0.78 0.81 0.81 0.88 0.2
 KNN 0.88 0.52 0.69 0.75 0.75 0.82 Relevance
 Valence
 SVM (Linear) 0.75 0.76 0.80 0.81 0.82 0.87 0.0
 0.0 0.2 0.4 0.6 0.8 1.0
 Random Forest 0.88 0.53 0.75 0.81 0.81 0.83 False Positive Rate

 AdaBoost 0.88 0.57 0.78 0.77 0.77 0.85
 MLP 0.87 0.60 0.77 0.78 0.78 0.85 Fig. 3. ROC curves of supervi-
 sion satisfaction classifiers.

 Table 6. Top features of supervision satisfaction classifier.
 Relevance Valence
 ass, awesome, bitch, boss, congratulations, ceo, early, gave, amazing, best, bitch, boss, cool, congrats, fired, fuck, happy,
 go home, hiring, job like, leave, love, lunch, proud, seriously, hate, like, love, proud, shit, LIWC: (Anger, N. Affect, Swear,
 shift, shit, supervisor gave, team, team lead, tied team, told Negation, Quantifier, Achievement), Sentiment: (Pos., Neg.)

= 0.80) and valence (AUC = 0.87) classification. Fig. 3 shows the ROC curve of the supervision-
satisfaction classifier. After labeling the posts related to supervision satisfaction, we obtain 17.78%
(99,139 out of 573,554) relevant posts. Out of these 99,139 relevant posts, 37,305 posts express
supervision-satisfaction, and the remaining 61,834 posts express supervision-dissatisfaction.
 Table 6 reports the top features of the supervision-related satisfaction classifier. We observe
descriptive keywords about individuals, including profane connotations e.g., ass, bitch, cool. The
valence classifier shows the presence of emotional and career growth related keywords, e.g., “I just
hate it to ask leave from my supervisor. Hate this shit that takes so much out of me” and “My manager
is proud that the customer commended my work! I can enjoy the rest of the day.”.

5 PREPARING TWITTER DATA ON JOB SATISFACTION BY DEMOGRAPHICS
Our second and third research aims focus on studying the differences in the perception of job
satisfaction by demographics (geographical location, sex, and race). We limit our work at the level
of the states of U.S., consider binary sexes of male and female, and four major racial groups in the
U.S. — 1) Whites or Caucasians (Whites), 2) Blacks or African-Americans (Blacks), 3) Hispanics
or Latino (Hispanics), and 4) Asians and Pacific Islanders (APIs) [1]. As per the U.S. Bureau of
Labor Statistics (BLS: www.bls.gov) and by most conventional standards, the minorities and under-
represented demographic groups in the U.S. labor force are predominantly females and racial
minority groups [138]. For the purposes of our study, we identify and label Twitter posts by
demographic groups. We draw upon prior work and use manual validations to semi-automatically
label geographical location, sex, and race in our dataset [34, 41, 57, 105]. For the ease of exposition,
we elaborately describe our approach of labeling demographics in the Appendix A.
 By limiting our study to U.S.-only posts, we obtain a set of 21,506 pay-related posts and 32,335
supervision-related posts shared by unique individual usernames (Fig. 4a). For U.S.-only posts, we
label the sex and race of 49,426 and 31,195 individual usernames respectively (Fig. 4b and Fig. 4c).

6 AIM 2: PERCEPTION OF JOB SATISFACTION ACROSS DEMOGRAPHICS
We next move on to our second research aim to investigate the perception of job satisfaction
(as inferred via social media data) along geography. As described above, our machine learning
classifiers were used to machine label our datasets with expressed job satisfaction. Fig. 5 shows
pay and supervision satisfaction expressed as the proportion of positive (valence) job satisfaction

 Proc. ACM Hum.-Comput. Interact., Vol. 5, No. CSCW1, Article 167. Publication date: April 2021.
167:10 Koustuv Saha et al.

 Male White
 25383
 26841
 Blacks
 1505
 log (#posts)
 Hispanics
 3.5 Female
 2319
 3.0 API
 2.5 22585 1988
 2.0
 # Twitter Posts # Twitter Posts

 (a) Geographic Location (U.S. States) (b) Sex (c) Race

 Fig. 4. Distribution of Twitter posts from the U.S. by geography, sex, and race.

 Pay Satisfaction Sup. Satisfaction

 0.30 0.20
 0.35 0.25
 0.30
 0.40 0.35
 0.45 0.40
 0.50

 (a) Aggregated pay satisfaction (b) Aggregated supervision satisfaction

Fig. 5. Distribution of perceived job satisfaction (proportion of satisfied (positive valence) Twitter posts) by
U.S. states. Darker colors indicate greater job satisfaction aggregated at state-level.

posts over total number of posts throughout the U.S. – i.e., greater magnitudes indicate greater
number of posts that express positive job satisfaction. We find that state-wise pay and supervision
satisfaction both show a Pearson’s correlation ( ) of 0.21, revealing similar direction of variability
geographically, yet relative independence given the low magnitude of .

6.1 Job Satisfaction with respect to Macroeconomic Data by Geography
We now examine how perceived job satisfaction on social media varies by different geographical
locations in a macroeconomic context, i.e., if our measurement of job satisfaction from online
data reflects offline variations in measures of labor economics and worker wellbeing. We expect
Twitter-based job satisfaction to exhibit similar relationships with macroeconomic conditions
that self-reported job satisfaction does. However, prior research has not examined how these
relationships differ by satisfaction facet (i.e., pay and supervision). Drawing on the literature on
the interplay between job satisfaction and subjective wellbeing, we consider a variety of indicators.
 To study the relationship of these indicators with perceived job satisfaction on social media,
we conduct correlation and regression analyses. We separately aggregate pay and supervision
satisfaction (valence) values for each state by normalizing on the number of Twitter posts from
that state. We compute the Pearson’s correlation ( ) between pay and supervision satisfaction per
state against the macro-economic indicators. We further test this correlational relationship by
controlling for Twitter use per state. We use regression models that treat macroeconomic measures
as dependent variables, control for Twitter penetration rank [2], and use aggregated job satisfaction
measures per state as independent variables. Each linear regression models consist of 46 degrees of
freedom. We use correlation and linear regression because these provide interpretable associations
for conditionally monotonic relationships with outcome variables of interest (macroeconomic

Proc. ACM Hum.-Comput. Interact., Vol. 5, No. CSCW1, Article 167. Publication date: April 2021.
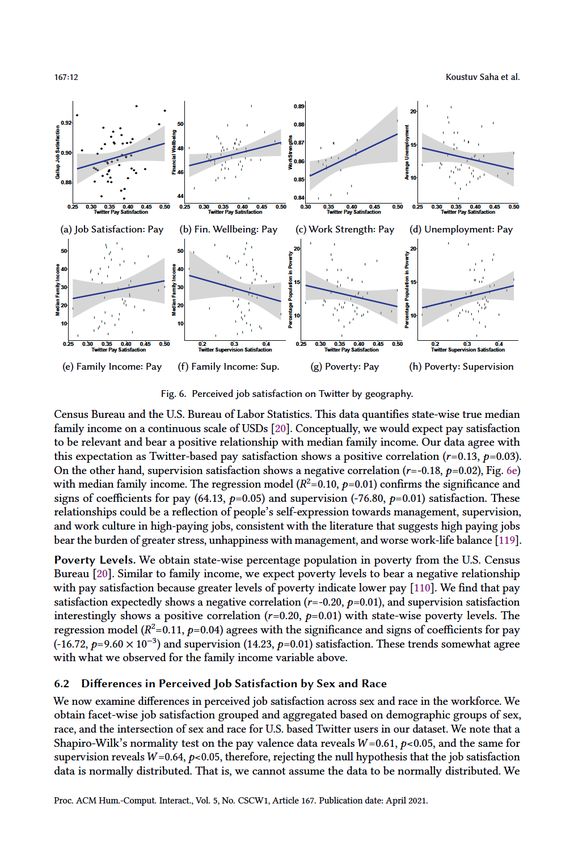
A Social Media Study on Demographic Differences in Perceived Job Satisfaction 167:11

indicators, in this case) [40, 125]. Along with a brief description and our rationale for conducting
each of these tests, we discuss our observations below:
Job Satisfaction. We examine the relationship of Twitter-based job satisfaction with survey-
based job satisfaction. We obtain survey-based job satisfaction data from the Gallup Healthways
Index [138], a nationally representative survey conducted on over 500K workers in the U.S., mea-
suring job satisfaction as a binary variable that we aggregated to a 0 to 1 scale at state level. Since
these metrics purport to measure similar constructs (i.e., overall job satisfaction or its facets), this
test can be considered a test of convergent validity [5, 113] and hence, we would expect a positive
correlation between the two measures. We find that Twitter-based pay satisfaction positively corre-
lates ( =0.25, =0.01) with job satisfaction (Fig. 6a), whereas Twitter-based supervision satisfaction
shows no significant correlation with job satisfaction ( =0.11). Similar relationship is also reflected
in the regression model ( 2 =0.44, =1.02 × 10⁻⁵ ) where pay satisfaction shows a significant positive
coefficient (0.14, =0.01).
Financial Wellbeing. We examine the relationship between Twitter-based job satisfaction and
financial wellbeing. We use state-wise financial wellbeing data published by Gallup [132, 138], which
measures the percentage of people in an area who consider themselves financially excellent/good
(against fair/poor). We would expect pay satisfaction to have a positive association with financial
wellbeing [109], whereas there is no clear theoretical relationship between supervision satisfaction
and financial wellbeing. Our results indicate that Twitter-based measure of pay satisfaction shows
a high positive correlation ( =0.29, =0.03, Fig. 6b) with significance, while supervision satisfaction
shows no significant correlation ( =0.69) with financial wellbeing. The regression model ( 2 =0.14,
 =9.82 × 10⁻³ ) confirms the significance and positive coefficient for pay satisfaction (10.14, =0.02).
Employees’ Strengths. Employees’ Strengths Index is a measure of the extent to which one is able
to use (or not use) their strengths at work everyday, with higher scores indicating higher agreement
with the statement, “At work, do you get to use your strengths to do what you do best every day,
or not?” [134]. We obtain U.S. state-wise employee strengths from Gallup Employee Engagement
survey [134]. We find a strong positive correlation of pay satisfaction ( =0.48, =0.01, Fig. 6c). The
regression model ( 2 =0.26, =2.81 × 10⁻⁴ ) confirms the significance and positive coefficient for
pay satisfaction (0.08, =0.01). However, we find that supervision satisfaction shows no significant
relationship with employees’ strength ( =0.14), contrary to prior work that found that employees’
strength increases when managers focus on employees’ strengths and positive characteristics, as
opposed to their weaknesses and negative characteristics [134].
Unemployment Rate. Unemployment is a critical construct in macroeconomics and social sci-
ence [146], and it has historically shared an interesting relationship with job satisfaction, varying
over time, place, and context [24]. Unemployment is closely associated with employee retention and
turnover, which are important correlates of job satisfaction [149]. We use state-wise unemployment
rates (as percentages), averaged over seven years (2012-19), published by the Bureau of Labor
Statistics (www.bls.gov). We find that while supervision satisfaction shows no significant correlation
( =0.77), pay satisfaction shows a significantly high negative correlation ( =-0.46, =8.84 × 10⁻⁵ ,
Fig. 6d) with unemployment rate. The regression model ( 2 =0.35, =2.27 × 10⁻⁵ ) confirms the
significance and negative coefficient for pay satisfaction (-8.78, =3.87 × 10⁻³ ). This finding aligns
with prior work that postulates that job satisfaction negatively correlates with unemployment:
As unemployment rates decrease, workers can charge a premium for their labor and have a more
alternative job opportunities, leading to greater job satisfaction [4].
Family Income. A state’s true median family income corresponds to family income adjusted for
cost of living. We obtain this data from the Current Population Survey jointly sponsored by the U.S.

 Proc. ACM Hum.-Comput. Interact., Vol. 5, No. CSCW1, Article 167. Publication date: April 2021.
1 6 7: 1 2 K o ust u v S a h a et al.

 ● ● 0. 8 9 ●
 ●
 ●
 20
 ●
 ●
 ●
 0. 9 2 ● 50 ● ● 0. 8 8
 ● ●
 ● ●
 ●

 A v er a g e U n e m pl o y m e nt
G all u p J o b S ati sf a cti o n

 ● ● ● ● ●

 Fi n a n ci al W ell b ei n g
 ●
 ● ●
 ● ● ● ●

 W or k Str e n gt h s
 ● ●
 ●
 ●● ● ● ● ● ●● ●
 ● ●
 ● 0. 8 7 ●●
 15
 ●
 ●
 ●●
 ●

 ●
 ● 48 ● ●
 ● ●
 ● ● ● ● ●
 ● ●
 ●

 0. 9 0 ●
 ● ●
 ● ●
 ●
 ● ● ● ●
 ●
 ●● ● ● ● ● ●
 ● ● ● ●
 ●
 ●● ●
 ● ● ●
 ●
 ●
 ●
 ●
 ● ●
 0. 8 6 ●
 ●
 ●
 ●
 ●
 ● ●

 ● ● ● ● ●
 ● ●
 ●● ● ● ● ● ● ●
 ● ● ● ● ● ●
 ●
 ●
 ●● ●
 ● 46 ●
 ●
 ●
 ●
 ●
 ● ●
 ● ●
 ● ●
 ●
 ● ● ●
 0. 8 5 10 ● ●
 ●
 ●

 0. 8 8 ● ● ●
 ●
 ●
 ●
 ●

 ● ● ●
 ●
 ●
 ●
 ●
 44 ● 0. 8 4 ●
 ●
 ●

 0. 2 5 0. 3 0 0. 3 5 0. 4 0 0. 4 5 0. 5 0 0. 2 5 0. 3 0 0. 3 5 0. 4 0 0. 4 5 0. 5 0 0. 3 0 0. 3 5 0. 4 0 0. 4 5 0. 5 0 0. 2 5 0. 3 0 0. 3 5 0. 4 0 0. 4 5 0. 5 0
 T witt er P a y S ati sf a cti o n T witt er P a y S ati sf a cti o n T witt er P a y S ati sf a cti o n T witt er P a y S ati sf a cti o n

 ( a) J o b S atisf a cti o n: P a y ( b) Fi n. Well b ei n g: P a y ( c) W or k Str e n gt h: P a y ( d) U n e m pl o y m e nt: P a y
 ● ● ● ●
 ● ● ● ●
 20 20
 ● ●
 ● ●
 50 ●
 ● 50 ●
 ● ● ●

 P er c e nt a g e P o p ul ati o n i n P o v ert y

 P er c e nt a g e P o p ul ati o n i n P o v ert y
 ● ●
 ● ●
 ● ● ● ● ● ●
 ● ●
 ● ● ● ●
 ● ●
 ● ●
 40 40
M e di a n F a mil y I n c o m e

 M e di a n F a mil y I n c o m e

 ● ● ● ● ● ● ● ●
 ● ●
 ● ●
 ● ●
 ● ●
 ● ● ● ●
 ● ● ● ●● ●● ●
 ●
 ●
 ●
 ●
 ●
 ●
 15 ● ● 15 ● ●

 30 ●
 ●
 ● 30 ●
 ●
 ● ●
 ●
 ●
 ●

 ● ●
 ● ● ● ●● ●
 ● ● ● ●
 ● ● ● ●
 ● ● ● ●
 ● ● ● ●
 ● ● ● ●
 ● ● ● ● ● ● ● ●
 20 ●
 ●
 ● 20 ●
 ●
 ● ●
 ●
 ●
 ● ●
 ●
 ● ●
 ● ● ●
 ● ●●
 ● ● ● ● ● ● ● ●
 ● ● ● ●
 ● ●
 ●
 ●
 ●
 ●
 ●
 ●
 10 ● ●
 ●
 ●
 10 ●
 ●
 ● ●
 ● ● ● ● ● ●
 ● ●
 10 ●
 ●
 ● 10 ●
 ●
 ● ●
 ● ●
 ●
 ● ●
 ● ●
 ● ●
 ● ●
 ● ● ● ●

 0. 2 5 0. 3 0 0. 3 5 0. 4 0 0. 4 5 0. 5 0 0. 2 0. 3 0. 4 0. 2 5 0. 3 0 0. 3 5 0. 4 0 0. 4 5 0. 5 0 0. 2 0. 3 0. 4
 T witt er P a y S ati sf a cti o n T witt er S u p er vi si o n S ati sf a cti o n T witt er P a y S ati sf a cti o n T witt er S u p er vi si o n S ati sf a cti o n

 ( e) F a mil y I n c o m e: P a y (f) F a mil y I n c o m e: S u p. ( g) P o v ert y: P a y ( h) P o v ert y: S u p er visi o n

 Fi g. 6. P er c ei v e d j o b s atisf a cti o n o n T wi tt er b y g e o gr a p h y.
C e ns us B ur e a u a n d t h e U. S. B ur e a u of L a b or St atisti cs. T his d at a q u a nti fi es st at e- wis e tr u e m e di a n
f a mil y i n c o m e o n a c o nti n u o us s c al e of U S Ds [2 0 ]. C o n c e pt u all y, w e w o ul d e x p e ct p a y s atisf a cti o n
t o b e r el e v a nt a n d b e ar a p ositi v e r el ati o ns hi p wit h m e di a n f a mil y i n c o m e. O ur d at a a gr e e wit h
t his e x p e ct ati o n as T witt er- b as e d p a y s atisf a cti o n s h o ws a p ositi v e c orr el ati o n ( = 0. 1 3, = 0. 0 3).
O n t h e ot h er h a n d, s u p er visi o n s atisf a cti o n s h o ws a n e g ati v e c orr el ati o n ( =- 0. 1 8, = 0. 0 2), Fi g. 6 e )
wit h m e di a n f a mil y i n c o m e. T h e r e gr essi o n m o d el ( 2 = 0. 1 0, = 0. 0 1) c o n fir ms t h e si g ni fi c a n c e a n d
si g ns of c o e ffi ci e nts f or p a y ( 6 4. 1 3, = 0. 0 5) a n d s u p er visi o n (- 7 6. 8 0, = 0. 0 1) s atisf a cti o n. T h es e
r el ati o ns hi ps c o ul d b e a r e fl e cti o n of p e o pl e’s s elf- e x pr essi o n t o w ar ds m a n a g e m e nt, s u p er visi o n,
a n d w or k c ult ur e i n hi g h- p a yi n g j o bs, c o nsist e nt wit h t h e lit er at ur e t h at s u g g ests hi g h p a yi n g j o bs
b e ar t h e b ur d e n of gr e at er str ess, u n h a p pi n ess wit h m a n a g e m e nt, a n d w ors e w or k-lif e b al a n c e [ 1 1 9 ].
P o v e rt y L e v el s. We o bt ai n st at e- wis e p er c e nt a g e p o p ul ati o n i n p o v ert y fr o m t h e U. S. C e ns us
B ur e a u [ 2 0 ]. Si mil ar t o f a mil y i n c o m e, w e e x p e ct p o v ert y l e v els t o b e ar a n e g ati v e r el ati o ns hi p
wit h p a y s atisf a cti o n b e c a us e gr e at er l e v els of p o v ert y i n di c at e l o w er p a y [ 1 1 0 ]. We fi n d t h at p a y
s atisf a cti o n e x p e ct e dl y s h o ws a n e g ati v e c orr el ati o n ( =- 0. 2 0, = 0. 0 1), a n d s u p er visi o n s atisf a cti o n
i nt er esti n gl y s h o ws a p ositi v e c orr el ati o n ( = 0. 2 0, = 0. 0 1) wit h st at e- wis e p o v ert y l e v els. T h e
r e gr essi o n m o d el ( 2 = 0. 1 1, = 0. 0 4) a gr e es wit h t h e si g ni fi c a n c e a n d si g ns of c o e ffi ci e nts f or p a y
(- 1 6. 7 2, = 9 .6 0 × 1 0 − 3 ) a n d s u p er visi o n ( 1 4. 2 3, = 0. 0 1) s atisf a cti o n. T h es e tr e n ds s o m e w h at a gr e e
wit h w h at w e o bs er v e d f or t h e f a mil y i n c o m e v ari a bl e a b o v e.

6. 2 Di ff e r e n c e s i n P e r c ei v e d J o b S ati sf a cti o n b y S e x a n d R a c e
We n o w e x a mi n e di ff er e n c es i n p er c ei v e d j o b s atisf a cti o n a cr oss s e x a n d r a c e i n t h e w or kf or c e. We
o bt ai n f a c et- wis e j o b s atisf a cti o n gr o u p e d a n d a g gr e g at e d b as e d o n d e m o gr a p hi c gr o u ps of s e x,
r a c e, a n d t h e i nt ers e cti o n of s e x a n d r a c e f or U. S. b as e d T witt er us ers i n o ur d at as et. We n ot e t h at a
S h a pir o- Wil k’s n or m alit y t est o n t h e p a y v al e n c e d at a r e v e als = 0. 6 1, < 0. 0 5, a n d t h e s a m e f or
s u p er visi o n r e v e als = 0. 6 4, < 0. 0 5, t h er ef or e, r ej e cti n g t h e n ull h y p ot h esis t h at t h e j o b s atisf a cti o n
d at a is n or m all y distri b ut e d. T h at is, w e c a n n ot ass u m e t h e d at a t o b e n or m all y distri b ut e d. We

Pr o c. A C M H u m.- C o m p ut. I nt er a ct., V ol. 5, N o. C S C W 1, Arti cl e 1 6 7. P u bli c ati o n d at e: A pril 2 0 2 1.
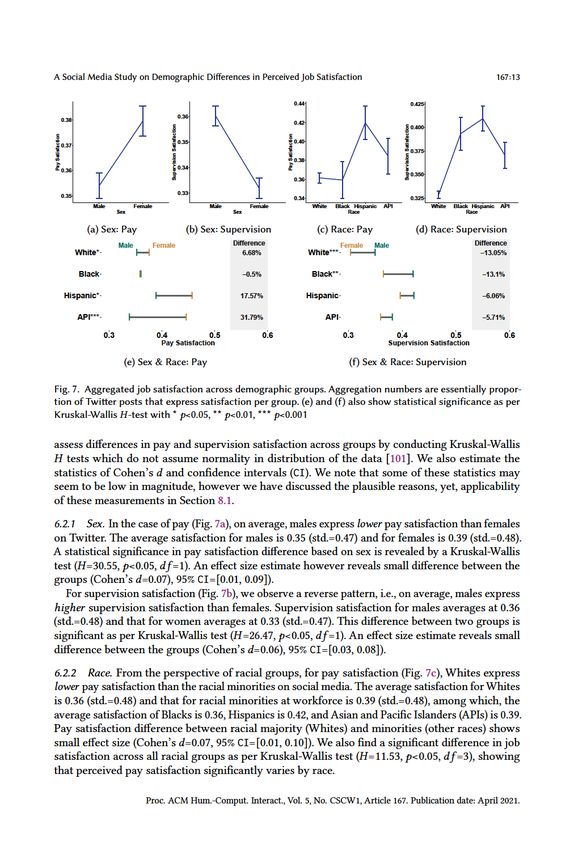
A S o ci al M e di a St u d y o n D e m o gr a p hi c Di ff er e n c es i n P er c ei v e d J o b S atisf a cti o n 1 6 7: 1 3

 0. 4 4 0. 4 2 5

 0. 3 6 ●
 ●
 0. 3 8 ●
 0. 4 2 ●
 0. 4 0 0

 S u p er vi si o n S ati sf a cti o n

 S u p er vi si o n S ati sf a cti o n
 ●
P a y S ati sf a cti o n

 P a y S ati sf a cti o n
 0. 3 5 0. 4 0
 0. 3 7
 0. 3 7 5
 ● ●
 0. 3 8
 0. 3 4
 0. 3 6
 0. 3 5 0
 ●
 0. 3 6 ●
 ●
 ●

 0. 3 5 0. 3 3 ●
 0. 3 4 0. 3 2 5
 M al e F e m al e M al e F e m al e W hit e Bl a c k Hi s p a ni c A PI W hit e Bl a c k Hi s p a ni c A PI
 Sex Sex Race Race

 ( a) S e x: P a y ( b) S e x: S u p er visi o n ( c) R a c e: P a y ( d) R a c e: S u p er visi o n
 M al e F e m al e Diff er e n c e F e m al e M al e Diff er e n c e
 W hit e* ● ● 6. 6 8 % W hit e*** ● ● − 1 3. 0 5 %

 Bl a c k ● − 0. 5 % Bl a c k** ● ● − 1 3. 1 %

 Hi s p a ni c* ● ● 1 7. 5 7 % Hi s p a ni c ● ● − 6. 0 6 %

 A PI*** ● ● 3 1. 7 9 % A PI ● ● − 5. 7 1 %

 0. 3 0. 4 0. 5 0. 6 0. 3 0. 4 0. 5 0. 6
 P a y S ati sf a cti o n S u p er vi si o n S ati sf a cti o n

 ( e) S e x & R a c e: P a y (f) S e x & R a c e: S u p er visi o n

Fi g. 7. A g gr e g at e d j o b s atisf a cti o n a cr oss d e m o gr a p hi c gr o u ps. A g gr e g ati o n n u m b ers ar e ess e nti all y pr o p or-
ti o n of T wi tt er p osts t h at e x pr ess s atisf a cti o n p er gr o u p. ( e) a n d (f) als o s h o w st atisti c al si g nifi c a n c e as p er
Kr us k al- W allis -t est wit h * < 0. 0 5, * * < 0. 0 1, * * * < 0. 0 0 1

ass ess di ff er e n c es i n p a y a n d s u p er visi o n s atisf a cti o n a cr oss gr o u ps b y c o n d u cti n g Kr us k al- Wallis
 t ests w hi c h d o n ot ass u m e n or m alit y i n distri b uti o n of t h e d at a [1 0 1 ]. We als o esti m at e t h e
st atisti cs of C o h e n’s a n d c o n fi d e n c e i nt er v als ( C I ). We n ot e t h at s o m e of t h es e st atisti cs m a y
s e e m t o b e l o w i n m a g nit u d e, h o w e v er w e h a v e dis c uss e d t h e pl a usi bl e r e as o ns, y et, a p pli c a bilit y
of t h es e m e as ur e m e nts i n S e cti o n 8. 1 .
6. 2. 1 S e x. I n t h e c as e of p a y ( Fi g. 7 a ), o n a v er a g e, m al es e x pr ess l o wer p a y s atisf a cti o n t h a n f e m al es
o n T witt er. T h e a v er a g e s atisf a cti o n f or m al es is 0. 3 5 (st d. = 0. 4 7) a n d f or f e m al es is 0. 3 9 (st d. = 0. 4 8).
A st atisti c al si g ni fi c a n c e i n p a y s atisf a cti o n di ff er e n c e b as e d o n s e x is r e v e al e d b y a Kr us k al- Wallis
t est ( = 3 0. 5 5, < 0. 0 5, = 1). A n e ff e ct si z e esti m at e h o w e v er r e v e als s m all di ff er e n c e b et w e e n t h e
gr o u ps ( C o h e n’s = 0. 0 7), 9 5 % C I =[ 0. 0 1, 0. 0 9]).
 F or s u p er visi o n s atisf a cti o n ( Fi g. 7 b ), w e o bs er v e a r e v ers e p att er n, i. e., o n a v er a g e, m al es e x pr ess
hi g h er s u p er visi o n s atisf a cti o n t h a n f e m al es. S u p er visi o n s atisf a cti o n f or m al es a v er a g es at 0. 3 6
(st d. = 0. 4 8) a n d t h at f or w o m e n a v er a g es at 0. 3 3 (st d. = 0. 4 7). T his di ff er e n c e b et w e e n t w o gr o u ps is
si g ni fi c a nt as p er Kr us k al- Wallis t est ( = 2 6. 4 7, < 0. 0 5, = 1). A n e ff e ct si z e esti m at e r e v e als s m all
di ff er e n c e b et w e e n t h e gr o u ps ( C o h e n’s = 0. 0 6), 9 5 % C I =[ 0. 0 3, 0. 0 8]).
6. 2. 2 R ac e. Fr o m t h e p ers p e cti v e of r a ci al gr o u ps, f or p a y s atisf a cti o n ( Fi g. 7 c ), W hit es e x pr ess
l o wer p a y s atisf a cti o n t h a n t h e r a ci al mi n oriti es o n s o ci al m e di a. T h e a v er a g e s atisf a cti o n f or W hit es
is 0. 3 6 (st d. = 0. 4 8) a n d t h at f or r a ci al mi n oriti es at w or kf or c e is 0. 3 9 (st d. = 0. 4 8), a m o n g w hi c h, t h e
a v er a g e s atisf a cti o n of Bl a c ks is 0. 3 6, His p a ni cs is 0. 4 2, a n d Asi a n a n d P a ci fi c Isl a n d ers ( A PIs) is 0. 3 9.
P a y s atisf a cti o n di ff er e n c e b et w e e n r a ci al m aj orit y ( W hit es) a n d mi n oriti es ( ot h er r a c es) s h o ws
s m all e ff e ct si z e ( C o h e n’s = 0. 0 7, 9 5 % C I =[ 0. 0 1, 0. 1 0]). We als o fi n d a si g ni fi c a nt di ff er e n c e i n j o b
s atisf a cti o n a cr oss all r a ci al gr o u ps as p er Kr us k al- Wallis t est ( = 1 1. 5 3, < 0. 0 5, = 3), s h o wi n g
t h at p er c ei v e d p a y s atisf a cti o n si g ni fi c a ntl y v ari es b y r a c e.

 Pr o c. A C M H u m.- C o m p ut. I nt er a ct., V ol. 5, N o. C S C W 1, Arti cl e 1 6 7. P u bli c ati o n d at e: A pril 2 0 2 1.
167:14 Koustuv Saha et al.

 In supervision satisfaction (Fig. 7d), Whites express lower satisfaction than the racial minorities.
The average supervision satisfaction for Whites is 0.33 (std.=0.46), and that for other races is 0.39
(std.=0.49), among which, average satisfaction of Blacks is 0.39, Hispanics is 0.41, and APIs is
0.37. Supervision satisfaction difference between racial majority (Whites) and minorities shows an
effect size Cohen’s =0.14 with 95% CI=[0.08, 0.17]). The Kruskal-Wallis test reveals a significant
difference in supervision satisfaction across all four racial groups ( =53.90,
A Social Media Study on Demographic Differences in Perceived Job Satisfaction 167:15

 Table 7. Top salient -grams ( =1,2,3) in job satisfaction posts across unemployment rates (SAGE [49]).
 Low Unemployment States High Unemployment States
 -gram SAGE -gram SAGE -gram SAGE -gram SAGE
supervisor responding 5.23 culinary 0.93 reproductive -2.00 lowincome families -0.94
suspicious person 5.15 alcohol 0.90 hiring apply -1.75 miami -0.94
tx 3.46 qualifications 0.90 homelessness -1.69 average wage -0.90
candidate dollar 1.85 lincoln 0.88 strike -1.68 protection -0.90
coffee shop 1.60 center tracking 0.87 rights -1.63 gun -0.89
income money 1.60 catholic health 0.87 voting -1.62 llc hiring -0.88
reviewing 1.57 creek 0.87 scare -1.42 unpaid -0.88
executives 1.48 operations department 0.85 wealth tax -1.32 extra money -0.88
manager candidate 1.15 medical center 0.82 toxic -1.32 credit card -0.86
suicide 1.11 trained 0.82 atlanta -1.22 remote -0.79
healthwelfare 1.08 coordinator 0.72 mississippi -1.17 pension -0.79
supervisor lowe 1.08 breakfast 0.72 chicago -1.16 stolen -0.76
ge 1.08 maintenance supervisor 0.67 need money -1.04 problems -0.75
coolest 1.08 home health 0.66 passive -1.03 transfer -0.73
booz 1.03 fantasy 0.66 slap -1.02 lowincome kids -0.70
program supervisor 0.99 succeed 0.65 communities -1.01 multiply income -0.68
finance manager 0.99 values 0.65 compensation -0.99 freedom -0.66
like patient 0.98 capitalism 0.60 lowincome americans -0.96 immigrants -0.64
certified 0.97 bonus check 0.60 employed -0.95 fair share -0.63
wage slavery 0.96 good idea 0.57 commitment -0.95 warehouse supervisor -0.63

for other demographic groups, they may explain why we observe lower job satisfaction for White
workers than any other racial group.

7 AIM 3: LINGUISTIC DIFFERENCES IN JOB SATISFACTION EXPRESSIONS
Now, we dissect the factors that may be driving the observed perceived job satisfaction by de-
mographics. To examine the linguistic differences in job satisfaction expressions, we employ an
unsupervised language modeling technique, the Sparse Additive Generative Model (SAGE) [49].
Given any two documents, SAGE finds distinguishing keywords comparing the parameters of
two logistically parameterized-multinomial models with self-tuned regularization to control the
tradeoff between frequent and rare terms. We employ SAGE to identify -grams ( =1,2,3) that
distinguish the posts of different demographic groups (low vs. high geographical unemployment
regions, males vs. females in sex, and Whites vs. minority races). The magnitude of SAGE value
of an -gram signals the degree of its “uniqueness”. SAGE allows us to explore how demographic
groups differently and saliently express job satisfaction on Twitter. We contextualize job satisfaction
expressions within the literature on frame of reference and attitudes of demographic groups [67].

7.1 Linguistic Expression Differences by Geography
We examine if job satisfaction expressions on social media reveal differences in the underlying
concerns and values of geographic locations varying in employment opportunities. Using a median
split, we identify states with low and high unemployment rates, which may also distinguish states
on other correlated factors such as income, employment opportunities, and standard of living. We
compile two groups of Twitter posts — one originating from low unemployment states, and another
originating from high unemployment states, and run SAGE on these two datasets.
 Table 7 shows the top keywords as per SAGE that are salient in the Twitter posts originating from
low and high unemployment states. For low unemployment states, we find keywords relating to job
positions (supervisor, manager candidate, program supervisor, executives, coordinator), career benefits
and growth (healthwelfare, reviewing, certified, trained, succeed), and food and luxury (coffee shop,
booz, culinary, alcohol, breakfast). On the other hand, keywords from high unemployment states

 Proc. ACM Hum.-Comput. Interact., Vol. 5, No. CSCW1, Article 167. Publication date: April 2021.
167:16 Koustuv Saha et al.

include rights (rights, voting, freedom), income opportunities (hiring apply, extra money, pension),
and other hardships (homelessness, lowincome, unpaid).
 The above examples suggest that people in low unemployment states generally have more
gentrified concerns relating to work and self-actualization, e.g., “Yayy! i was just promoted to
assistant manager and received a substantial pay raise!”, whereas people in high unemployment
states typically express concerns about basic needs and rights, e.g., “Can’t afford to live solo or move,
after a decade of no income and fighting homelessness every few months, I’m grateful about what I
have, but some extra income would allow me to run the AC in summer without worrying about electric.”
These observations support prior findings on the discrepancies in human needs, opportunities,
and subjective wellbeing, with respect to varying socio-economic and historical factors [33]. The
job satisfaction expressions on social media reflect socioeconomic and demographic disparities in
job-related priorities and, consequently, perceived job satisfaction.

7.2 Linguistic Expression Differences by Sex
Prior work extensively studied the factors that lead to sex-based disparities in job satisfaction
(Section 2), and we examine if these are captured in people’s job satisfaction expressions on social
media. Table 8 shows group-wise most salient -grams: here positive SAGE score reveals a greater
(and more distinctive) presence in the posts by males, whereas a negative score reveals a greater
presence in the posts by females. We find that the salient keywords used by males are dominated by
financial keywords (wealth, tax, pay cut, capital gains) and political keywords (rights, gun, federal
government, unions, wage laws). On the other hand, salient keywords used by females include pro-
social concerns and interpersonal relationships (maternity leave, husband, supportive, hospitality,
boyfriend), harassment (toxic workplace, sexually, harassed, touched, abused), clothing (bra, outfit,
clothes, wear), and emotional/affective keywords (scare, emotional, stressful, screamed).
 Our findings align with prior work that found women report more negative emotions and stress
in job satisfaction surveys [138]. For instance, a female person expressed, “such a stressful and
anxiety filled week, yesterday I found a 1200 per month student loan bill, they think I make way more
than i did a year ago, it is not doable for me”. Females also saliently express workplace climate issues,
particularly relating to sexual harassment and toxic workplaces [97], e.g., “I love the work in my job
but my manager makes it toxic” and “my boss just touched my upper thigh. this job is no longer worth
it”. These expressions reveal the nuanced and latent discriminations against women at work, e.g.,
“if you are a woman and you get a raise or a nice laptop, men will automatically assume you must be
sexually favoring your boss coz women just can’t be good at their job to deserve a raise!” Keywords such
as hourly shift, extra income, barista may correspond to women engaging in supplementary sources
of income for the household, e.g., “the part time position hired me! doesn’t pay a lot, but the extra
income will help so much! soon, i’ll sort out the amount of freelancing i can do on top of it.” Together,
these observations reveal gender disparities in personal and employment characteristics [27, 88].

7.3 Linguistic Expression Differences by Race
Prior work has found differences in perceived job satisfaction by race or ethnicity (see Related
Work). Whites are known to associate themselves with more non-material job rewards at work [141].
In contrast, according to Hagedorn, “minority workers are likely to meet with race-related stressors
[...]. The nature and extent of the stressors are complex and depend on numerous factors such as the
racial composition of surrounding staff—both coworkers and supervisors [...] as well as situational
salience, the level of distinctiveness, and interpretation of token status experienced by the worker” [63].
 Table 9 shows the salient -grams used by racial majorities (Whites) and minorities (other races)
in the U.S. workforce. Here, a positive SAGE score represents a greater (and more distinctive)
presence in the posts by Whites, whereas a negative score represents a greater presence in the posts

Proc. ACM Hum.-Comput. Interact., Vol. 5, No. CSCW1, Article 167. Publication date: April 2021.
You can also read