Situation Analysis of Children in Tonga - Unicef
←
→
Page content transcription
If your browser does not render page correctly, please read the page content below
Situation Analysis of Children in Tonga
© United Nations Children’s Fund (UNICEF), Pacific Office, Suva

December 2017

This report was written by Kirsten Anderson, Ruth Barnes, Awaz Raoof and Carolyn Hamilton, with the assistance
of Laura Mertsching, Jorun Arndt, Karin Frode, Safya Benniche and Kristiana Papi. Maurice Dunaiski contributed
to the chapters on Health and WASH. Further revision to the Child Protection chapter was done by Shelley Casey.

The report was commissioned by UNICEF Pacific, which engaged Coram International, at Coram Children’s Legal
Centre, to finalise the Tonga Situation Analysis.

The Situation Analyses were managed by a Steering Committee within UNICEF Pacific and UNICEF EAPRO, whose
members included: Andrew Colin Parker; Gerda Binder (EAPRO); Iosefo Volau; Laisani Petersen; Lemuel Fyodor
Villamar; Maria Carmelita Francois; Settasak Akanimart; Stanley Gwavuya (Vice Chair), Stephanie Kleschnitzki
(EAPRO); Uma Palaniappan; Vathinee Jitjaturunt (Chair) and Waqairapoa Tikoisuva.

The contents of the report do not necessarily reflect the policies or views of UNICEF. UNICEF accepts no
responsibility for error.

Any part of this publication may be freely reproduced with appropriate acknowledgement.

Suggested citation. United Nations Children’s Fund, Situation Analysis of Children in Tonga, UNICEF, Suva, 2017

Cover Image: © UNICEFPacific/2018/Heinrich
Situation Analysis of Children in Tonga
2 S i t u a t i o n A n a l y s i s o f C h i l d r e n i n To n g a
Table of Contents
Executive Summary................................................................................................................... 4
Acronyms.................................................................................................................................... 8
1. Introduction................................................................................................................... 10
1.1. Purpose and scope.................................................................................................. 10
1.2. Conceptual framework............................................................................................ 11
1.3. Methods and limitations......................................................................................... 13
1.4. Governance and validation ..................................................................................... 14
2. Context.......................................................................................................................... 15
2.1. Geography and demographics................................................................................ 16
2.2. Main disaster and climate risks............................................................................... 17
2.3. Government and political context ........................................................................... 18
2.4. Socio-economic context ......................................................................................... 18
2.5. Legislative and policy framework............................................................................ 21
2.6. Child rights monitoring............................................................................................ 22
3. Health and Nutrition..................................................................................................... 23
3.1. Child mortality......................................................................................................... 24
3.2. Child health, immunization and communicable diseases........................................ 25
3.3. Maternal health....................................................................................................... 27
3.4. Violence against women and girls........................................................................... 29
3.5. Adolescent health................................................................................................... 29
3.5.1. Fertility and contraceptive use..................................................................... 29
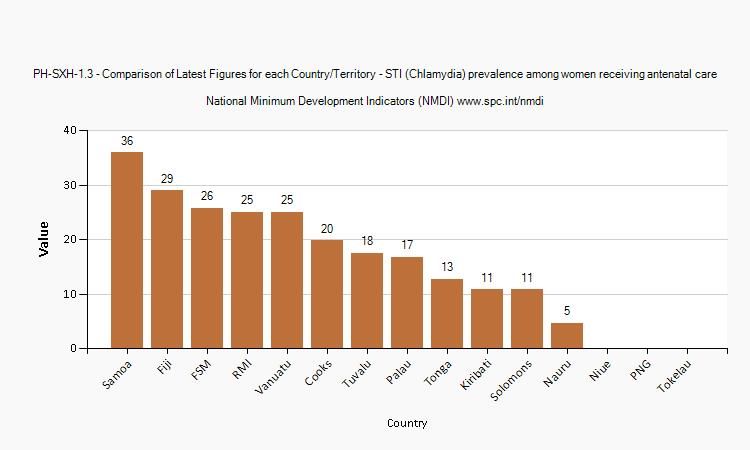
3.5.2. HIV/AIDS and sexually transmitted infections.............................................. 30
3.5.3. Substance abuse......................................................................................... 31
3.5.4. Mental health............................................................................................... 32
3.6. Nutrition.................................................................................................................. 33
3.6.1. Child stunting and wasting........................................................................... 34
3.6.2. Anaemia....................................................................................................... 34
3.6.3. Low birth weight and underweight.............................................................. 35
3.6.4. Overweight and obesity............................................................................... 35
3.6.5. Breastfeeding............................................................................................... 36
3.7. Key barriers and bottlenecks................................................................................... 37
3.7.1. Climate and disaster risks............................................................................ 37
3.7.2. Financial and human resources.................................................................... 37
3.7.3. Lifestyle and social behaviours.................................................................... 39
4. Water, Sanitation and Hygiene.................................................................................... 40
4.1. Access to improved water sources......................................................................... 41
Ta b l e o f C o n t e n t s   3

     4.2.   Access to improved sanitation facilities..................................................................                 45
     4.3.   Hygiene practices....................................................................................................      48
     4.4.   WASH in schools, menstrual hygiene management and disabilities.......................                                      50
     4.5.   Barriers and bottlenecks..........................................................................................         51
            4.5.1. Climate change and disaster risks................................................................                   51
            4.5.2. Equity ..........................................................................................................   51
            4.5.3. Data availability............................................................................................       51

5. Education.......................................................................................................................    52
   5.1. Context....................................................................................................................    54
   5.2. Early childhood education.......................................................................................               56
        5.2.1. Access and quality.......................................................................................               56
        5.2.2. Barriers and bottlenecks...............................................................................                 57
   5.3. Primary and secondary education...........................................................................                     58
        5.3.1. Access.........................................................................................................         58
        5.3.2. Quality..........................................................................................................       60
        5.3.3. Barriers and bottlenecks...............................................................................                 60
   5.4. Tertiary and vocational education............................................................................                  61
        5.4.1. Barriers and bottlenecks...............................................................................                 62

6. Child Protection ............................................................................................................       63
   6.1. Child protection risks and vulnerabilities.................................................................                    66
        6.1.1. Nature and extent of violence, abuse, neglect and exploitation of children....                                          67
        6.1.2. Community knowledge, attitudes and practices..........................................                                  69
   6.2. The child protection system ...................................................................................                70
        6.2.1. The legal and policy framework for child protection ....................................                                70
        6.2.2. Child protection structures, services and resourcing...................................                                 73
        6.2.3. Mechanisms for inter-agency coordination, information management
               and accountability........................................................................................              76
   6.3. Other child protection Issues..................................................................................                76
        6.3.1. Birth registration..........................................................................................            76
        6.3.2. Climate change and natural disasters..........................................................                          76

7. Social Protection .......................................................................................................... 78
   7.1. Profile of child and family poverty and vulnerability................................................ 80
   7.2. Bottlenecks and barriers to ensuring an effective social protection system........... 84

8. Conclusions ..................................................................................................................      89
   8.1. Climate change and disaster risks ..........................................................................                   89
   8.2. Financial and human resources...............................................................................                   90
   8.3. Geography...............................................................................................................       90
   8.4. Equity .....................................................................................................................   90
   8.5. Gender....................................................................................................................     90
   8.6. Impacts of poverty and vulnerability.......................................................................                    91
   8.7. Legal and policy framework....................................................................................                 91
   8.8. Cultural norms and approaches...............................................................................                   91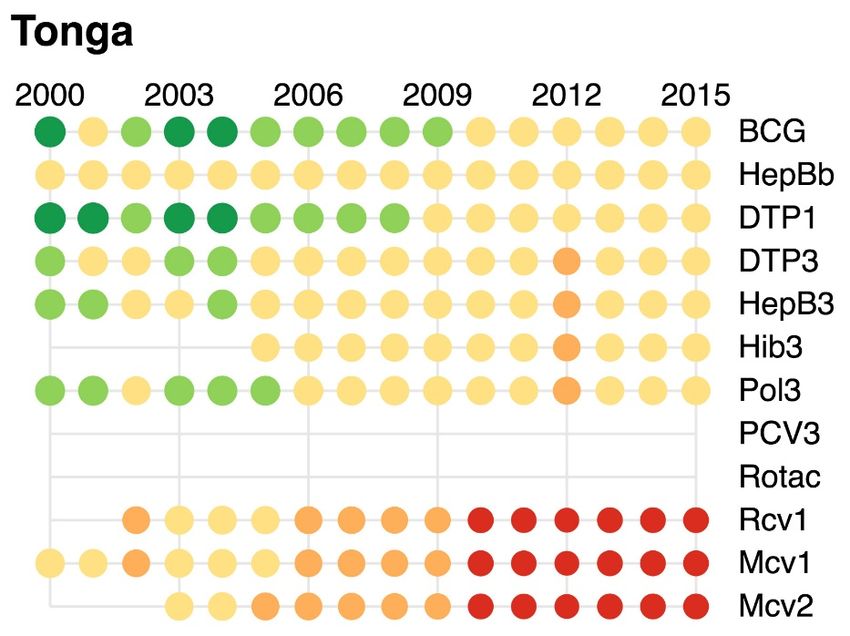
4     S i t u a t i o n A n a l y s i s o f C h i l d r e n i n To n g a

Executive Summary

Introduction                                                               Key barriers and bottlenecks

This report aims to present a comprehensive                                The following key barriers and bottlenecks were
assessment and analysis of the situation of                                identified from the full situation analysis of children
children and women in Tonga. It provides an                                and children in Tonga.
evidence base to inform decision-making across
sectors that are relevant to children and women                            Climate change and disaster risks: Tonga faces
and it particularly intends to contribute to the                           an increasing risk of extreme weather and natural
development of programmes and strategies to                                disasters as well as increases in climate change-
protect, respect and fulfil the rights of children                         related weather conditions. A key finding of this
and women in Tonga.                                                        report is that climate change and disaster risks
                                                                           have a considerable impact on all sectors in relation
The Kingdom of Tonga consists of some 170 islands                          to the realisation of children and women’s rights.
in the Polynesian Pacific, with a total surface area                       Climate change and extreme weather, for example,
of 747km2. It is made up of four island groups:                            affect access to and quality of education, health,
Tongatapu in the south, Ha’apai in the centre,                             WASH and other government services damaged
Vava’u in the north, and Niuatoputapu and Niuafo’ou                        schools, buildings and infrastructure, and diverted
in the north. Only 36 islands are inhabited. The total                     resources.
population stands at 106,170, around 37 per cent of
whom are under the age of 15.                                              Financial and human resources: Tonga is a lower
                                                                           middle-income country, and faces some resource
This report covers the child outcome areas of health                       constraints in relation to child rights. In the health
(including nutrition), water, sanitation and hygiene                       sector, for example, a key challenge is the low
(WASH), education, child protection (including child                       health workforce to population ratio.
justice) and social protection. By assessing and
analysing the situation for children and women in                          Geography and equity: The geography of
relation to these outcomes and in relation to relevant                     Tonga influences the realisation of the rights of
Sustainable Development Goals (SDGs), this report                          women and children in all sectors. Those living
seeks to highlight trends, barriers and bottlenecks                        on remote islands find it, on average, harder to
in the realisation of children’s and women’s rights                        access services, including education and health
in Tonga.                                                                  services. It is a challenge for the Government to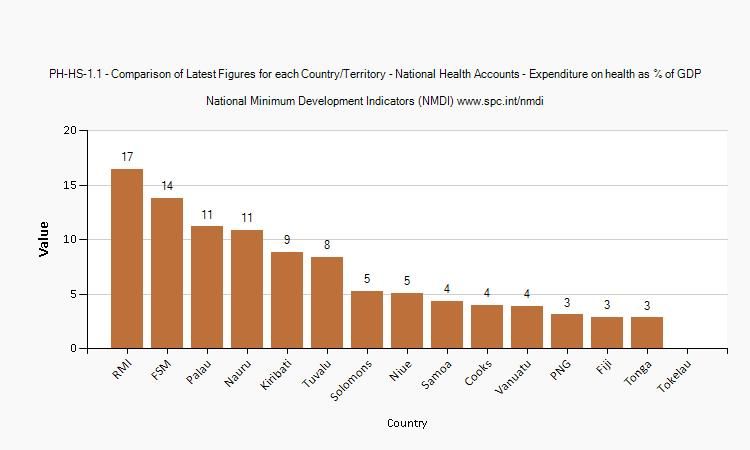
Executive Summary            5

reach children in remote areas due to the cost
and practical considerations. Resources could be
distributed more equitably among the different
geographic regions of Tonga. There are also gaps
in the legal and policy framework in relation to
protecting girls with disabilities and protecting
boys from sexual offences.

Impacts of poverty and vulnerability: The
impacts of poverty are significant in Tonga and
children and families are highly exposed to risk
and economic shocks, particularly those caused by
natural disasters.

Legal and policy framework: One of the
main barriers in the child protection sector is
the complete lack of a child protection legal
framework and system. Children are not
protected from corporal punishment at home.
There are gaps in the legal framework in relation
to protecting children from sexual offences. The
minimum age of criminal responsibility (7) is too
low. There is also a lack of specialised bodies and
institutions to support child-friendly justice and
child protection. Further, there is no child-friendly
system of justice for children in contact with the
law as victims or witnesses.

Cultural norms and approaches: Cultural attitudes
and traditions in Tonga prevent or impede the
realisation of children’s rights in several sectors.
Reliance on and preference for informal justice
leads to underreporting and cases being handled
within villages, where proceedings may not uphold
child safeguards. Community attitudes towards
violence against children and corporal punishment
pose particular child protection risks.
6   S i t u a t i o n A n a l y s i s o f C h i l d r e n i n To n g a

Snapshot of outcome areas

                                Child mortality rates have been declining in over recent decades, and Tonga
                                is on track to meet international child mortality reduction targets. Tonga is
                                the only country in the PICTs region that displays an inverse relationship
                                between gender and the under-5 mortality rate, with a higher mortality rate
                                for girls. Gaps exist in immunization coverage in relation to all 12 universally
                                recommended vaccines, with worrying downward coverage trends in relation
                                to some. Tonga’s adjusted maternal mortality ratio is 124 maternal deaths per
                                100,000 live births, which falls significantly short of international targets and is
       Health                   one of the highest rates in the PICTs region. However, Tonga’s mortality rates
                                can fluctuate heavily from one year to another due to the small numbers of
                                vital events per year. Estimated antenatal coverage for at least one visit stands
                                at a universal 99 per cent. Some 98 per cent of deliveries are attended by a
                                skilled healthcare professional. Contraceptive prevalence is estimated at 34
                                per cent, which is just below the PIC average. Data from 2015 indicate that
                                only 19 cases of HIV have ever been diagnosed in Tonga. However, only 14 per
                                cent of males and 12 per cent of females have comprehensive knowledge of
                                HIV/AIDS transmission and prevention.

                                According to 2012 data, the prevalence of stunting in children under 5 years in
                                Tonga is 8 per cent, which compares favourably to the PIC average of 18 per
                                cent. The estimated prevalence of wasting in under-5 children is 5 per cent,
                                which is just above the PIC average of 4 per cent. Obesity and associated
                                non-communicable diseases (NCDs) are a significant public health concern in
                                Tonga. As of 2010 NCDs were the leading causes of morbidity and absorbed
                                around 20 per cent of government healthcare expenditure. According to
     Nutrition
                                2016 estimates, 17 per cent of children in Tonga were overweight. Data on
                                childhood obesity are more limited, with a 2010 school-based survey finding
                                that one in five surveyed students were obese. According to the most recent
                                UN estimates, 52 per cent of children in Tonga are exclusively breastfed during
                                their first six months, which is in line with global nutrition targets for 2025. The
                                continued breastfeeding rate, however, stands at 30 per cent, which is the
                                lowest rate in the PIC region.

                                Tonga has achieved universal coverage rates for improved water sources,
                                while some coverage gaps in relation to sanitation remain. As of 2015, 91 per
                                cent of households used improved sanitation facilities, with better coverage in
                                urban areas (98 per cent) than rural areas (89 per cent). Worryingly, trend data
       WASH
                                suggest that improved sanitation coverage decreased slightly (3 percentage
                                points) between 1990 and 2015. Information gaps exist in relation to WASH in
                                schools, menstrual hygiene management (MHM) programmes and access to
                                WASH for children living with disabilities and other disadvantaged groups.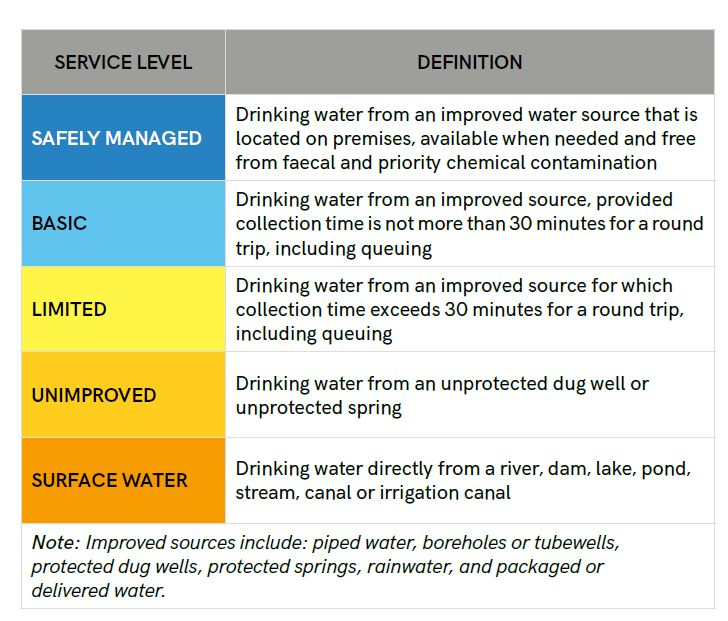
Executive Summary              7

             Early childhood education (ECE) has been compulsory in Tonga since 2013.
             Limited up-to-date data are available on ECE enrolment, survival and drop-
             out rates. Reports suggest that the quality of ECE programmes and learning
             materials are sub-standard and that teachers lack proper training. Access to
             ECE in remote and rural areas is also said to be very limited. The net enrolment
             rate (NER) for primary education was 90 per cent in 2015. At secondary
             level, the NER stood at 79 per cent (in 2014), with a significant proportion of
Education
             children enrolled in secondary school falling outside the official age group.
             Ensuring access to quality primary education in remote areas, particularly on
             smaller, remote islands, poses a significant challenge. The limited numbers of
             secondary schools in rural areas drives low enrolment and drop-out in these
             areas, due to the associated high transport costs and migration of students
             towards urban and peri-urban areas. Underfunding of education is also an
             issue, especially in relation to primary education.

             Tonga has no discernible child protection system and no government agency
             dedicated to child welfare. The current legal framework does not protect
             children sufficiently from corporal punishment, exploitation, trafficking and child
             labour. Community attitudes towards violence against children and corporal
             punishment pose particular child protection risks. Up-to-date quantitative data
  Child
             on many child protection indicators are lacking. A 2009 report found violence
protection
             against women and children to be widespread and deeply ingrained in society.
             A 2015 assessment report found evidence of children engaged in the worst
             forms of child labour, including forced domestic work. Further, as there is no
             child-specific law for child justice in Tonga, cases involving children in conflict
             and in contact with the law are processed according to general legal provisions.

             A significant proportion of Tonga’s population lives in poverty, with poverty
             rates trending upwards since 2000. The basic needs poverty rate almost
             doubled between 2001 and 2009, to 22.5 per cent. Children and young people
             are more likely to be living in poor households than the wider population. Also
             of concern is the significant number of persons living just above the poverty
  Social
             line, where relatively small external shocks could readily push households into
protection
             poverty. A recent assessment of Tonga’s social protection system ranks it as
             one of the lowest in the region. In the context of diminishing traditional support
             systems, and volatility of remittances from overseas workers, the absence of
             a comprehensive social protection system that effectively targets those who
             are most in need is a significant gap.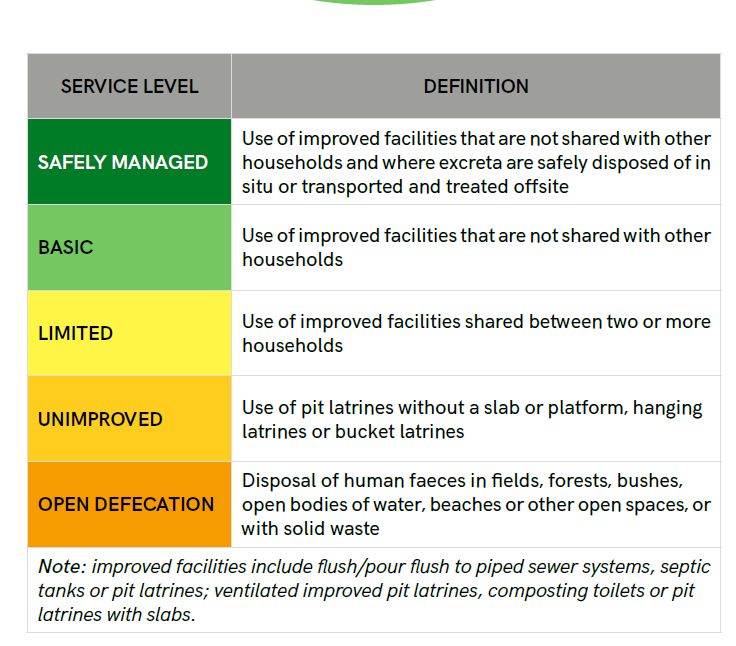
8    S i t u a t i o n A n a l y s i s o f C h i l d r e n i n To n g a

Acronyms
AIDS Acquired Immune Deficiency Syndrome
BCG Bacillus Calmette-Guérin
CERD Convention on the Elimination of All Forms of Racial Discrimination
CRC Convention on the Rights of the Child
CRIN Child Rights International Network
CRPD Convention on the Rights of Persons with Disabilities
DHS Demographic and Health Survey
EAPRO East Asia and Pacific Regional Office
ECD Early Childhood Development
ECE Early Childhood Education
EFA Education for All
FSM Federated States of Micronesia
FY Fiscal Year
GADRRRES Global Alliance for Disaster Risk Reduction and Resilience in the Education Sector
GDP Gross Domestic Product
GER Gross Enrolment Rate
GSHS Global School-based Health Survey
HIES Household Income and Expenditure Survey
HIV Human Immunodeficiency Virus
ICESCR International Covenant on Economic, Social and Cultural Rights
JMP WHO/UNICEF Joint Monitoring Programme for Water Supply, Sanitation and Hygiene
MDG Millennium Development Goal
MHM Menstrual Hygiene Management
MMR Maternal Mortality Ratio
MoET Ministry of Education and Training
NCD Non-communicable Disease
NER Net Enrolment Rate
NGO Non-governmental Organization
NMDI National Millennium Development Indicator
ODA Official Development Assistance
OHCHR Office of the United Nations High Commissioner for Human Rights
PICTs The 14 Pacific Island Countries and Territories that are the subject of the Situational Analyses
PNG Papua New Guinea
SABER Systems Approach for Better Education
SDG Sustainable Development Goal
SitAn Situational Analysis
STATS Standard Testing for Tongan, English and Maths
SOWC State of the World’s Children
SP Strategic Programme
SPC Pacific Community
SPI Social Protection Indicator
Acronyms   9

STI Sexually Transmitted Infection
TB Tuberculosis
TESP I Tonga Education Support Programme (2005-2010)
TESP II Tonga Education Support Programme (2013-2016)
TOP Tongan Pa’anga, the currency of Tonga
TVET Technical and Vocational Education and Training
U5MR Under-5 Mortality Rate
UK United Kingdom
UN United Nations
UNDP United Nations Development Programme
UNESCAP United Nations Economic and Social Commission for Asia and the Pacific
UNESCO United Nations Educational, Scientific and Cultural Organization
UNFPA United Nations Population Fund
UNICEF United Nations Children’s Fund
UNICEF SitAn Procedural Manual UNICEF’s ‘Guidance on Conducting a Situation Analysis of
Children’s and Women’s Rights’ (March 2012)
UNIFEM United Nations Development Fund for Women
UNISDR United Nations International Strategy for Disaster Reduction
US United States
US$ United States Dollar
VAWG Violence Against Women and Girls
WASH Water, Sanitation and Hygiene
WHO World Health Organization
10       S i t u a t i o n A n a l y s i s o f C h i l d r e n i n To n g a

1.
Introduction

1.1. Purpose and scope

This report aims to present a comprehensive assessment and analysis of the situation of children
in Tonga. It is intended to present an evidence base to inform decision-making across sectors
that are relevant to children and to be instrumental in ensuring the protection and realisation of
children’s rights. It is particularly intended to contribute to the development of programmes and
strategies to protect, respect and fulfil the rights of children in the Pacific Island Countries and
Territories (PICTs).

In accordance with the approach outlined in the UNICEF Procedural Manual on ‘Conducting a
Situational Analysis of Children’s and Women’s Rights’ (‘UNICEF SitAn Procedural Manual’), the
specific aims of this Situation Analysis (SitAn) are:

     •    To improve the understanding of all stakeholders of the current situation of children’s
          rights in the Pacific, and the causes of shortfalls and inequities, as the basis for developing
          recommendations for stakeholders to strengthen children’s rights.

     •    To inform the development of UNICEF programming and support national planning and
          development processes, including influencing policies, strategies, budgets and national
          laws to contribute towards establishing an enabling environment for children that adheres
          to human rights principles, particularly with regard to universality, non-discrimination,
          participation and accountability.

     •    To contribute to national research on disadvantaged children and leverage UNICEF’s
          convening power to foster and support knowledge generation with stakeholders.
Introduction 11
• To strengthen the knowledge base to enable assessment of the contribution
of development partners, including UNICEF and the UN, in support of national
development goals.1
This SitAn report focuses on the situation of children (persons aged under 18), adolescents (aged
10 to 19) and youth (aged 15 to 24).2 In addition, an assessment and analysis of the situation
relating to women is included, to the extent that it relates to outcomes for children (for example,
regarding maternal health).
1.2. Conceptual framework
The conceptual framework is grounded in the relationship between child outcomes and the
immediate, underlying and structural determinants of those outcomes, and is adapted from
the conceptual framework presented in the UNICEF SitAn Procedural Manual. A rights-based
approach was adopted for conceptualising child outcomes, which are presented in this SitAn
according to rights categories contained in the UN Convention on the Rights of the Child (CRC).
These categories also correspond to UNICEF Strategic Programme (SP) Outcome Areas. Child
outcomes are therefore grouped into: Health/nutrition; Water, Sanitation and Hygiene (WASH)
(‘survival rights’); Education (‘development rights’); Child protection; and Social protection
(‘protection rights’).
The aim of the child outcomes assessment component of this SitAn was to identify trends and
patterns in the realisation of children’s rights and key international development targets, and any gaps,
shortfalls and inequities in the realisation of these rights and targets. The assessment employed an
equity approach, and highlighted trends and patterns in outcomes for groups of children, identifying
and assessing disparities in outcomes according to key identity characteristics and background
circumstances (e.g. gender, geographic location, socio-economic status, age and disability).
A number of analytical techniques were employed to analyse immediate, underlying and structural
causes of child outcomes, including:
• Bottlenecks and barriers analysis: a structured analysis of the bottlenecks and barriers
that children and groups of children face in the realisation of their rights, with reference to
the critical conditions/determinants3 (quality; demand; supply; and enabling environment)
needed to realise equitable outcomes for children.
1 UNICEF. 2012. Guidance on Conducting a Situation Analysis of Children’s and Women’s Rights, pp. 5-6. http://www.
unicefinemergencies.com/downloads/eresource/docs/Rights%20based%20equity%20focused%20Situation%20
Analysis%20guidance.pdf [30.01.17].
2 These are the age brackets used by UN bodies and agencies for statistical purposes without prejudice to other
definitions of ‘adolescence’ and ‘youth’ adopted by Member States.
3 Based on the 10 critical determinants outlined in Table 3 on page 20 of the UNICEF SitAn Procedural Manual.12 S i t u a t i o n A n a l y s i s o f C h i l d r e n i n To n g a
The analysis is also informed by:
• Role-pattern analysis: the identification of stakeholders responsible for and best placed
to address any shortfalls and inequities in child rights outcomes.
• Capacity analysis: to understand the capacity constraints (e.g. knowledge; information;
skills; will and motivation; authority; financial and material resources) on stakeholders
who are responsible for and best placed to address the shortfalls and inequities.
The analysis did not engage in a comprehensive causality analysis, but immediate and underlying
causes of trends, shortfalls and inequities are considered throughout.
The analysis was deliberately risk-informed and took an equity approach. An equity approach
seeks to understand and address the root causes of inequality so that all children, particularly
those that suffer the worst deprivations in society, have access to the resources and services
necessary for their survival, growth and development.4 In line with this approach, the analysis
included an examination of gender disparities and their causes, including a consideration of: the
relationships between different genders; relative access to resources and services; gender roles;
and the constraints faced by children according to their gender.
A risk-informed analysis requires an analysis of disaster and climate risks (hazards; areas of exposure
to the hazard; and vulnerabilities and capacities of stakeholders to reduce, mitigate and manage
the impact of the hazard on the attainment of children’s rights). This is particularly relevant to the
PICTs where climate change and other disaster risks exist. A risk-informed analysis also includes an
assessment of gender and the vulnerabilities of groups of children to disaster and climate risks.
A rights-based framework was developed for measuring child outcomes and analysing role-
patterns, barriers and bottlenecks. This incorporates the relevant rights standards and development
targets (particularly the Sustainable Development Goals [SDGs]) in each of the child outcome
areas (see Table 1.1).
Table 1.1: Assessment and analysis framework by outcome area
Outcome area Assessment and analysis framework
Health and - CRC (particularly the rights to life, survival and development and to
nutrition health)
- SDGs (particularly SDG 3 on ensuring healthy lives and promoting
well-being)
- Global Strategy for Women’s, Children’s and Adolescents’ Health
(2016–2030)
- World Health Organization (WHO) Global Nutrition Targets (child
stunting; anaemia; low birthweight; obesity/overweight; and
breastfeeding)
4 UNICEF NYHQ. 2010. Re-focusing on Equity: Questions and Answers. p. 4.Introduction 13
WASH - CRC (Article 24)
- SDGs (particularly SDG 6 on ensuring availability and sustainable
management of water and sanitation for all)
Education - CRC (Articles 28 and 29)
- Article 13 of International Covenant on Economic, Social and Cultural
Rights (ICESCR)
- SDGs (particularly SDG 4 on ensuring inclusive and quality education
for all and promoting lifelong learning)
- Comprehensive School Safety FrameworkI
Child protection - CRC (Articles 8, 9, 19, 20, 28(2), 37, 39 and 40)
- SDGs (particularly SDGs 5, 8, 11 and 16)
Social protection - CRC (Articles 26 and 27)
- ICESCR rights to social security (Article 9) and adequate standard of
living (Article 11)
- SDG target 1 (end poverty in all its forms everywhere)
1.3. Methods and limitations
This SitAn includes a comprehensive review, synthesis and examination of data from a variety of
sources. The assessment of child outcomes relied primarily on existing datasets from household
surveys, administrative data from government ministries and non-governmental organizations
(NGOs) and other published reports.5 Key datasets were compiled from the UNICEF Statistics
database (available at: https://data.unicef.org/) and the Pacific Community (SPC) Minimum
Development Indicators (NMDI) database (available at: https://www.spc.int/nmdi/).6 The
compilation of the 2016 State of the World’s Children (SOWC) report was utilised as the most
reliable data (available at: https://www.unicef.org/sowc2016/). The SPC NMDI database also
compiles data produced through national sources.7 Other institutional databases such as from the
World Bank, UNICEF/WHO Joint Monitoring Programme, WHO and United Nations Educational,
Scientific and Cultural Organization (UNESCO) Institute of Statistics were used where relevant.
The analytical techniques used for the analysis phase required a synthesis and analysis of
secondary data and literature, including small-scale studies and reports. It also included a mapping
and analysis of relevant laws, policies, and Government/SP Outcome Area strategies.
One of the limitations of the methodology is the lack of recent, quality data in relation to some
of the areas covered by the analysis. Gaps in the availability of up-to-date, quality data are noted
throughout the report. Because the analysis of causes and determinants of rights shortfalls relied
5 These datasets were reviewed and verified by UNICEF.
6 Data from national sources and other reputable sources is compiled and checked for consistency before being
registered in the UNICEF Statistics database and used for the annual SOWC Report.
7 The database is updated as new data becomes available.14 S i t u a t i o n A n a l y s i s o f C h i l d r e n i n To n g a heavily on existing published reports, some areas of the analysis have not been the subject of robust and recent research – again, gaps are highlighted as necessary. A further limitation was the tight timeframe and limited duration according to which this SitAn has been produced. This required the authors to prioritise areas of focus and to exclude some matters from the analysis. This also led to limitations to the extent of, for example, the causality analysis (which is considered but does not include problem trees), and the role pattern and capacity gap analyses, which inspire the presentation of the information but have not necessarily been formally performed for all duty-bearers. 1.4. Governance and validation The development and drafting of this SitAn have been guided by a UNICEF Steering Committee (comprising Andrew Colin Parker; Gerda Binder; Iosefo Volau; Laisani Petersen; Lemuel Fyodor Villamar; Maria Carmelita Francois; Settasak Akanimart; Stanley Gwavuya [Vice Chair], Stephanie Kleschnitzki; Uma Palaniappan; Vathinee Jitjaturunt [Chair] and Waqairapoa Tikoisuva), which supported the assessment and analysis process by providing comment, feedback and additional data and validating the contents. This governance and validation provided by the Steering Committee were particularly important given the limitations in data gathering and sourcing.
Context 15
2.
Context
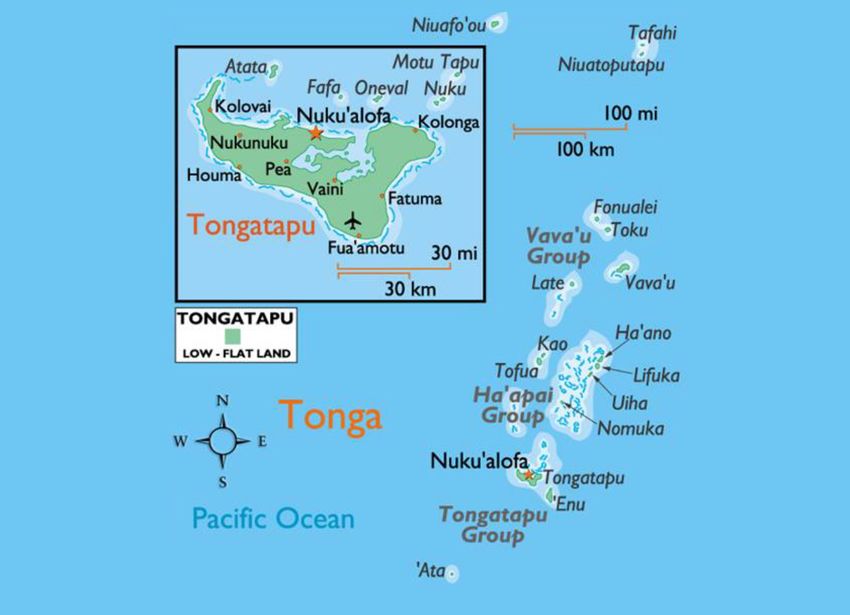
Map 2.1: Map of Tonga
Source: World Atlas8
8 World Atlas. Map of Tonga. http://www.worldatlas.com/webimage/countrys/oceania/lgcolor/tocolor.htm.16 S i t u a t i o n A n a l y s i s o f C h i l d r e n i n To n g a
2.1. Geography and demographics
Tonga is a Polynesian Kingdom made up of over 170 islands, 36 of which are inhabited. The total
area of the islands amounts to 747km2, spread over an area of around 700,000 km2 in the Pacific
Ocean.9 Tonga is made up of four main island groups: Tongatapu, Vava’u, Ha’apai, and Niuatoputapu
and Niuafo’ou.10 The capital is Nuku’alofa.
The most recent data from the World Bank placed the total population at 106,170 in 2016,11 of
which around 46,000 are under 18, and 13,000 are under 5.12 As illustrated by Figure 2.1, there
has been
Situation
a steady
Analysis
ratein
Tof
of
Children
population growth since the 1960s. The population growth rate since
onga
2006 has been slow, at 0.2 per cent.13
steady
rate
of
population
growth
since
the
1960s.
The
population
growth
rate
since
2006
has
been
slow,
at
0.2
per
cent.14
Figure
Figure
22.1: Population
.1:
Population
growth
growth
since
since
the
1 960s.
the 1960s
Source: Tonga Department of Statistics1514
Source:
Tonga
Department
of
Statistics.
The
majority
of
Tonga’s
population,
according
to
the
2011
census,
live
in
rural
areas
(79,023,
compared
The majority to
of
24,229
Tonga’s in
urban
areas).16
according
population, There
is
a
sto
ignificant
the 2011 trend
of
outward
census, live m inigration
rural areas from
(79,023,
Tonga,
particularly
to
New
Zealand,
the
US
and
Australia.
According
to
data
from
2004,
216,000
Tongans
compared to 24,229 in urban areas). There is a significant trend of outward migration from Tonga,
15
were
living
abroad,
and
almost
every
household
had
a
relative
in
another
country
(however,
more
recent
data
does
not
appear
to
be
available).17
18
9 The
life
expectancy
in
Tonga
is
71
years
for
men
and
76
years
for
women.
Tonga. http://www.nationsonline.org/oneworld/tonga.htm.
The
ethnic
makeup
of
Tonga’s
population
is
largely
homogenous,
with
96.6
per
cent
of
the
population
being
Tongan,
as
10 Tonga, OCHA. http://www.unocha.org/pacific/country-profiles/tonga.
11reported
World Bankin
2006
Data. (1.7
2016.per
Tonga cent
were
‘part-‐Tongan’
Population. and
1.7
per
cent
were
‘other’).19
The
official
http://data.worldbank.org/indicator/SP.POP.TOTL?locations=TO.
12 UNICEF. 2016. State of the World’s Children.
13 Tonga Department of Statistics (calculated based on population census data), http://tonga.prism.spc.int/component/
advlisting/?view=download&fileId=46&Itemid=301.
14
Ibid.
1514
Tonga
Ibid. Department
of
Statistics
(calculated
based
on
population
census
data),
http://tonga.prism.spc.int/component/advlisting/?view=download&fileId=46&Itemid=301
15
Ibid.
16Context 17
particularly to New Zealand, the US and Australia. According to data from 2004, 216,000 Tongans
were living abroad, and almost every household had a relative in another country (however, more
recent data does not appear to be available).16
The life expectancy in Tonga is 71 years for men and 76 years for women.17 The ethnic makeup
of Tonga’s population is largely homogenous, with 96.6 per cent of the population being Tongan,
as reported in 2006 (1.7 per cent were ‘part-Tongan’ and 1.7 per cent were ‘other’).18 The official
languages are Tongan and English. The country is majority Protestant (64.9 per cent), with a
significant minority of Mormons (16.8 per cent) and Roman Catholics (15.6 per cent).19
2.2. Main disaster and climate risks
Like many other Pacific Islands, Tonga is vulnerable to natural disasters, including cyclones.
Cyclone Ian, a Category 5 system with winds over 200 km/h, passed over the Ha’apai and Vava’u
island groups in January 2014.20 The island groups declared a state of emergency the same day,
and over 2,300 people sought formal and informal shelters. The cyclone caused one fatality and
injured 14, with extensive damage to infrastructure and agriculture.21 Over 50 per cent of the
estimated 1,130 buildings on Ha’apai’s affected islands were destroyed. 22
Tonga is in one of the most seismically active areas of the Pacific Ocean, leaving it at risk to
earthquakes, volcanic activity and tsunamis. The most recent and significant tsunami occurred in
September 2009, hitting Niuatoputapu with 6- to 17-metre-high waves. Nine lives were claimed,
507 people affected and many villages destroyed.23
In March 2015, at the Third UN World Conference on Disaster Risk Reduction, Tonga was
labelled the second most at-risk country in the world due to constantly being under threat.24
In 2015 a drought warning was declared because of the extremely dry weather over Tonga for
nearly a year.25
16 Cathy Small and David Dixon. 2004. Tonga: Migration and the homeland. http://www.migrationpolicy.org/article/
tonga-migration-and-homeland.
17 WHO. Tonga, available at http://www.who.int/countries/ton/en/.
18 CIA. The World Factbook: Tonga. https://www.cia.gov/library/publications/the-world-factbook/geos/tn.html.
19 Ibid.
20 OCHA. Tonga: Tropical Cyclone Ian strikes tiny Pacific nation. http://www.unocha.org/country/top-stories/all-stories/
tonga-tropical-cyclone-ian-strikes-tiny-pacific-nation.
21 Radio New Zealand, Tonga’s Ha’apai a year on from Cyclone Ian. http://www.radionz.co.nz/international/programmes/
datelinepacific/audio/20163990/tonga’s-ha’apai-a-year-on-from-cyclone-ian [30.06.17].
22 OCHA, Tonga: Tropical Cyclone Ian strikes tiny Pacific nation. Op. cit.
23 Ibid.
24 Secretariat of the Pacific Regional Environment Programme. http://www.sprep.org/climate-change/tonga-second-
most-at-risk-country-in-the-world.
25 Tonga. OCHA. Op. cit.18 S i t u a t i o n A n a l y s i s o f C h i l d r e n i n To n g a
Tonga’s National Emergency Management Plan, prepared under the provisions of the Emergency
Management Act (2007), provides the framework for responses to natural disasters. Alongside
identifying the risk environment in Tonga, the Plan establishes arrangements for a coordinated
response between government and regional agencies, and non-governmental bodies.26
2.3. Government and political context
Tonga is a constitutional monarchy: the only monarchy in the Pacific. It is a parliamentary democracy
with a unicameral Legislative Assembly consisting of 26 elected members, nine of whom are
elected by and among 33 hereditary nobles, and 17 according to the public vote, on the basis of
universal suffrage.27 The Prime Minister is chosen by the Legislative Assembly and appointed by
the monarch.28
In 2010, a new Constitution was adopted, following a period of tension characterized by riots
and looting during pro-democracy demonstrations. At least six people died and following the
riots, 150 Australian and New Zealand troops and police came to Tonga at the Prime Minister’s
request.29 The Constitution was developed after the establishment in 2008 of a Constitutional and
Electoral Commission, which was tasked with making proposals for a more democratic system of
government.30 As of June 2015, there were no women Members of Parliament in Tonga.
The main effort to include young people in governance and decision-making processes
is the Tonga National Youth Council, established in 1991, which is an independent body to
address youth issues.31 It is an umbrella organization for youth groups and NGOs and delivers
programmes focusing on “responsibility, good citizenship, community service and leadership.”
It worked on the development of the Tongan National Youth Policy in 2011 and runs an annual
Youth Parliament event.32
2.4. Socio-economic context
Tonga’s most recent national development plan is the Tonga Strategic Development
Framework 2015-2025. This framework seeks to achieve “a more progressive Tonga
supporting a higher quality of life for all”, with seven national outcomes relating to
26 Government of the Kingdom of Tonga. 2007. National Emergency Management Plan. http://pacificdisaster.net/
pdnadmin/data/original/TON_2007_National_Emergency_mgt_plan.pdf
27 The Commonwealth, Tonga: Constitution and Politics. http://thecommonwealth.org/our-member-countries/tonga/
constitution-politics.
28 Ibid.
29 Ibid.
30 Ibid.
31 Pacific Youth Council, Tongan National Youth Council. http://www.pacificyouthcouncil.org/tonga.php.
32 Youth Policy, Tonga. 2014. http://www.youthpolicy.org/factsheets/country/tonga/.Context 19
inclusivity and sustainability in relation to the economy, development, gender equality,
good governance, technology and infrastructure, land administration, security and
sovereignty.33
Tonga is classified as a lower middle-income country by the World Bank and had a Gross Domestic
Product (GDP) of just over US$435 million in 2016: a drop from 2012 (from around US$472.5
million).34 The Gross National Income per capita in 2011, was US$5,284.35 Tonga has a human
development index of 0.721 and is ranked 101 out of 188 countries, which places it in the ‘high
human development’ category.36
Economic growth has been slow in Tonga. Vulnerability to natural disasters, along with the global
recession, has impacted negatively on growth. Tonga’s economic resources and sources of
revenue are extremely limited, partly owing to its size. The economy is characterised by large
volumes of subsistence agriculture and it is heavily reliant on financial aid and remittances.37
In 2014/2015, Tonga received over US$76.4 million in Official Development Assistance (ODA).
Figure 2.2 shows that Australia was the leading donor (US$21.34 million). Significant contributions
were also made by the International Development Association (US$15.88 million), New Zealand
(US$14.69 million) and Japan (US$13.19).
June
2017
made
from
the
International
Development
Association
(US$15.88
million),
New
Zealand
(US$14.69
Figure
million)
a2.2: Top (ten
nd
Japan
donors
US$13.19).
of gross ODA for Tonga (2014-2015 average)
(US$ million)
Figure
2.2:
Top
ten
donors
of
gross
ODA
for
Tonga
(2014-‐2015
average)
(US$
million).
40
Source:
ODA
Source: ODA
CCharts lance.38
harts
aatt
aa
gglance
Figure
2.3
shows
that
bilateral
aid
was
allocated
mainly
to
economic
infrastructure
development
(28
per
cent)
and
social
infrastructure
services
(22
per
cent).
Thirteen
per
cent
was
spent
on
education
services.41
Figure
33 2.3:
Bilateral
Government of Tonga. ODA
Tonga received
Strategic b y
sector
for
Development Tonga
(2014-‐2014
Framework average)
2015-2025. http://www.finance.gov.to/sites/default/
files/TSDF%20II_English_printed%20to%20LA%20on%2019May2015_0.pdf [4.8.17].
34 World Bank Data: Tonga. http://data.worldbank.org/country/tonga; World Bank list of Economies March 2017. http://
databank.worldbank.org/data/download/site-content/CLASS.xls.
35 World Bank Data: Tonga. Op. cit.
36 Ibid.
37 The Commonwealth, Tonga: Economy. http://thecommonwealth.org/our-member-countries/tonga/economy.
38 OECD. ODA Charts at a Glance, Tonga. http://www.oecd.org/countries/tonga/aid-at-a-glance.htm.20 S i t u a t i o n A n a l y s i s o f C h i l d r e n i n To n g a
40
Source:
OFigure
DA
Charts
2.3 showsat
a
glance.
that bilateral aid was allocated mainly to economic infrastructure development
(28 per cent) and social infrastructure services (22 per cent). Thirteen per cent was spent on
Figure
2.3
shows
that
bilateral
aid
was
allocated
mainly
to
economic
infrastructure
development
(28
education services.39
per
cent)
and
social
infrastructure
services
(22
per
cent).
Thirteen
per
cent
was
spent
on
education
services.41
Figure
Figure
2.3:
2.3:
Bilateral
Bilateral
ODA
ODA
received
received
by
sector
by sector
for
Tonga
for Tonga
(2014-‐2014
(2014-2014 average)
average)
Source: OECD, ODA Charts at a glance, Tonga40
Source:
OECD,
ODA
Charts
at
a
glance,
Tonga.42
Tonga’s
economy
is
heavily
dependent
on
remittances,
with
the
majority
transferred
to
family
Tonga’s economy is heavily43dependent on remittances, with the majority transferred to family
members
remaining
on
the
island.
members remaining on the island.
A
2008
study
found
that
90
per
cent
of
households
relied
on
41
A 2008 study found that 90 per cent of households relied on
remittances,
42
which
were
equivalent to 48 per cent of GDP in 2002.43
40
OECD,
ODA
Charts
at
a
Glance,
Tonga,
Available
at:
http://www.oecd.org/countries/tonga/aid-‐at-‐a-‐glance.htm
41
Ibid.
A significant proportion of Tonga’s population are living in poverty and rates of poverty appear to
42
Ibid.
have increased since 2000. The 2009 Household Income and Expenditure Survey (HIES) found
43
IMF
Working
thatP22.5
aper,
per
Determinants
cent of the of
Rpopulation
emittances:
were
Evidence
living from
below Tonga,
the2010,
basicretrieved
from:
line: a rise from
needs poverty
http://www.imf.org/external/pubs/ft/wp/2011/wp1118.pdf
12.2 per cent in 2001. Concern has also been expressed about the significant number of persons
44
who are living just above the poverty line.45
21
39 Ibid.
40 Ibid.
41 IMF Working Paper. 2010. Determinants of Remittances: Evidence from Tonga. http://www.imf.org/external/pubs/ft/
wp/2011/wp1118.pdf.
42 Brown. 2008, in AusAID. 2010. Social protection in the Pacific: A review of its adequacy and role in addressing
poverty.
43 World Bank. 2015. Hardship and vulnerability in Pacific Island Countries, p. 64.
44 The results of the 2016 HIES have not yet been published.
45 Matthew Morris, Australian National University 2001. Measuring poverty in the pacific: discussion paper no. 7 (2001),
p. 13. https://devpolicy.anu.edu.au/pdf/papers/DP_9_-_Measuring_Poverty_in_the_Pacific.pdfContext 21
Children appear to be disproportionately vulnerable to poverty. The 2009 HIES found that
children aged 0 to 14 were more likely to be living in poor households. Around 29 per cent of
children were living below that basic needs poverty line, compared to 22.5 per cent of the wider
population.46
Inequality appears to be moderate compared to other PICTs, as measured by Gini coefficient.47
The Gini coefficient in Tonga was 0.24 according to the 2009 HIES: a slight rise from 0.23 in
2001. A comparison between the proportion of expenditure by the lowest and highest quintiles
is another measure of inequality. In Tonga, according to the 2009 HIES, the poorest quintile was
responsible for 10 per cent of total household consumption.48 Geographically disaggregated data
shows no significant difference in poverty levels in rural and urban areas, or between different
geographical regions.49
2.5. Legislative and policy framework
Tonga’s Judiciary is composed of the Court of Appeal, the Supreme Court, the Land Court
and the Magistrates’ Court.50 The judiciary also has a body, the Privy Council, which is
responsible for advising the monarch on legal issues, including hereditary estates and
titles.51 The Act of Constitution (Amendment No. 3) of 2010 guarantees the independence
of the judiciary.52
Tonga’s Constitution protects many rights and freedoms including: the right to live in freedom;
freedom to own and dispose property; freedom from slavery; and equality of application of laws
to all, regardless of gender, class, ethnicity or any classification.
Tonga does not have a policy or comprehensive law relating to children and children’s rights.
Crucially, this means that offences committed against children are extremely hard to prosecute
in the absence of comprehensive legal guidelines. UN Women has noted that there is also
no comprehensive domestic violence, sexual harassment, human trafficking, sex tourism or
family legislation in place. The law also contains limited definitions of rape and other sexual
offences.53
46 Tonga Statistics Department, Household Income and Expenditure Survey 2009 Report, retrieved from: http://catalog.
ihsn.org/index.php/catalog/3201.
47 The Gini coefficient is a number between zero and 1, where total equality is equal to zero and total inequality (one
person has everything) is equal to 1.
48 Tonga Statistics Department. Op. cit.
49 HIES, 2001 and 2009.
50 Regional Rights Resource Team. 2016. ‘Human Rights in the Pacific: A situational analysis’, 2016. http://rrrt.spc.int/
publications-media/publications/item/download/313_3uva695645ff8e36dd9b8c5ff8b2fd05c31.
51 Ibid.
52 Ibid.
53 http://asiapacific.unwomen.org/en/countries/fiji/co/tonga#sthash.WJdoDSDp.pdf.You can also read