Maintaining Diversity In America's Transit-Rich Neighborhoods
←
→
Page content transcription
If your browser does not render page correctly, please read the page content below

Maintaining Diversity In America’s
               Transit-Rich Neighborhoods:
               Tools for Equitable Neighborhood Change

               Dukakis Center for Urban and Regional Policy
OCTOBER 2010

               Stephanie Pollack     A Report Prepared by the       With the Generous Support of
               Barry Bluestone       Dukakis Center for Urban and
                                     Regional Policy at
               Chase Billingham
                                     Northeastern University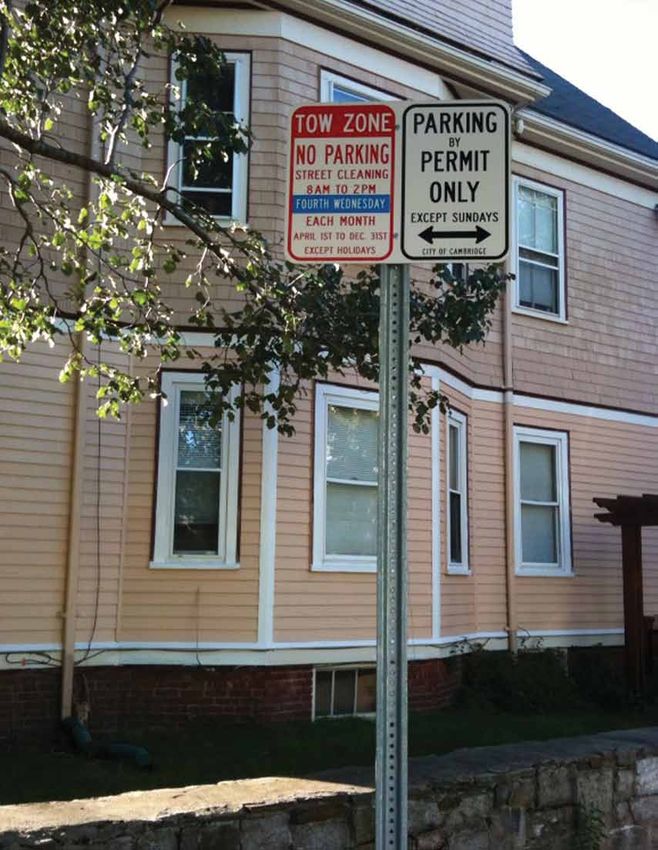
Acknowledgments                                                          Kitty and Michael Dukakis Center for
We gratefully acknowledge the funding support of the Rockefeller         Urban and Regional Policy
Foundation’s Promoting Equitable, Sustainable Transportation             The Kitty and Michael Dukakis Center for Urban and Regional
initiative and, in particular, the insights and patience of Managing     Policy conducts interdisciplinary research, in collaboration with
Director Nick Turner.                                                    civic leaders and scholars both within and beyond Northeastern
                                                                         University, to identify and implement real solutions to the critical
We also acknowledge the invaluable research support of Jessica
                                                                         challenges facing urban areas throughout Greater Boston, the
Herrmann and Marc Horne for their work constructing the transit
                                                                         Commonwealth of Massachusetts, and the nation. Founded in
station geographies used in this study and the equally invaluable
                                                                         1999 as a “think and do” tank, the Dukakis Center’s collaborative
efforts of Ishwar Khatiwada and Mykhaylo Trubskyy of Northeastern
                                                                         research and problem-solving model applies powerful data analysis,
University’s Center for Labor Market Studies in constructing the
                                                                         a bevy of multidisciplinary research and evaluation techniques,
database of 1990 and 2000 Census data. Additional thanks go to
                                                                         and a policy-driven perspective to address a wide range of issues
research associate Anna Gartsman and interns Gabriella Paiella and
                                                                         facing cities and towns. These include affordable housing, local
Dan Drazen for their research assistance.
                                                                         economic development, workforce development, transportation,
Finally, we wish to thank Diana Williams at the Funders' Network for     public finance, and environmental sustainability. The staff of the
Smart Growth and Livable Communities and Mary Skelton Roberts            Dukakis Center works to catalyze broad-based efforts to solve urban
at the Barr Foundation for organizing two roundtable convenings          problems, acting as both a convener and a trusted and committed
at which we were able to present our initial research findings and       partner to local, state, and national agencies and organizations.
conclusions; we similarly thank the many researchers, funders            The Center is housed within Northeastern University’s innovative
and advocates who participated in the two sessions and provided          School of Public Policy and Urban Affairs.
valuable feedback and insights.

While the authors are grateful to all of the aforementioned
individuals and organizations, the report’s research and conclusions
are solely the responsibility of the authors.

Credits
Design: one[visual]mind • www.onevisualmind.com
Photos Courtesy of:
Reconnecting America • front cover, p.3, p.5, p.8, p.14, p.16, p.17,
p.43, p.44, p.49; Willamor Media • inside front cover, p.1, p.21, p.33
METRO • p.36; Alliance for Regional Transit–Cincinnati • p.38, p.51
k.beck • p.50

3   DUKAKIS CENTER FOR URBAN AND REGIONAL POLICY
Contents

Executive Summary                                                                            1
CHAPTER 1     Why Diversity Matters: Transit and Neighborhood Diversity                      5
CHAPTER 2     Neighborhood Change and Transit: What We Know                                 16
CHAPTER 3     Neighborhood Change and Transit: What We Learned                              21
CHAPTER 4     A Toolkit for Equitable Neighborhood Change in Transit-Rich Neighborhoods     35

Appendices
Appendix A Methodology                                                                      55
Appendix B New Transit Stations Selected for Analysis                                       58

List of Figures and Tables
		            Breaking the Cycle of Unintended Consequences in Transit-Rich Neighborhoods   4
FIGURE 1.1    Transit-Served Metropolitan Areas                                             6
TABLE 1.1     Transit in America’s Largest Metropolitan Areas                                7
TABLE 1.2     Categories of Transit-Served Metropolitan Areas                               9
FIGURE 1.2    Economic Importance of Transit-Served Metropolitan Areas                      10
FIGURE 1.3    Diversity in Transit-Served Metropolitan Areas                                10
FIGURE 1.4    Housing in Transit-Served Metropolitan Areas                                  10
FIGURE 1.5    Diversity in Different Types of Transit-Served Metropolitan Areas—Blacks      11
FIGURE 1.6    Diversity in Different Types of Transit-Served Metropolitan Areas—Hispanics   11
figure 1.7    Ethnicity of Transit Passengers                                               13
FIGURE 1.8    Household Income of Transit Passengers                                        13
FIGURE 3.1    Population Growth (Initial Analysis)                                          23
FIGURE 3.2    Total Housing Units (Initial Analysis)                                        23
FIGURE 3.3    Non-Hispanic White Population Growth (Initial Analysis)                       23
FIGURE 3.4    Median Household Income (Initial Analysis)                                    23
FIGURE 3.5    Median Gross Rent (Initial Analysis)                                          24
FIGURE 3.6    In-Migration (Initial Analysis)                                               24
FIGURE 3.7    Public Transit Use for Commuting (Initial Analysis)                           24
FIGURE 3.8    Motor Vehicle Ownership (Initial Analysis)                                    24
FIGURE 3.9    Population Growth (Large Differences Analysis)                                26
FIGURE 3.10   Total Housing Units (Large Differences Analysis)                              26
FIGURE 3.11   Racial and Ethnic Composition (Large Differences Analysis)                    27
Contents continued

FIGURE 3.12   Household Income (Large Differences Analysis)                                 27
FIGURE 3.13   Housing Costs (Large Differences Analysis)                                    28
FIGURE 3.14   In-Migration (Large Differences Analysis)                                     28
FIGURE 3.15   Public Transit Use for Commuting (Large Differences Analysis)                 28
FIGURE 3.16   Motor Vehicle Ownership (Large Differences Analysis)                          28
FIGURE 3.17   Population Growth (Transit Type Analysis)                                     30
FIGURE 3.18   Total Housing Units (Transit Type Analysis)                                   30
FIGURE 3.19   Racial and Ethnic Composition (Transit Type Analysis)                         30
FIGURE 3.20 Median Household Income (Transit Type Analysis)                                 30
FIGURE 3.21   Housing Costs (Transit Type Analysis)                                         31
FIGURE 3.22   In-Migration (Transit Type Analysis)                                          31
FIGURE 3.23   Public Transit Use for Commuting (Transit Type Analysis)                      31
FIGURE 3.25   Motor Vehicle Ownership (Transit Type Analysis)                               31
TABLE 3.1     Comparison of Means (Light Rail TRNs vs. Heavy Rail and Commuter Rail TRNs)   32
              Breaking the Cycle of Unintended Consequences in Transit-Rich Neighborhoods   34

References                                                                                  62
Executive Summary

                                                                   neighborhoods. To the extent that undesirable patterns of
                                                                   neighborhood change were found, we also wanted to under-
                                                                   stand the underlying mechanisms in order to propose policy
                                                                   tools that could be used to shape equitable neighborhood
                                                                   change in both old and new TRNs.

                                                                   Our research found that transit investment frequently
                                                                   changes the surrounding neighborhood. While patterns of
                                                                   neighborhood change vary, the most predominant pattern
                                                                   is one in which housing becomes more expensive, neigh-
                                                                   borhood residents become wealthier and vehicle ownership
                                                                   becomes more common. And in some of the newly transit-
                                                                   rich neighborhoods, the research reveals how a new transit
                                                                   station can set in motion a cycle of unintended consequences
More than 3,000 transit-rich neighborhoods (TRNs)
                                                                   in which core transit users—such as renters and low income
in U.S. metropolitan areas have fixed-guideway transit
                                                                   households—are priced out in favor of higher-income, car-
stations and hundreds more such neighborhoods could
                                                                   owning residents who are less likely to use public transit for
be created over the next decade if current plans for new
                                                                   commuting. We believe that the risk that transit investment
transit systems and stations are realized. Americans
                                                                   could catalyze undesirable neighborhood change is substan-
are increasingly using transit and showing more interest in
                                                                   tial enough that it needs to be managed whenever transit
living in transit-rich neighborhoods. For neighborhood and
                                                                   investments or improvements are being planned. We therefore
equity advocates from Atlanta to Seattle and Minneapolis to
                                                                   present a toolkit of policy tools for shaping equitable neigh-
Houston, however, this good news is tempered by a growing
                                                                   borhood change in TRNs, tools that are increasingly available
concern about gentrification and displacement. Will current
                                                                   and in use across the country.
neighborhood residents, many of them low income and/or
people of color, benefit from planned transit stations? Or will    This report is divided into four parts. The first chapter
they be displaced by wealthier and less diverse residents lured    documents the diversity of the transit-served metropoli-
not only by transit but also by the other amenities that come      tan areas and TRNs in the United States and explores the
with transit-induced neighborhood revitalization?                  symbiotic relationship between diverse neighborhoods and
                                                                   successful transit. The second chapter reviews the most
Planners and policymakers would appear to face a Hobson’s
                                                                   recent literature on neighborhood change, gentrification and
choice if transit investment and expansion inevitably lead
                                                                   displacement, both in general and in TRNs, and highlights
to gentrification and displacement: either make the transit
                                                                   the different ways in which gentrification can occur and
investment and accept loss of neighborhood diversity as col-
                                                                   the importance of understanding who moves into gentrify-
lateral damage, or avoid transit expansion projects serving
                                                                   ing neighborhoods. The third chapter presents the results of
diverse, lower-income neighborhoods and leave those
                                                                   our new research on patterns of neighborhood change in 42
residents with poor public transit or none at all.
                                                                   neighborhoods in 12 metropolitan areas first served by rail
This report is based on research that was designed to address      transit between 1990 and 2000, and draws conclusions about
this dilemma. We wanted to understand whether gentrifica-          the likely mechanisms underlying the observed patterns of
tion and displacement are actually occurring in transit-rich       change in those neighborhoods. The final chapter summa-

                                                              Maintaining DIVERSITY in America’s Transit-Rich Neighborhoods     1
rizes a new web-based Policy Toolkit for Equitable Transit-          neighbors who will regularly use the system. There is a
Rich Neighborhoods designed to directly address the most             symbiotic relationship between diverse neighborhoods and
likely drivers of undesirable neighborhood change in TRNs            successful transit: transit systems benefit from and depend on
in order to help planners, policymakers and advocates shape          the racial and economic diversity of the neighborhoods that
equitable neighborhood change and ensure that the many               they serve, just as low-income households and people of color
benefits of transit investment are shared by all.                    depend on and benefit from living in neighborhoods served
                                                                     by transit.
Why Diversity Matters: Transit and
Neighborhood Diversity                                               Neighborhood Change and Transit:
Concerns about gentrification and displacement associated            What We Know
with transit have traditionally been framed as issues of equity:     Neighborhoods change over time, in ways that both benefit
will neighborhood change in TRNs adversely affect people of          and harm those who have been living there. Researchers,
color and lower-income residents? These equity concerns              policymakers and advocates have long been concerned about
emanate from the fact that transit-rich neighborhoods, and           patterns of neighborhood change that reduce the racial and/or
the larger metropolitan areas in which they are located,             economic diversity of neighborhoods. The second chapter of
are extraordinarily diverse and home to a disproportionate           this report explores prior studies that can help us understand
share of lower-income households and people of color.                how the presence of new or improved transit can change the
                                                                     surrounding neighborhood.
In 2010, there were 36 transit systems in the United States
providing what transportation planners call fixed-guideway           While the terms gentrification and displacement are fre-
(rail rather than bus) transit, with one additional such system      quently used interchangeably, recent research highlights
scheduled to open in 2011. These 37 regional transit systems         the importance of distinguishing between these two related
serve a total of 41 Metropolitan Statistical Areas (MSAs)            patterns of neighborhood change. Gentrification is a pattern
as defined by the U.S. Census. Using 2000 Census data, we            of neighborhood change in which a previously low-income
calculate that nearly half of all Americans and more than two-       neighborhood experiences reinvestment and revitalization,
thirds of all U.S. workers live in those 41 transit-served metros,   accompanied by increasing home values and/or rents. Gen-
as do over half of all blacks, 60 percent of all Hispanics and 70    trification, while frequently controversial, can be either good
percent of all immigrants in the United States. In addition,         or bad for a neighborhood, depending on who benefits from
slightly more than half of all U.S. rental housing is located in     the reinvestment and revitalization.
transit-served metros.
                                                                     Gentrification may or may not be associated with displace-
People of color, low-income households and renters share             ment, a pattern of change in which current residents are invol-
two related characteristics that may explain their concentra-        untarily forced to move out because they cannot afford to stay
tion in transit-served metropolitan areas. First, in a country       in the gentrified neighborhood. Recent studies indicate that
where over 95 percent of all households own at least one             displacement may not be the sole mechanism driving change
car, these three groups are disproportionately likely to live        in gentrifying neighborhoods. The demographic composi-
in households without vehicles. In addition, people of color,        tion of gentrifying neighborhoods can be altered through
low-income households and renters are all more likely to             a process of succession or replacement driven by acceler-
use transit than the average American. These three groups            ated turnover of the housing stock. This housing turnover
represent the majority of what we refer to as core transit           is marked both by unequal retention of existing residents
riders, those most likely to regularly use transit.                  (with wealthier and/or better-educated residents more likely
                                                                     to remain) and in-migration of wealthier, better-educated
Even as they work to attract a broader range of riders, transit
                                                                     residents. This pattern of change, while differing from the
systems need to maintain their core ridership to ensure that
                                                                     traditional model of involuntary displacement, nevertheless
total ridership continues to grow. Transit planners frequently
                                                                     raises serious equity concerns as the result is much the same:
speak of the need for transit-oriented development to support
                                                                     the resulting neighborhood is more expensive and populated
ridership, but what transit stations need is transit-oriented
                                                                     by higher-income residents.

2   DUKAKIS CENTER FOR URBAN AND REGIONAL POLICY
Few studies have been done on gentrification in TRNs and
those report varying results: in some cases new transit is put
in place with little neighborhood change, while other TRNs
experience extensive gentrification. When this literature
is supplemented with studies of changing travel behavior
in specific transit-oriented development projects in those
neighborhoods, however, important insights emerge. Certain
demographic groups—including core transit riders who
traditionally use transit, and also potential riders who may
choose to use transit—are attracted to well-planned TRNs in
a self-selection process that may contribute to the process of
replacement recently observed in gentrifying neighborhoods.
                                                                 expensive, neighborhood residents wealthier and vehicle
Understanding neighborhood change in TRNs therefore
                                                                 ownership more common. We found evidence of gentrifica-
requires a detailed understanding of both who lived in those
                                                                 tion in the majority of newly transit-served neighborhoods, if
neighborhoods before the transit was built and who lives
                                                                 gentrification is defined as a pattern of neighborhood change
there afterward.
                                                                 marked by rising housing costs and incomes.

Neighborhood Change and Transit:                                 Our research also provides support for the conclusion that
What We Learned                                                  neighborhoods with a large number of renters are more sus-
To better understand patterns of neighborhood change in          ceptible to gentrification. Indeed, when we specifically looked
newly transit-rich neighborhoods, the third chapter of the       at the neighborhoods where the new stations were light rail
report analyzes socioeconomic changes in 42 neighborhoods        —neighborhoods which, in our study, were more likely to be
in 12 metropolitan areas first served by rail transit between    dominated pre-transit by low-income, renter households than
1990 and 2000. Because prior research on gentrification and      those in the heavy rail and commuter rail neighborhoods—
TRNs had looked at only a few characteristics, we explore        almost every aspect of neighborhood change was magnified:
a broad range of population, housing and transportation          rents rose faster and owner-occupied units became more
characteristics. For each of the 42 neighborhoods analyzed,      prevalent.
we studied changes between 1990 and 2000 in population,
                                                                 Our research did not, however, find that a new transit station
racial and ethnic composition, and in-migration; the number
                                                                 automatically leads to fundamental change in a neighbor-
of housing units, tenure, housing value and rent; household
                                                                 hood's racial composition. Perhaps, as other recent studies
income; and the use of public transit for commuting purposes
                                                                 of gentrification have found, the relatively higher retention of
and automobile ownership. We then compared the neighbor-
                                                                 higher-income black and Hispanic households and/or the in-
hood level changes to those in each neighborhood’s corre-
                                                                 migration of racially mixed, higher income residents results in
sponding metropolitan area to see if patterns of neighborhood
                                                                 a wealthier neighborhood but one with a racial composition
change in the TRNs differed from corresponding changes in
                                                                 similar to that of the pre-transit neighborhood.
the region.
                                                                 Gentrification can be a positive form of neighborhood change
As in prior studies, we found that patterns of neighborhood
                                                                 but can also have adverse consequences. Our analysis found
change varied across the transit-rich neighborhoods we inves-
                                                                 evidence of at least two gentrification-related concerns. Even
tigated. Many of the TRNs changed in ways that were roughly
                                                                 if no displacement can be proven to occur in TRNs, rapidly
similar to the underlying pattern of change in their larger
                                                                 increasing rents mean that those renter households who
metro areas. We focused, however, on those TRNs where
                                                                 choose to remain and take advantage of the new transit will
changes were more pronounced than those in the surround-
                                                                 experience higher housing cost burdens. In addition, neigh-
ing metropolitan area. In these neighborhoods, a predomi-
                                                                 borhood revitalization sometimes attracts not only higher-
nant pattern of neighborhood change could be discerned:
                                                                 income residents but also car-owning residents.
with the addition of transit, housing stock became more

                                                            Maintaining DIVERSITY in America’s Transit-Rich Neighborhoods      3
Breaking the Cycle of Unintended Consequences in Transit-Rich Neighborhoods

    Planning Tools                                                                             Neighborhood
                                                                                               income rises
     Housing
                                                   Land values                   Accelerated                  Motor
    Market Tools                                   increase                      housing                      vehicle
                                    Transit                        Rents and     turnover                     ownership     Transit
     Acquisition                    station                        home values                                increases     commuting
       funds                        planned                        increase                                                 fails to rise
     Preservation                                                                                                           as expected
     of affordable
    rental housing

     Affordable
      housing
     production

 Transportation
  Management
     Tools

In some of the neighborhoods studied, the new transit                  of the report summarizes a new web-based Policy Toolkit for
station seems to have set in motion a cycle of unintended              Equitable Transit-Rich Neighborhoods which describes three
consequences that reduced neighborhood residency by those              types of policy tools, as illustrated above.
groups most likely to use transit in favor of groups more likely
                                                                       Planning Tools: Because neighborhood change can
to drive. Utilization of public transit for commuting in this
                                                                       happen quickly, particularly in neighborhoods dominated by
problematic subset of newly transit-served neighborhoods
                                                                       rental housing, policymakers need to get ahead of potential
actually rose more slowly (or, in some cases, declined faster)
                                                                       problems by using coordinated and community-responsive
than in the corresponding metropolitan area as a whole.
                                                                       planning tools that begin at the same time as transit planning,
Whether by displacement or replacement, or a combination
                                                                       explicitly consider the risks of gentrification and include
of the two, in some transit-rich neighborhoods the pattern
                                                                       everyone with a stake in the neighborhood’s future.
of change is working against the goal of attracting transit-
oriented neighbors: the most likely potential transit riders           HOUSING MARKET TOOLS: Because one of the most
are being crowded out by car owners less likely to be regular          noticeable and damaging signs of transit-induced gentrifica-
users of transit. This cycle, illustrated above, raises concerns       tion is rapidly rising rents and housing values, policies that
about both equity, because core transit riders are predomi-            address housing are critical. The Toolkit focuses on three cat-
nantly people of color and/or low income, and about the                egories of housing market tools:
success of new transit investments in attracting desired levels
                                                                       • Funding for land and property acquisition;
of ridership.
                                                                       • Preservation of existing affordable rental housing; and
A Toolkit for Equitable Neighborhood                                   • Affordable housing production.
Change in Transit-Rich Neighborhoods
                                                                       Transportation Management Tools: Because one
Our research reveals that transit investment can sometimes
                                                                       characteristic of gentrifying TRNs is an increase in wealthier
lead to undesirable forms of neighborhood change. Under-
                                                                       households who are also more likely to own and use private
standing the mechanisms behind such neighborhood change
                                                                       vehicles and less likely to use transit for commuting, policies
can, however, allow policymakers, planners and advocates to
                                                                       must be designed to attract core and potential transit riders to
implement policies and programs designed to produce more
                                                                       transit-rich neighborhoods, particularly non-vehicle owning
equitable patterns of neighborhood change. The final chapter
                                                                       households.

4     DUKAKIS CENTER FOR URBAN AND REGIONAL POLICY
CHapter 1
          Why Diversity Matters:
          Transit and Neighborhood Diversity

                                                                                      lines and extensions to existing systems began operation
                                                                                      between 2003 and 2007 (CTOD, 2009a) and 175 new fixed-
                                                                                      guideway transit lines entered the New Starts Program, the
                                                                                      federal funding source for transit, between 1998 and 2008.
                                                                                      More than 80 cities and regions throughout the country are
                                                                                      currently planning more than $250 billion in transit projects
                                                                                      (Belzer & Poticha, 2009). This public investment in transit
                                                                                      infrastructure has, in turn, catalyzed billions of dollars in
                                                                                      private investment in housing and commercial development
                                                                                      near new transit stations and, in some cases, near decades-
                                                                                      old existing stations (CTOD, 2008).

                                                                                       Good News or Bad?
Americans are increasingly using transit and showing                                  For neighborhood and equity advocates from Atlanta to
more interest in living near transit, in what we call transit-                        Seattle and Minneapolis to Houston, however, this good
rich neighborhoods (TRNs). After decades of flat growth                               news is tempered by a growing concern about gentrifica-
alternating with declines, transit ridership in the United                            tion and displacement. Will current neighborhood residents,
States began rising in 1995 and has been growing steadily                             many of them low income and/or people of color, benefit
for more than a decade. Public transportation ridership grew                          from planned transit stations? Or will they be displaced by
36 percent between 1995 and 2008, almost three times the                              wealthier and less diverse residents lured not only by transit
14 percent growth rate of the U.S. population. In 2008, U.S.                          but also by the other amenities that come with transit-
transit systems carried passengers on 10.5 billion trips, the                         induced neighborhood revitalization?
largest number of trips taken on transit since 1956. Despite a
                                                                                      Planners and policymakers would appear to face a Hobson’s
recession-induced ridership drop of 3.8 percent in 2009, the
                                                                                      choice if transit investment and expansion inevitably lead
year closed out as the fourth year in a row in which ridership
                                                                                      to gentrification and displacement: either make the transit
exceeded 10 billion trips (American Public Transportation
                                                                                      investment and accept loss of neighborhood diversity as
Association [APTA], 2010).
                                                                                      collateral damage, or avoid transit expansion projects serving
Transit systems—not just transit ridership—are also growing,                          diverse, lower-income neighborhoods and leave those
with new stations and even entire systems being planned                               residents with poor public transit or none at all.
and built. There are already more than 3,300 fixed-guide-
                                                                                      This report is based on research that was designed to address
way transit stations in the United States, according to the
                                                                                      this dilemma. We wanted to understand whether gentrifica-
Center for Transit-Oriented Development (CTOD, 2006)1,
                                                                                      tion and displacement is actually occurring in transit-rich
and hundreds more transit-rich neighborhoods could be
                                                                                      neighborhoods. And, to the extent that undesirable patterns
created over the next decade if current plans for new transit
                                                                                      of neighborhood change were found, we wanted to under-
systems and stations are realized. Two dozen new light rail
                                                                                      stand the underlying mechanisms in order to propose policy

1
    CTOD defines fixed-guideway transit as including light rail, heavy rail (subways), commuter rail, streetcars, trolley buses, bus rapid transit and cable cars.
    Buses, although an important type of transit, do not operate on fixed guideways (CTOD, 2006). We define a transit-rich neighborhood as one that is served
    by such fixed-guideway transit.

                                                                               Maintaining DIVERSITY in America’s Transit-Rich Neighborhoods                         5
tools that could be used to shape equitable neighborhood                                   that the United States is a metropolitan nation, with its met-
change in both old and new TRNs. Before presenting this                                    ropolitan areas containing 83 percent of the U.S. population
new research and an accompanying Policy Toolkit, however,                                  and 85 percent of the nation’s jobs.2
we provide some context by documenting the extraordinary
                                                                                           The relatively small number of metropolitan areas which
reservoir of diversity currently found in America’s transit-
                                                                                           have fixed-guideway transit comprise a large proportion of
served metropolitan areas and transit-rich neighborhoods,
                                                                                           the nation’s largest and most economically important regions.
and exploring the symbiotic relationship that exists between
                                                                                           As illustrated in Figure 1.1 and Table 1.1, all but three of the
those diverse neighborhoods and successful transit.
                                                                                           25 most populous metropolitan areas in the United States had
                                                                                           rail transit systems in 2005. Phoenix subsequently opened
Where Is the Transit?
                                                                                           its first transit line in 2008; Detroit, the largest metro area
Transit-rich neighborhoods are concentrated in the nation’s
                                                                                           without a rail transit system, is currently working to begin
largest and most economically important metropolitan areas.
                                                                                           construction of its first light rail line, the M-1. Cincinnati, the
As defined by the federal Office of Management and Budget, a
                                                                                           only other top-25 metro area without rail transit, has plans
metropolitan area is a region with “at least one urbanized area
                                                                                           to build both streetcar and light rail systems. In addition, 16
of 50,000 or more population, plus adjacent territory that has
                                                                                           of the other 25 metro areas ranked in the country’s top 50 by
a high degree of social and economic integration with the core
                                                                                           population either had transit systems in 2005 or have built
as measured by commuting ties.” The United States currently
                                                                                           systems since then. Table 1.1 categorizes each transit system
has 366 metropolitan statistical areas (MSAs). The Brookings
                                                                                           by size following the system used by the Center for Transit
Institution’s Metropolitan Policy Program has demonstrated

FIGURE 1.1 Transit-Served Metropolitan Areas
                                                                                                                                        Transit System Category
                                                                                                                                            Legacy           Evolving
                                                                                                                                            Modest           Stations selected
                         Seattle-Tacoma-                                                                                                    Emerging         for analysis
                          Bellevue, WA
                                                           Denver-Aurora-                       Chicago-Naperville-
                                                           Broomfield, CO                         Joliet, IL-IN-WI
              Eugene-
           Springfield, OR
                                                                             Minneapolis-St. Paul-                     Syracuse, NY
                                                                             Bloomington, MN-WI
                                                                                                                                                         Boston-Cambridge-
                                                                                                             Pittsburgh, PA                               Quincy, MA-NH
       Sacramento-
      Arden-Arcade-
       Roseville, CA                       Salt Lake City, UT
                                                                                                                                                      New York-Northern
                                                                            Kansas City,                                                             New Jersey-Long Island,
                                                                              MO-KS                                                                        NY-NJ-PA
    San Francisco-
       Oakland-
     Fremont, CA                                                                                         St. Louis,                             Washington-Arlington-
                                                                                                          MO-IL                               Alexandria, DC-VA-MD-WV

                                                                                Memphis, TN-MS-AR                                              Virginia Beach-Norfolk-
        Riverside-San                                                                                                                          Newport News, VA-NC
         Bernadino-
         Ontario, CA
                                                                                                                                      Atlanta-Sandy Springs-
                                                                                                                                           Marietta, GA
                        Phoenix-Mesa-
                        Scottsdale, AZ          Albuquerque,                                                                          Jacksonville, FL
                                                    NM

                                                                                                                                           Miami-Fort Lauderdale-
                                                       Dallas-Fort Worth-                                                                   Pompano Beach, FL
                                                         Arlington, TX                     Houston-Sugar Land-
                                                                                              Baytown, TX

2
    The web site of the Metropolitan Policy Program can be found at http://www.brookings.edu/metro/About-Us.aspx.

6     DUKAKIS CENTER FOR URBAN AND REGIONAL POLICY
Table 1.1 Transit in America's Largest Metropolitan Areas
Rank by Population Metropolitan Statistical Area Population 2005 Transit System 2005
1 New York-Northern New Jersey-Long Island, NY-NJ-PA 18,747,320 Extensive
2 Los Angeles-Long Beach-Santa Ana, CA 12,923,547 Large
3 Chicago-Naperville-Joliet, IL-IN-WI 9,443,356 Extensive
4 Philadelphia-Camden-Wilmington, PA-NJ-DE-MD 5,823,233 Extensive
5 Dallas-Fort Worth-Arlington, TX 5,819,475 Medium
6 Miami-Fort Lauderdale-Miami Beach, FL 5,422,200 Medium
7 Houston-Baytown-Sugar Land, TX 5,280,077 Small
8 Washington-Arlington-Alexandria, DC-VA-MD-WV 5,214,666 Large
9 Atlanta-Sandy Springs-Marietta, GA 4,917,717 Medium
10 Detroit-Warren-Livonia, MI 4,488,335 None (In Planning)
11 Boston-Cambridge-Quincy, MA-NH 4,411,835 Extensive
12 San Francisco-Oakland-Fremont, CA 4,152,688 Extensive
13 Riverside-San Bernardino-Ontario, CA 3,909,954 Large (part of LA)
14 Phoenix-Mesa-Scottsdale, AZ 3,865,077 To open in 2008
15 Seattle-Tacoma-Bellevue, WA 3,203,314 Medium
16 Minneapolis-St. Paul-Bloomington, MN-WI 3,142,779 Small
17 San Diego-Carlsbad-San Marcos, CA 2,933,462 Medium
18 St. Louis, MO-IL 2,778,518 Medium
19 Baltimore-Towson, MD 2,655,675 Medium
20 Tampa-St. Petersburg-Clearwater, FL 2,647,658 Small
21 Pittsburgh, PA 2,386,074 Medium
22 Denver-Aurora, CO 2,359,994 Small
23 Cleveland-Elyria-Mentor, OH 2,126,318 Medium
24 Portland-Vancouver-Beaverton, OR-WA 2,095,861 Large
25 Cincinnati-Middletown, OH-KY-IN 2,070,441 None (In Planning)
26 Sacramento--Arden-Arcade--Roseville, CA 2,042,283 Medium
27 Kansas City, MO-KS 1,947,694 Small
28 Orlando, FL 1,933,255 None (In Planning)
29 San Antonio, TX 1,889,797 None
30 San Jose-Sunnyvale-Santa Clara, CA 1,754,988 Extensive (part of SF)
31 Las Vegas-Paradise, NV 1,710,551 Small (private)
32 Columbus, OH 1,708,625 None
33 Virginia Beach-Norfolk-Newport News, VA-NC 1,647,346 To open in 2011
34 Indianapolis, IN 1,640,591 None
35 Providence-New Bedford-Fall River, RI-MA 1,622,520 Extensive (part of Boston)
36 Charlotte-Gastonia-Concord, NC-SC 1,521,278 Small
37 Milwaukee-Waukesha-West Allis, WI 1,512,855 None
38 Austin-Round Rock, TX 1,452,529 To open in 2010
39 Nashville-Davidson--Murfreesboro, TN 1,422,544 To open in 2006
40 New Orleans-Metairie-Kenner, LA 1,319,367 Small
41 Memphis, TN-MS-AR 1,260,905 Small
42 Jacksonville, FL 1,248,371 Small
43 Louisville, KY-IN 1,208,452 None
44 Hartford-West Hartford-East Hartford, CT 1,188,241 None (In Planning)
45 Richmond, VA 1,175,654 None
46 Oklahoma City, OK 1,156,812 None
47 Buffalo-Niagara Falls, NY 1,147,711 Small
48 Birmingham-Hoover, AL 1,090,126 None
49 Rochester, NY 1,039,028 None
50 Salt Lake City, UT 1,034,484 Medium
Maintaining DIVERSITY in America’s Transit-Rich Neighborhoods 7account for more than two-thirds of all transit-rich neigh-
The geographic distribution of transit in the borhoods in the nation. But a large and growing number
United States has changed in recent decades as of TRNs are located beyond these five legacy systems. A
new transit systems have begun service and second group of 14 metros—including Atlanta, Los Angeles
older ones have expanded. and Washington, D.C.—was categorized as having evolving
transit systems because both the metro areas and their transit
systems (originally constructed starting in the 1970s, through
Oriented Development: extensive systems are those that have the 1990s) are generally growing at a more rapid pace than
201 or more stations, large systems have 70-200 stations, those in the legacy systems. A third set of metros was cat-
medium systems have 25-69 stations and small systems have egorized as having emerging transit systems because none
24 or fewer stations. had rail transit until after 2000 and all have plans to grow
their new transit system to at least medium size (25 or more
As of 2010, there were 36 fixed-guideway transit systems in
stations) by 2030; these include many fast-growing Sun Belt
the United States, with one more (in the Virginia Beach-
metros such as Phoenix, Houston and Albuquerque. Finally,
Norfolk-Newport News, Virginia, metropolitan area) under
a handful of modest transit systems exist in smaller metros
construction and scheduled to open in 2011.3 These 37 fixed-
with limited or no plans to grow their transit systems; most
guideway transit systems serve a total of 41 Metropolitan Sta-
(with the exception of Jacksonville) expect little job or popu-
tistical Areas (MSAs), as shown in Figure 1.1 and Table 1.2.
lation growth over the next two decades.
While most of the transit-served metropolitan areas are coin-
cident with a single MSA, in three cases we combine several To better understand these different transit-served metropol-
MSAs in order to define a transit-served metropolitan area itan areas and their economic importance and socioeconomic
that is geographically matched to the region’s transit system.4 composition, we aggregated data from the 2000 Census to
create a composite profile of transit-served metropolitan
The geographic distribution of transit in the United States
areas in the United States.
has changed in recent decades as new transit systems have
begun service and older ones have expanded. In order to
understand and assess the different types of transit-served
metropolitan areas in the country, we grouped the transit-
served metros into four categories based on (1) the transit
system’s age, (2) its size and transit expansion plans, (3)
the surrounding metro area’s projected population growth
rate and (4) the projected employment-growth rate for the
area. As shown in Table 1.2, we have divided U.S. transit
systems and the metropolitan areas they serve into four
categories: legacy, evolving, emerging and modest systems.
The legacy transit systems are the five oldest and largest
transit systems in the United States: Boston, Chicago, New
York, Philadelphia and San Francisco. All have transit systems
that are more than a century old and these five systems alone
3
Two transit systems included in the Center for Transit Oriented Development’s database of transit systems and stations are not included in our calculations.
Island Transit in Galveston, Texas, has been omitted both because Galveston is included in the Houston MSA and because the six-mile trolley service
originally opened in 1988 has been suspended since being severely damaged by Hurricane Ike in 2005. Las Vegas has only a privately owned transit service,
a monorail, with seven stops but no fixed-guideway public transit as yet.
4
The Boston metropolitan area combines three MSAs which are served by the Massachusetts Bay Transportation Authority’s commuter rail network;
the San Francisco metropolitan area combines the San Francisco and San Jose MSAs, which are linked by the Caltrain commuter rail system; and the
Los Angeles metropolitan area combines the Los Angeles and Riverside MSAs, which are linked by the Metrolink commuter rail system.
8 DUKAKIS CENTER FOR URBAN AND REGIONAL POLICYTable 1.2 Categories of Transit-Served Metropolitan Areas
Transit-Served Metro Areas Year of Initial Transit System Anticipated Transit Metropolitan Statistical Area(s)
Operation Size in 2005 System Size in 2030*
5 Legacy Systems
Boston MA 1897 Extensive Extensive+ Boston-Cambridge-Quincy MA-NH
Worcester MA
Providence-New Bedford-Fall River RI-MA
Providence-New Bedford-Fall River RI-MA
Chicago IL 1893 Extensive Extensive+ Chicago-Naperville-Joliet IL-IN-WI
New York NY 1904 Extensive Extensive+ New York-Northern New Jersey-Long Island
NY-NJ-PA
Philadelphia PA 1907 Extensive Extensive+ Philadelphia-Camden-Wilmington PA-NJ-DE-MD
San Francisco CA 1878 Extensive Extensive+ San Francisco-Oakland-Fremont CA
San Jose-Sunnyvale-Santa Clara CA
14 Evolving Systems
Atlanta GA 1979 Medium Large Atlanta-Sandy Springs-Marietta GA
Baltimore MD 1983 Medium Large Baltimore-Towson MD
Dallas-Fort Worth TX 1996 Medium Large Dallas-Fort Worth-Arlington TX
Denver CO 1994 Small Large Denver-Aurora-Broomfield CO
Los Angeles CA 1990 Large Extensive Los Angeles-Long Beach-Santa Ana CA
Riverside-San Bernardino-Ontario CA
Memphis TN 1993 Small Medium Memphis TN-AR-MS
Miami FL 1984 Medium Large Miami-Fort Lauderdale-Pompano Beach FL
New Orleans LA 1835 Small Medium New Orleans-Metarrie-Kenner LA
Portland OR 1986 Large Extensive Portland-Vancouver-Beaverton OR-WA
Sacramento CA 1987 Medium Large Sacramento—Arden-Arcade—Roseville CA
Salt Lake City UT 1999 Medium Large Salt Lake City UT
San Diego CA 1995 Medium Large San Diego-Carlsbad-San Marcos CA
Seattle WA 1982 Medium Large Seattle-Tacoma-Bellevue WA
Washington DC 1976 Large Extensive Washington-Arlington-Alexandria DC-VA-MD-WV
12 Emerging Systems
Albuquerque NM 2006 Small Medium Albuquerque NM
Austin TX 2010 Small Medium Austin-Round Rock TX
Charlotte NC 2007 Small Large Charlotte-Gastonia-Concord NC-SC
Eugene OR 2007 Small Medium Eugene-Springfield OR
Houston TX 2004 Small Medium Houston-Sugar Land-Baytown TX
Kansas City MO-KS 2005 Small Medium Kansas City MO-KS
Little Rock AK 2004 Small Medium Little Rock-North Little Rock-Conway AR
Minneapolis-St. Paul MN 2004 Small Medium Minneapolis-St. Paul-Bloomington MN-WI
Nashville TN 2006 Small Medium Nashville-Davidson—Murfreesboro—Franklin TN
Norfolk VA 2011 Under Medium Virginia Beach-Norfolk-Newport News VA-NC
construction
Phoenix AZ 2008 Small Medium Phoenix-Mesa-Scottsdale AZ
Tampa FL 2002 Small Medium Tampa-St. Petersburg-Clearwater FL
6 Modest Systems
Buffalo NY 1984 Small Small Buffalo-Niagara Falls NY
Cleveland OH 1913 Medium Medium Cleveland-Elyria-Mentor OH
Jacksonville FL 1971 Small Unknown Jacksonville FL
Pittsburgh PA 1897 Medium Medium Pittsburgh PA
St. Louis MO 1993 Medium Medium St. Louis MO-IL
Syracuse NY 1970 Small Small Syracuse NY
*Based on projections by the Center for Transit-Oriented Development, 2006.
Maintaining DIVERSITY in America’s Transit-Rich Neighborhoods 9Diversity in Transit-Rich Metropolitan Figure 1.3
Areas and Neighborhoods Diversity in Transit-Served
Principal Cities
In compiling data from the 2000 Census for the 41 MSAs Metropolitan Areas Metro Areas
served by fixed-guideway transit, we created two aggregate
data sets, one for the principal cities in each of the transit- 80
served metro areas and one for the metropolitan areas as a
Percentage of U.S. Total in (2000)
70
whole. Transit systems tend to be constructed in a spoke-and-
60
hub pattern designed to move trips to the central business
50
district in the principal city of a metropolitan area; transit
stations tend to be concentrated in or near the principal city 40
rather than spread throughout entire MSA. Because regional 30
transit systems serve principal cities more intensively than the
20
region as a whole, transit use for commuting, as reported on
10
the American Community Survey, is more than 11 percent-
age points higher in the principal cities than in the suburban 0
White Black Hispanic Other Foreign-
portions of America’s metropolitan areas (Istrate, Puentes & (Race) Born
Tomer, 2010). For this reason, we looked at both the MSAs as
a whole and at their principal cities.
transit-served metropolitan areas are home to half of the
Constituting just over 10 percent of all U.S. metropolitan areas, black population, over 60 percent of the Hispanic population,
transit-served metros are economically important and extraor- and over 70 percent of the nation’s immigrants. About two-
dinarily diverse. As of 2000, as shown in Figure 1.2, transit- thirds of the blacks and one-half of the Hispanics in the U.S.
served metropolitan areas were home to nearly half of the live in the principal cities of these metros.
country’s residents and over 70 percent of its workforce. The
Finally, transit-served metropolitan areas include a dispro-
principal cities in these metro areas alone contained 19 percent
portionate share of U.S. rental housing. In 2000, as shown in
of the nation’s population and 29 percent of its workforce.
Figure 1.4, transit-served metro areas accounted for slightly
Transit-served metropolitan areas are also places of concen- more than half of the nation’s rental housing; the principal
trated racial and ethnic diversity. As shown in Figure 1.3, cities of these 41 metro areas alone accounted for nearly 30
Figure 1.2 Figure 1.4
Economic Importance of Transit-Served Housing in Transit-Served Metropolitan Areas
Metropolitan Areas
80 60
Percentage of U.S. Total in (2000)
Principal Cities Principal Cities
Percentage of U.S. Total in (2000)
70 Metro Areas Metro Areas
50
60
40
50
40 30
30
20
20
10
10
0 0
Population Workforce Housing Owner Renter
2000 2000 Units Occupied Occupied
Housing Type
10 DUKAKIS CENTER FOR URBAN AND REGIONAL POLICYpercent of all rental units. Rental housing is even more con- These are among the groups that neighborhood and equity
centrated in those portions of transit-served metropolitan advocates are concerned about when they worry about gen-
areas closest to transit stations: an analysis of 2000 Census trification and displacement in transit-rich neighborhoods.
data found that renters made up nearly two-thirds of those But is equity the only concern if neighborhood diversity is
living in the 3,300 transit zones (areas within a one-half mile put at risk by transit? Should transit planners and supporters
radius of fixed guideway transit stations) in the Center for be concerned as well?
Transit Oriented Development’s database (CTOD, 2006).
Similarly, a recent analysis of federally subsidized affordable
Figure 1.5
rental apartments in 20 metropolitan areas identified nearly
Diversity in Different Types of Transit- Principal Cities
200,000 such units within one-quarter mile of transit stations Served Metropolitan Areas—Blacks Metro Areas
(Harrell, Brooks & Nedwick, 2009).
60
These high concentrations of people of color, immigrants
Percentage of U.S. Total in (2000)
and renters could be attributed to the inclusion of a handful 50
of particularly large and diverse regions among the transit-
40
served metropolitan areas. Our analysis did find that the met-
ropolitan areas served by the five large legacy transit systems 30
(Boston, Chicago, New York, Philadelphia and San Francisco)
are home to one in five blacks and Hispanics in the United 20
States. But, as shown in Figures 1.5 and 1.6, the 14 evolving
10
transit systems are also diverse, with nearly one-third of all
the nation’s Hispanics and one-fifth of all U.S. blacks living 0
Mature/ Evolving Emerging Mature/ All Transit
in these faster-growing metros, including Atlanta, Dallas, Extensive Modest Metros
Miami, Salt Lake City and Washington, D.C. These metros Transit System Category
are also home to over one-third of all foreign-born residents;
another 30 percent of immigrants live in the five metros Figure 1.6
served by legacy systems. Metro areas served by the dozen Diversity in Different Types of Transit- Principal Cities
Served Metropolitan Areas—Hispanics Metro Areas
evolving systems also have significant populations of black,
Hispanic and immigrant residents. 70
Percentage of U.S. Total in (2000)
Our findings about the diversity of transit-served metro- 60
politan areas are consistent with other analyses of diversity
50
in TRNs. The Center for Transit-Oriented Development,
for example, analyzed the demographics of more than 3,300 40
transit zones (similar but not identical to our TRNs) and 30
found that 86 percent were either more economically diverse,
20
more racially diverse, or both, than the average census tract in
the same metropolitan area. Nearly 60 percent of those living 10
in the transit zones were non-white and 65 percent were
0
renters (CTOD, 2007). Mature/ Evolving Emerging Mature/ All Transit
Extensive Modest Metros
Transit-rich neighborhoods and the larger metropolitan Transit System Category
areas in which they are located are extraordinarily diverse
places and are home to a disproportionate share of people
of color, immigrants and renters in the United States.
Maintaining DIVERSITY in America’s Transit-Rich Neighborhoods 11Transit and Neighborhood Diversity Our review of the literature identified three demographic
Putting issues of equity aside, there are reasons to be groups who are more likely to use transit and more likely to
concerned if transit-rich neighborhoods gentrify and their live near transit than other Americans: people of color, low-
diversity is reduced. One potential concern is that neigh- income households and renters. In a country where over 95
borhood change could affect transit ridership, since nearby percent of all households own at least one car, these three
neighborhoods would seem to be vital sources of transit pas- groups are also disproportionately likely to live in house-
sengers.5 Changing neighborhoods, and changing neighbors, holds without vehicles. Vehicle ownership—or, rather, lack
could affect transit use and thus the very reason for the transit of ownership—is a strong predictor of transit use. While
investment. only 4.3 percent of U.S. households lack a car, according to
2006-2008 American Community Survey data, 36 percent of
In order to evaluate the importance of neighborhood all workers 16 years and older who report that they commute
diversity to transit success, we reviewed the available data to work using public transportation live in households
and literature on the demographics of transit users and on without a vehicle available. The APTA on-board survey data
the travel behavior of diverse populations. One important (2007) similarly found that only 45 percent of transit riders
source of data was published in 2007 by the American Public had a vehicle available to them to make the trip for which
Transportation Association in its report A Profile of Public they chose transit. Residents of households without vehicles
Transportation Passenger Demographics and Travel Charac- use transit for 19.1 percent of trips, while the addition of even
teristics Reported in On-Board Surveys. That report compiled a single vehicle to a household drops transit use to 2.7 percent
information from questionnaires completed by over 496,000 of all trips. Many households “abandon public transportation
public transit riders sampled between 2000 and 2005 by as soon as they own their first car” (Pucher & Renne, 2003
transit systems that carry 60 percent of all transit trips. These at 57). Transit users are far less likely to own cars then other
data present the most complete picture to date of the demo- Americans—and those without cars are far more likely to
graphics and travel behavior of the people who use transit in use transit.
the United States (APTA, 2007). Another key source of data is
the 2001 National Household Travel Survey (NHTS)6, a U.S. People of color follow this pattern of owning fewer motor
Department of Transportation effort sponsored by the Bureau vehicles and using more transit. Blacks, Hispanics and Asians
of Transportation Statistics and the Federal Highway Admin- all rely more heavily on transit than whites, even after con-
istration to collect data on long-distance and local travel by trolling for income (Blumenberg et al., 2007). Blacks are
the American public. NHTS survey data are collected from almost six times as likely as whites to travel by public transit;
a sample of households and expanded to provide national Hispanics use transit less than blacks but still about three times
estimates of trips and miles by travel mode, trip purpose more than whites (Pucher & Renne, 2003). Other analyses
and a host of household attributes. The data allow analysis have similarly found that minorities are several times more
of daily travel by all modes, including characteristics of the likely to use public transit than whites (Lin & Long, 2008).
people traveling, their household and their vehicles. While The APTA data from on-board surveys (2007) found that the
the decennial Census and American Community Survey data majority of transit riders in America are non-white, as shown
include information only on commuting trips, which consti- in Figure 1.7. An analysis of the 2001 NHTS data found that
tute less than one-fifth of all trips, the NHTS provides more blacks and Hispanics comprise 54 percent of all transit users
comprehensive data on trips made for all purposes (Pucher (Pucher & Renne, 2003). Similarly, the 2006-2008 American
& Renne, 2003). Community Survey data indicates that, of all those who
report using public transportation to commute to work, only
40 percent are non-Hispanic whites.
5
Since nearly 60 percent of transit riders walk to transit (APTA, 2007), they are presumably coming from locations relatively close to the transit station.
6
Initial data from the 2009 version of the National Household Travel Survey (NHTS) was released in January 2010. Shortly afterwards, however, the Federal
Highway Administration announced that it would be releasing enhanced data later in 2010, in part due to conflicting data on transit utilization in the NHTS
as compared to the Federal Transit Administration’s National Transit Database. Given these concerns specifically about transit-related data, and the in-depth
analyses of the 2001 NHTS data already undertaken, this report relies on the 2001 rather than 2009 NHTS data. The web site for the 2001 and 2009 National
Household Travel Surveys and previous Nationwide Personal Transportation Surveys can be found at http://nhts.ornl.gov/index.shtml.
12 DUKAKIS CENTER FOR URBAN AND REGIONAL POLICYLike people of color, lower-income households are also more
Figure 1.7
likely to use transit, more likely to live near transit and less
Ethnicity of Transit Passengers
likely to own a car. While transit is used by Americans of all
Hispanic/Latino incomes, those from lower income and working-class house-
Asian/Pacific Islander Black/African holds use transit far more than upper income Americans. The
American
5.5% APTA transit passenger survey data (2007) found that the
14.3%
Other or majority of transit riders live in households with an annual
Multi-Ethnic
income of $50,000 or less, as shown in Figure 1.8. The median
6.6% 33.1%
income of transit passengers (in 2004 dollars) was $39,000,
about 12 percent lower than the U.S. median income at the
time the surveys were done between 2000 and 2005.
40.6% Lower-income households are also less likely to own a car. As
Pucher and Renne (2003 at 55) summarize in their analysis of
White/Caucasian
the 2001 NHTS data, “[i]ncome is the primary determinant
of auto ownership, which, in turn, is the main determinant of
Source: APTA, 2007 modal choice.” While automobile ownership has become near
universal in the United States among higher-income house-
People of color also concentrate in transit-rich neighbor-
holds, 26.5 percent of households with incomes less than
hoods. For example, CTOD has calculated that while blacks
$20,000 do not own a motor vehicle, a figure which drops to 5
were only 12 percent of the U.S. population and 14 percent
percent for households with incomes in the $20,000-$39,999
of the population in transit-served metro areas in 2000, they
range and even lower levels for higher-income groups. They
made up 23 percent of all residents living within one-half
note that “it is probably unique to the United States that three-
mile of transit stations in 2000. Similarly, Hispanics made up
fourths of even its poorest households own a car. This reflects
24 percent of all transit zone residents, even though they were
the extent to which the car has become a virtual necessity for
only 18 percent of residents throughout the transit-served
even the most basic transportation needs in most American
metropolitan areas and 13 percent of the U.S. population.
metropolitan areas” (Pucher and Renne, 2003 at 55).
Asians, representing 4 percent of U.S. residents, were 8 percent
of the residents of transit zones. As a result, whites were only
41 percent of transit zone residents even though they made Figure 1.8
up 69 percent of the U.S. population in 2000 (CTOD, 2006). Household Income of Transit Passengers
The traditional explanation for increased transit use and more than
concentration of people of color in TRNs is that they are $150,000 under $15,000
2.3%
disproportionately low income and low-income households
are more likely to use and live near transit. Giuliano (2000), 20.1%
$100,000– $15,000–
however, analyzed the 1995 NHTS data and rejected the con- $149,999 $24,999
clusion that racial/ethnic differences can be explained solely 7.2%
14.8
by income and other household characteristics. She found
$75,000– 9.0%
that different racial/ethnic groups exhibit “fundamental dif- $99,999
ferences in what motivates travel choices.” (Giuliano, 2000 at
130). Race and ethnicity, she concludes, play a significant and 15.8% 30.8%
complex role in travel behavior independent of income and
$50,000–
residential location characteristics. $74,999 $25,000–
$49,999
Source: APTA, 2007
Maintaining DIVERSITY in America’s Transit-Rich Neighborhoods 13holds, according to 2006-2008 American Community Survey
data, 58 percent of those who report that they commute
to work using public transportation are renters. A recent
Brookings analysis of this data found that two-thirds of transit
commuters in the principal cities of the 100 largest U.S. met-
ropolitan areas, as well as more than 40 percent of those living
in the suburban portions of those metros, are renters (Istrate,
Puentes & Tomer, 2010). Like members of low-income
households and people of color, renters are far less likely than
homeowners to own a car. The 2006-2008 American Community
Survey data indicates that while 95 percent of American
homeowners own one or more motor vehicles, nearly 20
percent of renter households own no motor vehicle.
Historically, these three demographic groups—people of
Historically, these three demographic groups— color, low-income households and renters—have been able to
people of color, low-income households and find housing in transit-rich neighborhoods. As a result, TRNs
renters—have been able to find housing in are more racially diverse, less wealthy and contain a higher
transit-rich neighborhoods. As a result, TRNs proportion of rental housing than other neighborhoods. But
are more racially diverse, less wealthy and current residents of both existing and new transit-rich neigh-
contain a higher proportion of rental housing borhoods find themselves increasingly concerned as growing
than other neighborhoods. numbers of Americans consider whether to take advantage
of the many benefits of living in transit-rich neighborhoods.
Demand for housing near transit is expected to far outstrip
Unfortunately, the need for low-income households to own supply over the next two decades (CTOD, 2007). Those groups
a vehicle imposes economic hardship on many of them. The who want to live near transit and benefit from proximity to
average American family spends 19 percent of its monthly transit stations may not be able to compete successfully for
budget on transportation, the second highest item after the limited supply of housing, especially affordable housing,
housing. Using transit can create substantial savings: living in transit-rich neighborhoods. If these TRN residents are
in location-efficient neighborhoods (with a good mix of uses displaced from their neighborhoods and replaced by higher-
and access to public transportation) can provide a 16 percent income, less diverse residents, the transit systems that rely on
cost savings compared to living in an automobile-dependent them may suffer as well.
exurban neighborhood (CTOD, 2007). A recent Brookings
Institution analysis similarly found that the working poor Transit and Diverse Neighborhoods
(those with incomes less than twice the federal poverty Need Each Other
threshold, with a median income of $20,280 in 2003) spent When evaluating how best to maximize future ridership of
8.4 percent of their income just on commuting to work, if both existing and new transit, planners sometimes distin-
they commuted by driving, compared to 5.8 percent if they guish between two types of transit riders: those who use
used public transit (Roberto, 2008). transit by necessity, sometimes disparagingly referred to as
A final important group when assessing transit ridership is captive riders, and those who could use a vehicle for their
renters. With a disproportionate amount of rental housing trip but nonetheless choose to use transit, often referred to
located in transit-served metros and transit-rich neighbor- as choice riders (Krizek & El-Geneidy, 2007). Such planners
hoods, it should come as no surprise that renters are dispro- often assume that the captive riders will remain transit users
portionately represented among transit riders. While only 29 indefinitely and therefore the key to increasing ridership is to
percent of all workers 16 years and older live in rental house- attract more choice riders.
14 DUKAKIS CENTER FOR URBAN AND REGIONAL POLICYYou can also read