Wellesley Housing Production Plan - Town of Wellesley September 24, 2018 Consultants: Mass.gov
←
→
Page content transcription
If your browser does not render page correctly, please read the page content below

Wellesley
   Housing
Production
      Plan

   Town of Wellesley
  September 24, 2018

        Consultants:

Wellesley Housing Production Plan 2018
                                            Table of Contents
INTRODUCTION .............................................................................................................................................. 1
       What has Wellesley done to create more affordable housing? ............................................................. 2
       What can this plan do for Wellesley? ....................................................................................................... 4
       Community engagement ........................................................................................................................... 5
       Data sources ............................................................................................................................................... 14
HOUSING NEEDS ASSESSMENT .............................................................................................................. 15
       Key findings............................................................................................................................................... 15
       Population characteristics ........................................................................................................................ 16
       Household characteristics ........................................................................................................................ 19
       Housing characteristics & trends ............................................................................................................ 22
       Housing affordability & housing needs ................................................................................................ 26
POTENTIAL BARRIERS TO AFFORDABLE HOUSING DEVELOPMENT ....................................... 31
       Key findings............................................................................................................................................... 31
       Environmental limitations ....................................................................................................................... 32
       Preservation priorities .............................................................................................................................. 36
       Iinfrastructure and public facilities ........................................................................................................ 36
       Regulatory framework ............................................................................................................................. 37
HOUSING GOALS .......................................................................................................................................... 41
       The challenge ............................................................................................................................................. 41
       Goal-setting process ................................................................................................................................. 41
HOUSING DEVELOPMENT STRATEGIES AND ACTION PLAN ..................................................... 45
       Overview .................................................................................................................................................... 45
       Required action plan elements ................................................................................................................ 46
       Important implementation tools ............................................................................................................. 52
APPENDIX......................................................................................................................................................... 57
       A. Glossary................................................................................................................................................. 57
       B. Resources for Affordable Housing Information, Education, and Community Engagement..... 65
       C. Safe Harbor Status through Housing Plan Certification ................................................................ 67
       D. Amherst Special Legislation: Tax Incentives for Affordable Housing ......................................... 69
       E. Wellesley Housing Development Corporation Special Act of the Legislature ............................ 71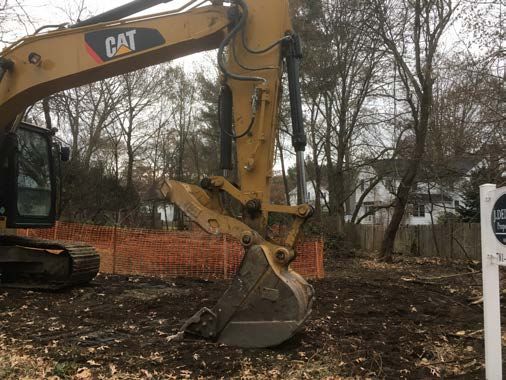
CHAPTER ONE

INTRODUCTION
In 2016, Wellesley embarked on a unique and comprehensive community planning process
to develop what is known as the Unified Plan. Serving both as an update of the 2007 Wellesley
Comprehensive Plan and a strategic plan for the Town, the Unified Plan is a plan for
Wellesley’s physical evolution and economic well-being and a vision to cohere local
government decision-making. The process to develop the Unified Plan came at the heels of a
contentious, difficult, and polarizing process that called upon Wellesley voters to decide
whether to change their form of government to a modern, more centralized town manager
framework, an effort that was not successful. In many ways, residual tension from defeat of
the town manager proposal persists today.

Against the backdrop of deep divisions about considerations related to how the Town would
operate in the future, Wellesley suddenly found itself with plans for several Chapter 40B
developments all within a matter of weeks. What would have been hard for a peaceful town
to manage became very challenging for Wellesley officials, staff, and residents. Today, the
Zoning Board of Appeals is considering five comprehensive permit applications with a
combined total of 228 mixed-income housing units. There are more projects that have either
received Project Eligibility (PE) determinations or are anticipated to receive them soon. While
difficult, the town government process made it apparent that Wellesley residents prefer a
form of government that approaches problems collaboratively, based on consensus. It is in
this vein that the Board of Selectmen, Planning Board, and Housing Development
Corporation set out to develop this Housing Production Plan with broad participation, input,
and support.

Housing in Wellesley is coveted real estate. The monthly rents for homes and apartments in
Wellesley exceed what landlords charge in most of Greater Boston, except perhaps in
Downtown Boston or the Seaport District. Norfolk County ranks forty-second out of the top
100 wealthy counties in the country, and Middlesex County is not far behind. Throughout the
Boston Metro area, the housing wage necessary to afford a modest two-bedroom apartment
is $33.46 per hour. 1 That may seem manageable to many Wellesley residents, but it represents
far more than the earnings of employees in Wellesley’s retail, food service, or health care
establishments. It is little wonder that 65 percent of the people who work in Wellesley each
day commute from some other town. 2

1 National Low-Income Housing Coalition, Out of Reach 2018, 119.
2 U.S. Census Bureau, Commuting (Journey to Work), 2009-2013 5-Year American Community Survey Commuting Flows
(2013).
2 / Wellesley Housing Production Plan 2018

What has Wellesley done to create more affordable housing?
Despite Wellesley’s exceptionally high housing costs, the limited inventory of affordable units
in Wellesley is not because the town has ignored its obligations to provide affordable housing.
The opposite is true. Of the 575 units on the Chapter 40B Subsidized Housing Inventory (SHI)
today, most have come about because of efforts by the Wellesley Housing Authority,
Wellesley Housing Development Corporation (WHDC), Town boards and commissions, and
Town staff. The WHDC’s very existence owes to a home rule petition filed with the General
Court in 1998. 3 Wellesley has taken many steps to address affordable housing, including the
following:

•   1998: The Town of Wellesley submitted a home rule petition to the General Court to
    establish the WHDC.

•   2004: The Community Preservation
    Committee provided $65,000, in                       Of the 575 units on the Chapter 40B Subsidized
    addition to HUD funds, to create a                   Housing Inventory (SHI) today, most have come
    group home for people with
                                                         about because of efforts by the Wellesley Housing
    disabilities at 4 Marshall Road.
                                                         Authority, Wellesley Housing Development
•   2004: Town Meeting adopted an                        Corporation (WHDC), Town boards and
    Inclusionary Zoning Bylaw (IZB),                     commissions, and Town staff
    requiring residential projects in
    commercial districts to provide 20
    percent affordable housing, and
    commercial projects over 10,000 square feet to provide 2 percent affordable housing (1
    unit for every 50,000 square feet constructed).

•   2005: Town Meeting amended the IZB to apply to subdivisions with more than five new
    lots, thereby making new subdivisions include 20 percent affordable housing.

•   2007-2008: Permitting began for projects at 978 Worcester Street and the former Wellesley
    Inn site at 576 Washington Street in Wellesley Square. Though delayed by the recession,
    these projects have been completed, resulting in seven SHI-eligible units at 978 Worcester
    and five SHI-eligible units at 576 Washington Street. Both projects were developed under
    the Town’s IZB bylaw. The 978 Worcester St. project also provided a payment in-lieu for
    one unit.

•   2007: The Linden Square project was completed, including seven affordable housing units
    created under the IZB. (The Town recently discovered that these units are not listed on
    the SHI. They are being added at this time.)

•   2007: Town Meeting amended the definition of Floor Area Ratio in the Zoning Bylaw to
    exempt affordable units created under the IZB from the maximum FAR. This change

3Secretary of the Commonwealth, Acts and Resolves by the General Court. Chapter 311 of the Acts of 1998: An Act
Establishing the Wellesley Housing Development Corporation.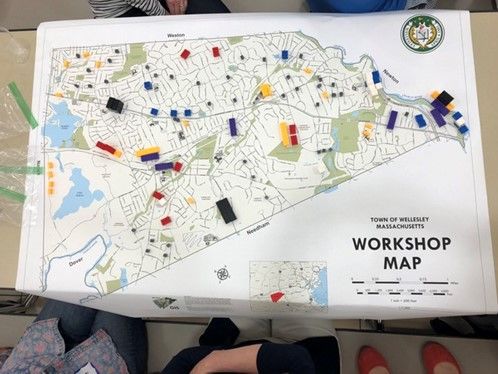
Introduction / 3
provides for the necessary increase in density to produce affordable housing in
commercial districts.
• 2007: Wellesley adopted an award-winning Comprehensive Plan in 2007 with numerous
recommended actions for affordable housing.
• 2009: Permitting for the CVS resulted in a payment of in-lieu under the IZB.
• 2011: The ZBA approved a comprehensive permit for Wellesley Commons at 65-71
Washington Street, resulting in one new SHI-eligible homeownership unit.
• 2012: The Town approved
Waterstone at Wellesley, 27
Washington Street, under the
Residential Incentive Overlay
(RIO) district in Wellesley
Lower Falls. This project created
82 independent living units for
seniors, all listed on the SHI. It
also includes seven affordable
assisted living units not listed on the SHI because of DHCD policies, but they are
permanently deed restricted to be affordable.
• 2012: The Wellesley Housing Development Corporation purchased and renovated a two-
family dwelling at Peck Ave and a single-family dwelling at 6 Mellon Road, creating three
affordable units. At the same time, the Town also purchased 9 Highland Road for
affordable housing. It is omitted from the SHI because the deed restriction does not meet
DHCD requirements. This problem will be cured when the unit is resold.
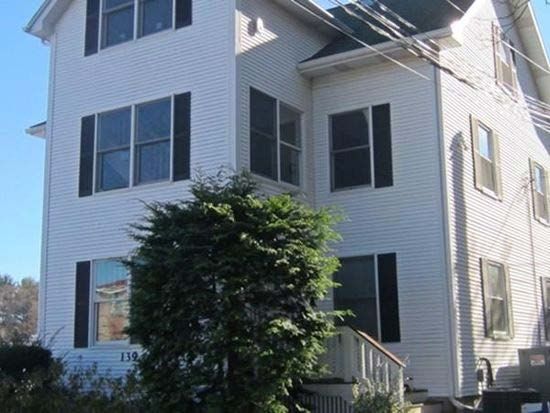
• 2013/2014: The ZBA approved a comprehensive
permit for 139 Linden Street, which added two
units to the SHI.
• 2013: Town Meeting amended the Wellesley
Square Zoning District to create a special
permit to provide for density. This action
benefited and allowed the previously stalled
Wellesley Inn project to proceed.
• 2016: The Planning Board approved a definitive
subdivision plan for 135 Great Plain Ave. that
included a payment in-lieu for 2.4 units. (This site is now the subject of a 44-unit
comprehensive permit application.)
• 2016: The Town began work on the first Unified Plan in the Commonwealth. This
planning process brings together the Town’s strategic plan and comprehensive plan. The
Board of Selectmen and Planning Board are expected to adopt the final plan in 2018. It
includes a housing strategy with a variety of mechanisms to increase housing type and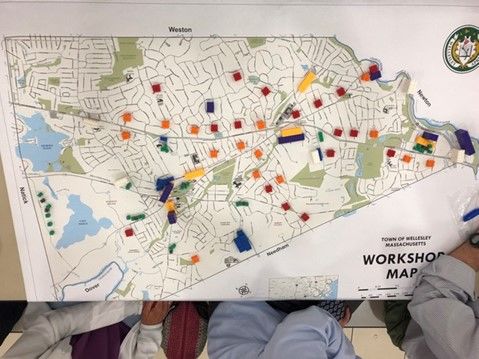
4 / Wellesley Housing Production Plan 2018

    affordability. Several of the strategies in the Unified Plan have been incorporated in
    Section 5 of this Housing Production Plan.

•   2018: Actions by the Town:

    ○    March 2018: The Board of Selectmen released a Request for Proposals (RFP) to develop
         the Tailby and Railroad Parking Lots near the Wellesley Square MBTA station for
         affordable housing and parking.

    ○    March 2018: The Planning Board sought FY19 funds to develop a sub-area study and
         plan to support the development of additional affordable housing. (CPA funds were
         also requested for this project.)

    ○    April 2018: With the Community Preservation Committee’s recommendation, Town
         Meeting approved $200,000 to the Wellesley Housing Authority to study the
         redevelopment potential of the Barton Road public housing property.

    ○    May 2018: The Board of Selectmen and WHDC purchased two additional rental units
         at 978 Worcester Street, bringing the affordability percentage to 25 percent and adding
         the total 36-unit development to the Town’s SHI, a net increase of 29 units.

    ○    June 2018, John Hancock announced plans to redevelop the Wellesley Office Park and
         wants to partner with the Town to construct 350 rental housing units.

While Wellesley has taken steps to create affordable housing, the needs, constraints and
challenges that existed when Wellesley completed the Comprehensive Plan in 2007 remain
true today. The description of Wellesley in 2018 is not much different than it was eleven years
ago.

What can this plan do for Wellesley?
The main purpose of this HPP is to help
Wellesley implement the new Unified Plan
and make steady progress toward meeting
and exceeding the 10 percent statutory
minimum. In doing so, the HPP creates an
opportunity to:

•   Assess demographic and housing data;

•   Identify local housing needs;

•   Recognize a community’s ongoing efforts;

•   Identify housing development barriers;

•   Educate the public about Wellesley’s need for more affordable housing and a wider
    variety of housing types;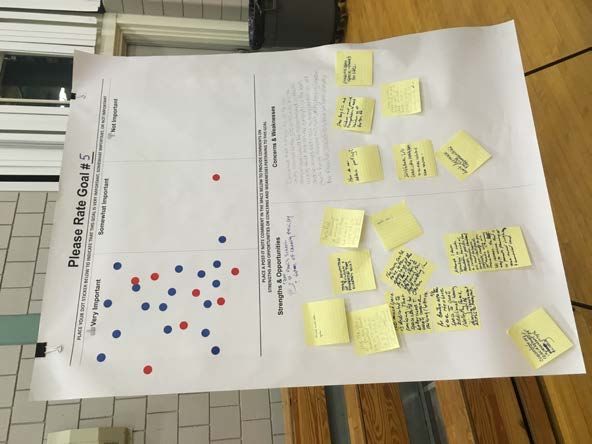
Introduction / 5

        •   Identify specific locations and sites that would be appropriate for affordable and mixed-
            income housing development; and

        •   Guide future mixed-income housing development to these optimal sites and locations.

          With a DHCD approved HPP in place, Wellesley may be able to manage the flow of new
          Chapter 40B proposals. However, the HPP will be effective for this purpose only if the Town
          implements it. Implementation of this plan and the new Unified Plan will be critical for
          Wellesley if a comprehensive permit were denied based on conflicts with local plans. Two
          recent Housing Appeals Committee (HAC) cases lay out the issues and requirements
          associated with planning for affordable housing. Excerpts from these decisions, shown on the
                                                        next page, could assist present and future
If the Town wants to direct higher-density housing readers to understand what the Town needs to
to locations other than established neighborhoods, it do to help the Board of Appeals if an
needs to carry out strategies that will be effective objectionable comprehensive permit is denied
toward that end. It also needs to work on ways to in the near future. These excerpts speak to the
introduce modestly scaled affordable units in the vital importance of consistent plan
established neighborhoods.                              implementation. In short, having a plan is not
                                                        enough; plan implementation is essential.

        It is very unlikely that Wellesley’s desire to protect the character of its single-family
        neighborhoods would rise to the level of a local planning concern that outweighs the regional
        need for affordable housing. If the Town wants to direct higher-density housing to locations
        other than established neighborhoods, it needs to carry out strategies that will be effective
        toward that end. It also needs to work on ways to introduce modestly scaled affordable units
        in the established neighborhoods. Doing so will create a track record that illustrates how
        Wellesley has both protected the single-family neighborhoods and provided affordable
        housing choices within them.

        Community engagement
        As part of the HPP process, the Town sought public involvement to include a variety of
        opinions on the production and retention of affordable housing in Wellesley. Public
        workshops were designed to be interactive, encouraging residents to talk and collaborate in
        some “hands-on” activities and to help the consultants understand the Town. Input provided
        by participants in these workshops has been used to direct the plan in several key ways.
        Wellesley’s HPP has benefited from thoughtful input from the participants in three
        community workshops – April 7, May 3, and June 12, 2018 - and guidance from
        representatives of the Board of Selectmen, Planning Board, and Wellesley Housing
        Development Corporation. The consulting team also interviewed residents and others with
        knowledge of the housing situation in Wellesley.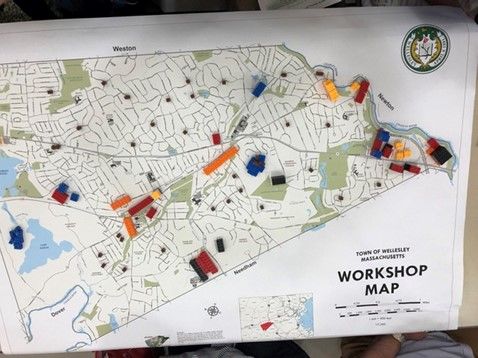
6 / Wellesley Housing Production Plan 2018

COMMUNITY MEETING #1: APRIL 7, 2018
The first of three community-wide meetings for the Wellesley Housing Production Plan
(HPP) took place on Saturday, April 7, at 9:30. Approximately 45 people attended, including
two who did not sign the attendance sheet.

The meeting included informal small-group discussion time during registration, a
presentation by the consultants, and an hour-long discussion period designed to elicit ideas
about two topics: the ideal vision of housing in Wellesley, and an assessment of opportunities
for and barriers to achieving the vision. Each table had a volunteer from the HPP working
group whose job was to facilitate and record the group’s discussion (about five to seven
participants per table and a total of seven tables). At the end of the one-hour discussion
period, each facilitator summarized what group members had said. The following
summarizes key ideas and concerns that emerged during the first community meeting.

•   Housing Vision for Wellesley

    ○    Protect the character of
         established neighborhoods

    ○    Strategically          locate
         affordable housing near
         public transportation, goods
         and services, and schools,
         and in walkable locations

    ○    Site more densely developed
         housing in and near the
         business    districts,   e.g.,
         mixed-use buildings or
         multifamily         buildings
         adjacent   to    commercial
         buildings

    ○    Geographically distribute affordable housing throughout the town so that no
         neighborhood is overburdened

    ○    Allow more housing choices in established neighborhoods, such as the ability to
         convert existing single-family homes to two-family or small multi-family dwellings

    ○    Develop Town-owned property, e.g., the North 40 parcel or the Tailby Lot as a
         preferred way to create more housing

    ○    Provide for additional development, infill, or reuse of existing properties in office park
         settings, e.g., Harvard Pilgrim or Sun Life, or the public housing on Barton Road
         (Wellesley Housing Authority)

    ○    Remove the value of land from the cost of housing: consider a community land trust
         approach
Introduction / 7
• Housing Opportunities
○ Pursue development of Town-owned property, e.g., North 40, Tailby Lot, Wellesley
Middle School, Morton Circle
○ Create more housing for employees at major institutions, e.g., Babson, Wellesley,
Dana Hall, Tenacre
○ Develop housing on surplus land at MassBay Community College or the Sisters of
Charity/Seton Residence
○ Allow accessory dwelling units and “age friendly” multifamily use of existing
residences
○ Identify redevelopment possibilities along Worcester Street/Route 9
○ Zone for more diverse housing with overlay districts or reducing regulatory barriers,
e.g., multifamily conversions
○ Preserve existing small homes
• Housing Barriers or Constraints
○ Conservation restrictions limit the amount of Town-owned land that can be developed
for housing
○ Tension between the desire to avoid, isolated large developments, preserve the
character of existing single-family neighborhoods, and accommodate 400+ additional
Chapter 40B units into those neighborhoods without scale and density
○ The Town’s zoning substantially restricts what developers can do: use regulations,
maximum density, maximum height, parking
○ Wellesley’s high income/high household wealth profile, prestige, very high land
values, and the economics of teardowns contribute to loss of smaller, relatively
affordable homes
○ Lack of opportunities for seniors to downsize interferes with “natural” turnover in
housing stock and forces them to sell to a developer or let the house fall into disrepair
because they cannot maintain it
○ Lack of funding for affordable housing
○ Lack of public awareness or understanding of Chapter 40B and affordable housing
needs
○ Perceptions of affordable housing
○ Lack of public consensus and public commitment to housing8 / Wellesley Housing Production Plan 2018
○ Traffic, parking, limited in-town public transportation all contribute to mobility
constraints
COMMUNITY MEETING #2: MAY 3, 2018
The second of three community-wide meetings
for the Wellesley Housing Production Plan
(HPP) took place on Thursday, May 3, at 7 PM.
Approximately 30 people attended the meeting.
The purpose of the meeting was to get
community feedback on a set of goals for the
HPP. It included a presentation by the
consultants, followed by an open house-style
activity designed to inform participants of the
purpose of each goal and gather public opinion
on the importance of incorporating the goal into
the HPP. The results from this exercise and
additional feedback from participants are
summarized below.
• Main Conclusions
○ Participants feel strongly that Wellesley
should strive to reach the affordable
housing goal of 10 percent to maintain
local control.
○ Many participants were in favor of at least slightly increased density, more housing
choice, and increased racial and socio-economic diversity.
○ The most major concerns were increased traffic with the increase in density, the lack
of public transportation access that some new developments might face, and the
potential change in the character of Wellesley with new housing development.
○ Participants favored creating more housing through redevelopment of existing
buildings, as long as those units allowed for residents to be a part of the community
and have access to town services and resources.
• Comments on Draft Housing goals
Goal 1: Create a variety of affordable and mixed-income housing that helps to make
Wellesley a welcoming community for people with diverse socio-economic
backgrounds.
Twenty-two participants marked this goal as “very important”, and three marked it as
“somewhat important”. Many commenters saw the benefits of having a more diverse
community, and some asked how to best educate the public on these benefits. Some
suggested developing support systems for the socio-economically diverse population and toIntroduction / 9 promote diverse businesses to help integrate the community. Several comments mentioned MassBay as an opportunity to meet this goal. Others expressed concerns about neighborhood resistance to any housing other than single-family and they worried about how to meet this goal. Goal 2: Provide more housing options, including affordable and market-rate housing options, for low- and middle-income families, seniors, and individuals with disabilities, through a variety of mechanisms to increase housing choice. Twenty-one people marked this goal “very important”, and four marked it “somewhat important”. Some strengths of this goal were that it would enable people who work in town (i.e. teachers, police officers) to live in town, it would diversify talents and skills sets in town, and it would offer more opportunities for intergenerational interaction by helping young families and elderly residents. Some participants noted opportunities, including promoting smaller projects in residential neighborhoods, creating higher density zoning on upper floors in commercial business districts, and creating cluster developments on larger parcels. Some concerns regarding this goal were that the increase in density would increase traffic and have the potential to change the character of the town, and that while the focus on low- and middle-income families is important, families with 80-120 percent AMI also need affordable housing in Wellesley. Goal 3: Actively strive to incrementally achieve state’s MGL c.40B 10% goal for affordable housing by producing at least 45 units annually that count on the state’s subsidized housing inventory, through local actions and approval of private development, especially development of rental housing units. Create at least 400 housing units that are permanently affordable to income-eligible households by 2028. Twenty-three people marked this goal as “very important”, three people marked it as “somewhat important”, and one person marked it as “not important”. Most commenters emphasized the importance of Wellesley being able to control its own destiny by striving not just for safe harbor but for the full 10 percent. Some commenters felt that this goal could help to meet other goals, but others expressed concern that if meeting this goal is not done in a thoughtful way, other goals, such as housing choice and diversity, could be at risk. Goal 4: Encourage new development and repurposing of existing buildings to create affordable and mixed income housing that: (a) reinforces the development patterns of Wellesley’s residential neighborhoods and maintains a predominantly single-family character in established single-family neighborhoods; (b) strengthens the vitality of business districts and commercial corridors with diverse housing types; and (c) promotes housing development in walkable areas with convenient access to shops, services, public transportation, parks, schools, and other neighborhood destinations. Every participant rated this goal as “very important” (25 people). Participants emphasized the repurposing of existing buildings to be an important aspect of the goal, and they stated that walkability and access to public transportation and town services is essential when considering placement of affordable housing. Some opportunities discussed were selling
10 / Wellesley Housing Production Plan 2018

and developing St. Paul’s school building and the Sisters of Charity property or creating
more mixed-use housing in Wellesley Square. Concerns residents had were the availability
of parking and whether development that is not necessarily walkable but has easy access to
highways should also be prioritized. One comment suggested that this type of development
might not be good for the community aspect of residents living there.

Goal 5: Promote the development of surplus institutional and town-owned land as well
as the redevelopment of office parks and existing affordable housing complexes to
create desirable mixed-income and mixed-use neighborhoods, where feasible.

Twenty-three participants rated this goal as “very important”, and two rated it as
“somewhat important”. Commenters mostly wanted to focus on redevelopment rather than
new development to preserve as much open space as possible. They emphasized that it was
important for these developments, whether they were new or redevelopments, to be close to
services and able to connect to town life. One concern was regarding the potential decrease
in parking in town. Another commenter was enthusiastic about redevelopment but
acknowledged that a large amount of development projects would have to take place to
realistically maintain SHI growth.

•   Strategies

A final station asked participants what their ideas were for addressing housing needs in
Wellesley, and what they think should be further explored in the planning process. Here are
some of the responses.

    ○    Talk to people who live in affordable housing

    ○    Share what other towns are doing across the country

    ○    Improve access to public transportation

    ○    More community education about the benefits of a diverse community to children and
         families

    ○    More accessory apartments in limited areas

    ○    Change zoning to create slightly denser development

    ○    Engage the neighborhoods to consider how to welcome new residents before they
         come, to be welcoming and integrate into the community.

    ○    Local incentives to support affordable housing

    ○    Mixed-use properties in places such as Wellesley Square

    ○    Mass Bay rental units to allow students to live nearby; could also support Mass Bay
         faculty and staff
Introduction / 11
COMMUNITY MEETING #3: JUNE 12, 2018
The final community meeting occurred on June 12, 2018. Approximately 40 people attended
the meeting, including members of the Board of Selectmen, Planning Board, and WHDC. The
meeting’s purpose was to solicit opinions from community members on transformation areas
in Wellesley and what types of development would be suitable for the town. Consultants
presented information about housing needs in Wellesley, participants gave comments and
suggestions in an open house exercise, and a final group exercise allowed participants to
discuss with one another and choose what types of housing would be suitable in which areas
of town.
• Main Conclusions
○ Participants are open to increased density if it is done wisely and tastefully.
○ A main priority of housing development is to meet the 10 percent goal for affordable
housing, and community members want this to be the focus for any new development.
○ Key transformation areas that participants were generally in favor of included
Wellesley Square, North 40, and sites in the east part of town.
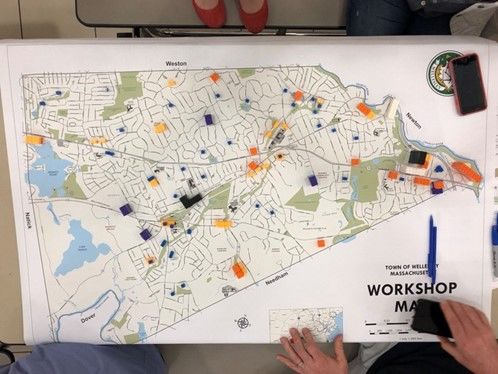
• Open House Stations
Where are Wellesley’s key transformation areas? Where is change most likely to occur
in Wellesley? Where could change accommodate multifamily housing? Mixed-use
developments?
The first station presented a map of Wellesley showing potential development sites and asked
participants to leave comments answering the question above and responding to the
suggested sites on the map. Participants left check marks by each development site, shown in
the image below. The most popular sites were North 40, with ten check marks and two X
marks, Office Park with 12 check marks, and Wellesley Square & Neighborhoods, with 14 check
marks and one X mark. The area in the east part of town on the Newton line, which includes
the office park, the National Guard Site, and WHA Barton Rd, received a good deal of support
on the map, though one commenter noted that there are already many projects there that are
affecting traffic, and suggested more projects in areas where there is less density.
Some key transformation areas that participants noted were Barton Road, Wellesley Square,
North 40, and areas that had access to public transportation. These areas would be suitable
for mixed-use or multifamily development. However, there were participants who disagreed
that any of those would be good options, citing congestion and 40B projects that are already
in the area. One area that a couple of commenters did not think was a good location for
development was the Linden Street neighborhood, as there is already traffic congestion in the
area and it is not ideal for access to public transportation.
What is the ONE most important step Wellesley should take to work toward or reach the 10
percent affordable housing goal under Chapter 40B?12 / Wellesley Housing Production Plan 2018
Responses shared by participants included the following:
○ Zoning for multifamily
○ Make a dent in the SHI gap by approving development that will count completely
towards the affordable housing goal
○ Repurpose currently developed areas for more housing
○ Pursue affordable elderly and disabled housing
○ Create mixed-income housing areas
○ Public housing in areas that are central to public transportation, have access to
shopping areas, and encourage walkability
○ Ensure that housing units complement rather than overwhelm the existing
neighborhood (in terms of density and design)
GROUP EXERCISE
Following the open house, participants returned to their tables to partake in a group exercise.
Each group had sets of Lego bricks in different sizes, where each size pertained to a different
housing type: single-family, duplex, three- or four-unit building, larger multi-family, etc. The
consultants asked participants to use all the Legos on a large map of Wellesley, placing them
in areas where they believe development of that type of housing would be suitable.
Group A Group B
As shown above on the left, Group A concentrated some larger developments (black and
orange Legos) in the Barton Road area and the Office Park. There is also high density in the
Wellesley Square area. They chose to scatter some smaller units (blue and yellow) across
town. Group B (above right) chose similar areas for their large developments but added a
large building near the Needham town line and another just north of Route 9, near the Hardy
School.Introduction / 13 Group C (left, below) concentrated density (red, black, and orange blocks) in a few areas: on the Needham line near Babson College, in Wellesley Square, in the Lower Falls vicinity of Walnut Street, and in the east part of town where Barton Road and the office park are. They combined some of the smaller two- to four-family units to create multi-family, and they scattered single-family houses evenly across town. Group D (right, next page), while keeping density in Wellesley Square and the eastern part of town, scattered their two- to four-family units (red and orange blocks) along the main streets of town. One unique choice this group made was to add some single-family units on the western side of Lake Waban. Group C Group D Group E (below, left) stacked some of their larger development blocks (green, red, and black blocks) and clustered some of their smaller development blocks to create high density in less space. Many of their proposed developments are along main roads in Wellesley and include the Fells Road area, the Wellesley Hills T station area, and the eastern part of town. Lastly, Group F (right) clustered their developments more so than any other group. They chose to stack multi-family blocks in the Wellesley Square area and added more units in the MassBay Community College/Sisters of Charity area than the other groups. The group clustered some smaller units in the North 40 area as well. Group E Group F
14 / Wellesley Housing Production Plan 2018

Data sources
Information for the Wellesley HPP comes from a variety of sources, including the Town,
previous plans and studies, the Metropolitan Area Planning Council (MAPC), state agencies,
proprietary data, the U.S. Department of Housing and Urban Development, and Bureau of
the Census. The most frequently used sources of data are as follows:

•   The Census of Population and Housing (decennial census): mainly Census 2010, though
    some tables from Census 2000 were relied upon as well.

•   The American Community Survey (ACS): Th ACS provides demographic and housing
    estimates for large and small geographic areas every year. Although the estimates are
    based on a small population sample, a new survey is collected each month, and the results
    are aggregated to provide a similar, “rolling” dataset on a wide variety of topics. In most
    cases, data labeled “ACS” in this plan are taken from the most recent five-year tabulation:
    2011-2016 inclusive. Note: population and household estimates from the ACS may not
    align as well as one would like with local census data collected by the Town. However, to
    allow for a consistent basis of comparison between Wellesley and other communities, this
    HPP relies on ACS estimates.

•   HUD Consolidated Planning/Comprehensive Housing Affordability Strategy (CHAS) Data.
    Created through a combined effort of the U.S. Department of Housing and Urban
    Development (HUD) and the Census Bureau, this dataset is a “special tabulation” of ACS
    According to the HUD guidance, “these special tabulation data provide counts of the
    numbers of households that fit certain combinations of HUD-specified criteria such as
    housing needs, HUD-defined income limits (primarily 30, 50, and 80 percent of median
    income) and household types of particular interest to planners and policy-makers.” The
    most recent CHAS Data are based on the ACS 2008-2012 estimates.

•   Wellesley GIS: The Town’s Geographic Information System (GIS) provided numerous GIS
    databases for use in this plan. The databases were used to map existing land uses, recent
    housing sales, recent single-family teardown/rebuild projects, zoning, infrastructure,
    natural resources, and other factors.

•   The Warren Group/Real Estate Records Search: The consulting team tapped the Warren
    Group’s extensive real estate transaction databases to sample sales volume and sale prices
    in various parts of Wellesley.

•   UMass Amherst/Donohue Institute: This source was relied upon for population projections
    and trends, and building permit trends.

Many other publications were also reviewed during the development of this plan as well.
Extensive and invaluable guidance was received throughout from the Wellesley Planning
Department.
CHAPTER TWO
HOUSING NEEDS ASSESSMENT
Key findings
• Wellesley is a town of homeowners. Over 82 percent of Wellesley households own their
residence.
• Out of 7,111 homeowners, 6,699 – or 94 percent – live in detached single-family dwellings.
• Wellesley has the third highest median household income in Massachusetts.
• Wellesley has very little racial, ethnic, or class diversity. Black or African Americans make
up a much smaller percentage of the total population in Wellesley than in the Boston
Metro area as a whole. Moreover, federal census data indicate that over half of all blacks
counted as part of Wellesley’s total population are students and faculty at Wellesley and
Babson.
• In 2017, Wellesley ranked tenth in the Boston Metro area for total number of housing sales.
Since 2010, some 2,600 homes have sold in Wellesley.
• According to the Town’s recently
completed Unified Plan, the total
number of housing units in Wellesley
rose by just 218 units between 2000
and 2017. In 2017, the median single-
family sale price in Wellesley was $1.3
million.
• Wellesley is redeveloping. Most new
housing construction in Wellesley
occurs due to teardowns. Since 2009,
the Wellesley building department
has issued 575 residential demolition
permits. Redevelopment of older
housing stock brings higher asset value to the community, but in most cases, it does not
produce a net increase in housing units.16 / Wellesley Housing Production Plan 2018
Population characteristics
Wellesley and the surrounding communities have absorbed modest population growth over
the past few decades. Echoing Greater Boston trends, Wellesley’s population growth rate
accelerated with the “Baby Boom,” only to reverse with a slight population decline from 1970-
1990 as household sizes fell throughout the U.S. Since 1990, however, Wellesley has been
gaining residents again, narrowly outpacing the rate of growth in Norfolk County. Today, the
Census Bureau estimates Wellesley’s total population at 29,215. 4 Citing projections from the
Metropolitan Area Planning Council (MAPC) and the University of Massachusetts Donohue
Institute, Wellesley’s Unified Plan anticipates another cycle of population decreases through
2035, yet at the same time, modest growth in total households. 5 This is generally consistent
with conditions throughout Boston’s west suburbs, where household formation rates
continue to rise while household sizes drop.
POPULATION AGE
Wellesley’s population age characteristics come as no surprise. Like virtually all communities
in the Northeast, Wellesley has a “graying” population and a shrinking supply of younger
adults. And, while available population projections point to a gradual decline in dependent
children as well, Wellesley has a large share of people under 19 years compared with other
Boston suburbs. Its prestigious school district has an undeniable impact on the homebuying
choices made by wealthy families in the Greater Boston area. According to the Census Bureau,
over half of all families in Wellesley (and 43 percent of all households) have children under
18. 6 The size of the under-19 and over-65 population combined produces a staggering age
dependency ratio of 0.93. These are not ordinary statistics.
RACE, ETHNICITY, CULTURE, AND Table 2-1. Population by Race
GEOGRAPHIC MOBILITY Race Wellesley Boston Metro
Wellesley has limited racial and ethnic White 82.5%
77.3%
diversity. Minorities comprise about 17 Black 2.4%
8.0%
percent of the town’s total population American Indian or 0.1%
0.2%
(see Table 2.1), with Asians making up a Alaskan Native
larger percentage than all other racial Asian 11.0%
7.3%
groups combined and half of all foreign- Native Hawaiian or Other 0.1%
0.0%
born residents as well. The Latino Pacific Islander
community, which is primarily white, Other Race (Unspecified) 0.9%
4.1%
represents less than 5 percent of the total 2+ Races 3.0%
3.1%
population. By contrast, the black or
7 Source: ACS 2012-2016, B03002.
African American population in
Wellesley is quite small – under 3 percent of the total – a fact not lost on many of the town’s
affordable housing organizations and supporters. During an interview for this housing plan,
4 U.S. Census Bureau, American Community Survey (ACS) Five-Year Estimates, 2012-2016, B01003. “Total population”
includes people in group quarters, e.g., college dormitories.
5 Wellesley Unified Plan (Draft), “Understanding Wellesley Today,” 8.
6 ACS 2012-2016, B11003, and Barrett Planning Group.
7 ACS 2012-2016, B03002, and Barrett Planning Group.HOUSING NEEDS ASSESSMENT / 17
one commenter said she often wonders what residents mean when they say they want to
maintain Wellesley as a town that welcomes diversity. Faculty and students at Wellesley
College and Babson College represent over 50 percent of the town’s entire black population. 8
The unusually small percentage of blacks in Wellesley matters because throughout the Boston
Metro area and nationally, the largest racial and ethnic disparities in wealth occur among
blacks born in the U.S. and Latino blacks. 9 Achieving housing equity for very low-income
households can be very challenging in an affluent suburb because the gap between what they
can afford and prevailing market values invariably requires deep subsidies.
EDUCATION
Wellesley residents are extraordinarily well educated, and so are their counterparts in the
surrounding towns. Educational attainment is one of several measures that separates Greater
Boston suburbs from the rest of the state and even more from the rest of the nation. Over 80
percent of Wellesley adults 25 years and over hold at least a bachelor’s degree and over 50
percent hold a graduate or professional degree. Wellesley residents value and benefit from
living in a region with many colleges and universities in addition to those within their own
town.
EDUCATIONAL ATTAINMENT
Adults 25 Years and Over with Bachelor's Degree or Higher
(Source: ACS 2011-2016, B15003)
Dover 100.0%
Weston
Percent Population 25 and Over
WELLESLEY 80.0%
Wayland
Sherborn 60.0%
Newton
Needham 40.0%
Natick
Greater Boston 20.0%
Massachusetts
United States 0.0%
Geography
LABOR FORCE AND EMPLOYMENT
A community’s labor force includes all civilian residents 16 years and over with a job or in
the market for one. Wellesley’s labor force includes approximately 13,000 people, 95 percent
of whom are employed. The town is fortunate to have some large institutions and other
private employers because they offer desirable employment for highly skilled and highly
educated workers. As a result, Wellesley has a large percentage of residents 16 years and over
working locally – about 35 percent (4,246 people) – and many residents who walk or bike to
8ACS 2012-2016, B02001 (calculated by census block group), and Barrett Planning Group.
9Tatjana Meschede, et al. Wealth Inequalities in Greater Boston: Do Race and Ethnicity Matter? CDP 2016-02. (Federal Reserve
Bank of Boston, 2016).18 / Wellesley Housing Production Plan 2018
work – about 12 percent. 10 The town also has a sizeable group of telecommuters and self-
employed people working at home, which is not uncommon in affluent communities.
Consistent with the town’s educational profile, Wellesley residents tend to work in fields
requiring advanced degrees and in high-wage occupations. Higher education, health care,
science and technology, professional services, finance, and management dominate the list of
industries that employ Wellesley residents. 11 On average, Wellesley men with full-time
employment earn $153,836 per year, which is very high for the Greater Boston region overall
but consistent with other west suburbs. Still, the gender pay gap persists in Wellesley and so
many affluent towns, with men earning almost 1.7 times the annual salaries of women – a
ratio dramatically higher than that of Greater Boston as a whole.12 Without substantial child
GENDER PAY GAP:
Wellesley & Region
(Source: ACS 2011-2016)
$200,000 2.50
$180,000
Mean Annual Earnings
$160,000 2.00
$140,000
$120,000 1.50
$100,000
$80,000 1.00
$60,000
$40,000 0.50
$20,000
$0 0.00
Weston Dover Sherborn Wellesley Wayland Needham Newton Natick Greater
Boston
Geography
support, a single woman with children and a full-time job would find it very difficult to live
in Wellesley. As illustrated later in this chapter, it can even be harder for single women
without children, especially older women.
THE JOBS-HOUSING (IM)BALANCE
The Executive Office of Labor and Workforce Development (EOLWD) reports that Wellesley
has about 1,500 employer establishments with a combined total of 18,000 average monthly
payroll jobs and an average weekly wage of $1,576. 13 The employment base (payroll jobs) is
much larger than Wellesley’s total housing inventory, currently estimated at 9,023 year-round
units. The sustainability goal for a local economy is 1.0-1.5 jobs per housing unit: enough jobs
to give residents meaningful opportunities to work locally and enough housing units to give
local workers meaningful options to live in the town. The jobs-to-housing ratio in Wellesley is
10 ACS 2012-2016, B08301, and Barrett Planning Group.
11 ACS 2011-2016. C24050, and Wellesley Unified Plan (Draft), Chapter 9 (2018), 3.
12 ACS 2011-2016, DP-03.
13 EOLWD, ES-202, Town of Wellesley, 2016 Annual Report, All NAISC Codes.HOUSING NEEDS ASSESSMENT / 19
1.99, which means there are nearly two jobs for every one housing unit, i.e., potential demand
that substantially exceeds the supply.
The jobs-to-housing ratio in Wellesley may be skewed slightly by the presence of college
campuses with some of their workforce housed on site. For example, Wellesley College owns
approximately 60 homes that serve as faculty housing. However, even with a reasonable
estimate of the on-campus live/work population, the difference is not large enough to have a
material impact on the ratio. Most people working in Wellesley commute from other towns
every day, and this can be seen in the estimated size of its “workplace” or daytime population:
23,220 workers, which includes 4,246 who live in Wellesley. 14
Household characteristics
Housing is a product, and households can be thought of as consumers. The housing needs
and preferences of households vary by age group, household size, commuting distances,
access to goods and services, and clearly, what people can afford for rent or a mortgage
payment. The size and composition of a community’s households often indicate how well
suited the existing housing inventory is to residents. In turn, the number and type of
households and their spending power influence overall demand for housing.
HOUSEHOLDS AND FAMILIES
The Census Bureau divides
households into two broad classes: HOUSEHOLDS BY SIZE IN WELLESLEY
(Source: ACS 2011-2016, Barrett Planning Group)
families and non-families. A family
2,500
household includes two or more 1 2 3 4 5 6 7+
Number of Households
related people living together in 2,000
the same housing unit, and a non-
1,500
family household can be a single
person living alone or two or more 1,000
unrelated people living together 15
500
Town-wide, non-families comprise
about 23 percent of all households 0
in Wellesley. 16 Compared with Homeowners Renters
surrounding cities and towns, Number of People in Household
Wellesley’s family household rate
of 77 percent is on the lower end,
but much higher than the state average. As for family type, married couples make up an
exceptionally high 91 percent of all families in Wellesley (and 70 percent of all households). 17
14 Census Bureau, Journey to Work Tables.
15 People not counted as members of a household are counted in the group quarters population, i.e., college students or
nursing home residents. See also, Appendix A, Glossary. For zoning and federal Fair Housing Act purposes, the definition
of “family” differs from that used by the Census Bureau.
16 ACS 2012-2016, B11001, "Household Type (Including Living Alone)," and Barrett Planning Group.
17 Ibid.20 / Wellesley Housing Production Plan 2018 HOUSEHOLD SIZE & COMPOSITION Wellesley may not have the region’s largest percentage of family households, but it ranks near the top of the Greater Boston area for family size. Over 34 percent of its households include four or more people, and since 1990 Wellesley’s average family size has gradually increased even as household sizes overall have dipped. Today, the Census Bureau estimates that Wellesley’s average household includes 2.84 people and the average family, 3.32. This seems consistent with findings in the Unified Plan that the primary group of households moving into Wellesley are “adults in the 35- to 44-year-old range in households with their children” while those moving out include young people leaving Wellesley to attend college or moving to job centers in other parts of the country and people in their seventies and older. 18 The fact that Wellesley has a large percentage of families with dependent children seems widely understood in the town, but the characteristics of other types of families and nonfamily households matter as well. Single people living alone comprise some 20 percent of all Wellesley households and 87 percent of all nonfamily households. An unusual feature of Wellesley’s one-person households is that about 60 percent are senior citizens: low compared with many suburbs and small towns. HOUSEHOLD WEALTH Household income influences Table 2.2. Household Income Summary where people live, their health Town Median Median Family Median care and quality of life, and the Household Income Nonfamily opportunities they can offer Income Income their children. Wellesley’s Dover $189,265 $205,139 Not Reported prestige is inextricably tied to Natick $104,372 $135,824 $51,932 the wealth of its households, Needham $139,477 $166,931 $54,919 and this has been true for a Newton $127,402 $170,639 $56,907 long time. Table 2.2 offers a Sherborn $158,250 $168,036 $63,125 snapshot of three median Wayland $157,500 $191,134 $44,448 income indicators – all WELLESLEY $171,719 $200,817 $74,000 households, family Weston $191,744 $235,766 Not Reported households, and non-family Greater Boston $77,809 $98,431 $45,866 households – that have an Source: ACS 2011-2016. important place in any conversation about housing affordability. As seen below, Wellesley is the third wealthiest town in the immediate area, behind Weston and Dover, in terms of median household and median family income. However, the nonfamily median income in Wellesley exceeds that of all the surrounding communities and ranks third for the state. 19 This reflects, at least in part, the fact that Wellesley’s one-person households include a broader mix of people than elderly seniors (75 years and over), whose incomes tend to be very low, especially among women. Single people living alone in Wellesley cover all age groups of owners and renters 24 years and over. 18 Wellesley Unified Plan, (Draft, 2018), 7-5. 19 ACS 2012-2016, B19202.
HOUSING NEEDS ASSESSMENT / 21

Median income statistics shed light on a community’s relative economic position, but they
also can mask extreme differences in household wealth. The next chart compares Wellesley
and the Boston Metro area by the percentage of households in a range of incomes. The chart
reinforces that Wellesley has a disproportionate concentration of households in the highest
income band, i.e., there is greater income inequality in Wellesley than in surrounding region.
As shown later in this section, statistics from the U.S. Department of Housing and Urban
Development (HUD) show that 17 percent of Wellesley’s households have incomes that fall
within the meaning of low or moderate income, and about 72 percent of these households
spend more of their monthly income on housing than is generally considered affordable. (See
“Housing Cost Burden”).

                                                DISTRIBUTION OF HOUSEHOLD WEALTH
                                                  (Source: ACS 2011-2016, Barrett Planning Group)

                           100%
                           90%
                           80%
      Percent Households

                           70%
                           60%
                           50%
                           40%
                           30%
                           20%
                            10%
                            0%
                                              Wellesley                             Boston Metro
                                  Less than $25,000             $25,000 to $34,999                  $35,000 to $49,999
                                  $50,000 to $59,000            $60,000 to $74,999                  $75,000 to $99,999
                                  $100,000 to $124,999          $125,000 to $149,999                $150,000 to $199,999
                                  $200,000 or more

Comparing household incomes by household type or age offers another way to explore
household income advantages and limitations. It is not uncommon for seniors to have lower
incomes than young families, and this applies to Wellesley, too. However, Wellesley stands
out for the degree of difference between the incomes of its young families (householders
between 25 and 44 years) and their Boston Metro counterparts. In Wellesley, the median
income for this group is $217,222: 2.5 times more than the Boston Metro median income for
the same group of householders, $88,000. Furthermore, both regionally and nationally, the
highest-income householders are between 45 and 64 years, but this is not the case in Wellesley,
where their median income is 90 percent of the median for the younger cohort. And, the
22 / Wellesley Housing Production Plan 2018
younger cohort represents most movers into Wellesley. 20 Single women without children and
single retirees (people 65 and over) have the lowest incomes in Wellesley.
Housing characteristics & trends
WELLESLEY’S HOUSING SUPPLY
Wellesley has approximately 9,134
housing units. The overwhelming HOUSING AGE IN WELLESLEY
Est. Year of Construction
majority are detached single- (Source: ACS 2012-2016)
family homes, and while many are
4,000
older homes built before 1940, 2010 or later
3,500
about 11 percent (over 1,000 units) 2000 to 2009
Number of Units 3,000
have been constructed since 2000. 1990 to 1999
2,500
Most of these did not add to the
2,000 1980 to 1989
town’s housing supply. Instead,
they replaced older homes that 1,500 1970 to 1979
were torn down to make way for 1,000 1960 to 1969
new, larger residences. 500
1950 to 1959
0
1940 to 1949
Since 2009, Wellesley’s building Housing Units
department has issued 575
residential demolition permits. Some of the town’s neighborhood streets have been virtually
transformed by the prevalence of teardown activity, such as Westgate, Wynnewood Road,
Patton Road, or Benvenue Street, and several interconnected streets north of Route 9, or
Livingston Road and Ridge Hill Farm Road near the Dover/Needham line. 21 While words
like “redevelopment” sometimes make people cringe, Wellesley is obviously redeveloping.
The effects can be seen in just about every neighborhood in town. Nearly all the replacement
housing consists of large single-family dwellings, though near Wellesley Square, two-unit
residential condominiums have been built as well. 22
20 ACS 2012-2016, B19049.
21 Wellesley Planning Department, “SFR Demo Permits 1-1-2009 to 2-18-2018” (Excel).
22 Wellesley Planning Department, “SFR New Permits 1-1-2009 to 2-18-2018” and “2-Family New Permits” (Excel).You can also read