Addressing the Knowledge Worker Talent Gap in Southern California - Four-Year Colleges and Universities
←
→
Page content transcription
If your browser does not render page correctly, please read the page content below

LOS ANGELES COUNTY ECONOMIC DEVELOPMENT CORPORATION

Four-Year Colleges and Universities
Addressing the
Knowledge Worker Talent Gap
in Southern California
CONTENTS
03   Foreward

06   Executive Summary

10Introduction
  Geographic Definition
  Economic Overview
  Why Higher Education Matters
  The Role the California State University
                                                 STUDY AUTHORS
		 System Plays
                                                 Shannon M. Sedgwick
                                                 Eric Hayes
21Southern California                            Arthur Girard
  Resident Characteristics                       Wendy Disch
  Industry and Occupational Forecasts
                                                 This study was commissioned
  California State Universities in Southern
                                                 and funded by California State
		 California                                    University, Northridge (CSUN) as
  Case Study: CSU Northridge                     part of its ongoing commitment
  The CSU Student Body in Southern California    to making purposeful and effec-
                                                 tive educational and research
                                                 contributions that will help en-
30   Hiring Industries with Promise              sure that the region and beyond
     The Demand for High-Skill Jobs              has university-prepared work-
     Health Care                                 force, the change makers and the
     21st Century Education                      innovative insights essential for
     Professional Services                       the future of the economy and
                                                 for the evolution of diverse and
     Information
                                                 inclusive communities.
     Manufacturing
                                                 (No state tax dollars — general fund dollars —
                                                 were spent to commission, fund, or produce
74Degree Gap Analysis                            this study.)
  Jobs Requiring a Master’s Degree for Entry
		 with Degree Gaps                              Cover design:
  Jobs Requiring a Bachelor’s Degree for Entry   CSUN’s Tseng College design team
		 with Degree Gaps
  Current Workers at Risk
  Middle-Skill Jobs with Degree Gaps             CSUN: https://www.csun.edu

81   Conclusion
     Opportunities for further research
     Possible next steps

85   Appendix

2
FOREWORD outhern California’s impressive array
of four-year colleges and universities
have always played an outsized role in
the region’s talent development landscape,
educating more than 141,300 post-secondary and
graduate students annually. But, as the Southern
California regional economy, like the global
economy, continues to be further enveloped and
transformed by digital technology in what has
been referred to as a “globotics” economy,1 their
already outsized role will become more important
as the rapidity and scale of changing labor market
conditions continue to accelerate and an increas-
ing number of the region’s residents are presented
with both the promise of economic success and
the peril of being left behind.
“ Recent years have yielded significant advances,
with profound impacts on society. Technology
is transforming the way we work, play, and
interact with others. From these technological
capabilities, new industries, organizational
forms, and business models are emerging. The
education system will need to adapt to prepare
individuals for the changing labor market.”
— National Academies of Sciences2
In particular, structural changes in the labor
market brought on by information technologies,
automation, robotics, artificial intelligence,
machine learning, internet of things, and ever more
powerful computers are changing the nature
of work, the need for labor, the organization of
firms, the rewards that workers now earn, and the
segmentation of our labor markets, with the
fastest-growing labor market segments being
low- and high-skilled occupational categories.
At the same time as labor markets are rapidly
changing and becoming increasingly stratified, we
are also not meeting industry’s growing demand
for a university-prepared workforce.
1
See Richard Baldwin, “The Globotics Upheaval: Globaliza-
tion, Robotics, and the Future of Work” (February 2019)
2
National Academies of Sciences, Engineering, and Med-
icine, “Information Technology and the U.S. Workforce:
Where Are We and Where Do We Go from Here” (2017)
3According to Georgetown University’s Center In face of these challenges, higher education
on Education and the Workforce, at the current should not be asked to solve these problems on
production rate in higher education, the U.S. its own. In the coming years, it will be increasingly
will fall short millions of the workers with post- more important for industry to collaborate with
secondary credentials that it will need over the educators in creating programs that guarantee
next few years. Here in California, that shortage students are learning the skills future employers
is forecasted to be around 1.1 million by 2030.3 expect. These partnerships should promote
And according to a McKinsey Global Institute flexibility at universities to equip students with
analysis, approximately 60 percent (60%) of the professional development and knowledge
employers say that college graduates currently necessary to secure a decent paying job and avoid
lack the “soft” and technical skills needed to over or under supplies of workers. Some programs
succeed in the labor market of the future. may see an increase in apprenticeships or on-the-
job learning in lieu of class time. Creating more
This is clearly a need that is not being met and nimble degree requirements, that allow math and
could be further exacerbated by the fact that the science majors more opportunities to develop
number of high school graduates in the region soft skills, or students in social sciences to receive
is flat, and that number is likely to remain flat increased instruction to develop technical skills,
because the population of under-25-year-olds will lead to a more productive and hirable
is projected to stay constant or decline through workforce. The private sector must be encouraged
2025 due to lower replacement rates and an aging to digest reports such as this and collaborate
population.4 Taken together, these marked demo- with higher education in order to initiate greater
graphic shifts and our failure to meet industry’s upward job mobility for workers. Accepting
growing need for workers with post-secondary apprentices and interns, designing new degree
credentials, along with the necessary “soft” and programs, and encouraging lifelong learning are all
technical skill competencies, could hasten the ways in which the private sector can support the
substitution of labor with capital at the post- future workforce instead of relying on automation
secondary skills level, resulting in the potentially and distancing itself from labor demands.
extreme economic situation where we experience
both high unemployment as a result of displace- While Southern California’s four-year universities
ment due to automation and a shortage of high- and colleges face a number of threats and
skilled talent, depressing gross regional production challenges as a result of the above-mentioned
(GRP) and putting further pressure on government labor market and demographic trends, these
and other institutions to provide more social weighty matters also represent major opportunities
assistance with fewer resources (i.e. tax revenues) if the region’s four-year colleges and universities
to pay for and support those services. can responsively address them. This report,
which represents a collaboration between the
Los Angeles County Economic Development
Corporation (LAEDC) and California State
University, Northridge (CSUN), is intended to
provide useful information about the region’s
future industrial and high-skill employment
concentrations, to forecast important shifts in
the region’s post-secondary-relevant job markets
and to identify trends (i.e. projected growth
or contraction) within key post-secondary
occupational categories to help guide Southern
California’s four-year colleges and universities.
3
See Public Policy Institute of California, “Will California
Run Out of College Graduates?” (October 2015)
4
See LAEDC, “LA Area Community Colleges at a
Crossroads” (February 2019), citing IPEDS, DataMart,
California Department of Finance and California
Department of Education statistics
4More specifically, the four (4) co-equal goals of
this report are to: In the coming years, it will
1. Identify the economic forces that are shaping
the future industrial makeup and associated be increasingly more important
labor markets for undergraduate and graduate
degree holders in the Southern California region for industry to collaborate
2. Understand the implications of these future
economic and labor market trends on post-
with educators in creating
secondary credentialing and education in the
region programs that guarantee
3. Ascertain the most promising pathways into students are learning the skills
a four-year college for those who are at risk
of being left behind and ease their transition
future employers expect.
towards post-secondary credentialing
4. Use 1, 2 and 3 to help guide the region’s
four-year colleges and universities as they
prepare our local supply of labor for the
innovation-intensive industries of tomorrow
This report researches the importance of educa-
tion in the region and the increased demand for
job-seekers to attain higher levels of education
now than ever before. The report identifies occu-
pations at-risk of increased degree requirements,
as well as high-skill, in-demand occupations with
degree gaps that can be filled by new university
programs or boot camps. The importance of soft
skills, as well as technical skills, is a consistent
requirement across all industries, further under-
lying the importance of higher education to be
more flexible and adopt degree programs that
develop an array skill sets that equip students for
the rapidly changing workplace.
To this end, the LAEDC is partnering with CSU
campuses on this foundational “future of work”
report that will help inform and influence higher
education here in Southern California as it
educates and trains its students for the economy
of the future.
5EXECUTIVE n the contemporary context, there is a need
SUMMARY for a high talent university-prepared work-
force. Many long-term trends are shifting the
economy away from growth predicated on labor—
that is, where additional labor capital is the
primary driver of value creation and capture—
toward an economy in which growth is dependent
on the productivity, creative input and knowledge
of the existing and future workforce. Here in the
five-county region of Southern California (counties
of Los Angeles, Orange, Riverside, San Bernardino
and Ventura), the labor market continues to
bifurcate, as we produce greater numbers of high-
tech and other “knowledge economy” jobs, as well
as a vast quantity of low-skill service jobs that
don’t necessarily provide family-supporting wages
and sustainable career trajectories.
It is important for Southern California to fully
FOREWARD connect its population to the broader economy
and the industries in which it has productive
advantages, as well as to take advantage of its
existing human capital by tackling the skills
mismatch endemic in many of our communities
and population cohorts and by connecting the
education pipeline to growing industries at low
risk of capital-labor substitution in order to
provide the labor force necessary for the region
to experience broad-based and more inclusive
economic prosperity.
A more educated and better prepared workforce
is beneficial to the Southern California economy,
contributing to increased productivity, higher
wages, lower poverty rates and social service
expenditures, improved health outcomes and
By 2023, approximately
23 percent of all jobs in the
region will require a bachelor’s
degree or higher.
6 EXECUTIVE SUMMARYhigher tax revenues. Moreover, a deep and highly- EXHIBIT ES-1
By June 2020,
Unemployment in Southern California
educated talent pool is a key determinant—if not, the unemployment
1990 to June 2020 rate reached 17.0% as
the key factor—to successful attraction of firms a result of COVID-19
from high-wage, growth industries to the region.
Today in Southern California just under 60 percent 18%
of the population ages 25 years and older has an 16%
2010 Jan-June
education of bachelor’s degree or higher. To keep 14%
12.2% 2020
1993 11.1%
up with this transitioning economy, we need to do 12%
9.5%
even better. 10%
2003
8% 6.4%
The Southern California economy is expected to 6%
1990
grow from 7.0 million jobs across all industries in 4%
5.5%
2000 2007
4.9% 5.0% 2018
2018 to 7.5 million jobs in 2023. By 2023, approx- 2% 4.2%
imately 23 percent of all jobs in the region will 0%
2020
2010
2012
2014
2016
2018
1990
1992
1994
1996
1998
2000
2002
2004
2006
2008
require a bachelor’s degree or higher. There will
be 10.5 million total openings between 2018 and
2023, including 5.1 million new jobs and 5.4 million Unemployment Rate Sources: BLS LAU
Recession
replacement jobs, which are job openings related
to employment churn and attrition. Of these 10.5
million total openings in the Southern California
region over the next five years, the educational EXHIBIT ES-2
Projected Job Growth by Entry-Level Education
attainment requirements will be as follows: 15.6 Percentage change from 2018 to 2023
percent of openings (1.6 million) will require at
least a bachelor’s degree for entry; 0.6 percent Master's degree 9.6%
will require a master’s degree; and 0.6 percent will Associate degree 7.7%
require a doctorate or professional degree. Postsecondary non-degree award 7.1%
PhD/professional degree 7.1%
Bachelor's degree 7.0%
The annual unemployment rate in the Southern High school diploma or equivalent 6.5%
California region in 2018 was 4.2 percent (Exhibit Less than high school 6.2%
ES-1); a rate this low means employers will find it Some college, no degree 5.3%
more difficult to fill job openings. At the peak of
Total, all levels of education 6.6%
the Great Recession, the unemployment rate
Source: LAEDC
in the Southern California region reached 12.2
percent in the region. Across the U.S., unemployed
individuals numbered 6.6 for every one job
opening during the recession’s peak; currently Southern California
that number has dropped to 1.1 for every one
opening (2018). Demographics play a key role in the growth and
quality of the labor force and to a large extent
Upward economic mobility is easiest for those determine the growth potential of the economy.
who obtain a bachelor’s degree or higher.
Employers were increasingly demanding a four- Just over 31 percent of Southern California
year college degree while there was slack in the residents have a bachelor’s degree or higher.
labor market and educated applicants were
plentiful; however, the tight labor market of Jobs in occupations with an entry-level require-
today is influencing employers to become more ment of a bachelor’s degree or higher are
lax in their job posting degree requirements out expected to grow at faster rates compared to
of necessity, providing opportunities for colleges occupations requiring lower levels of education
and universities to create modular programs for entry (ES-2).
such as credential programs, training boot camps
and more flexible online options.
7 EXECUTIVE SUMMARYJob openings in health care and social assistance, successfully perform the job duties for a specific
accommodation and food services, and construc- occupation), this report quantifies the number of
tion will add the most jobs, while construction, current workers at risk of being shut out of future
transportation and warehousing, and healthcare job opportunities.
and social assistance will grow the fastest.
The following target high-skill occupations are
identified as having a degree gap in Southern
California, meaning employers of these occupa-
Hiring Industries with Promise tions are requesting higher degrees from their job
candidates compared to what has traditionally
We identify target industries that are most been identified as the entry-level education
promising in terms of having a high concentration required to obtain work in this occupation:
of high-skill jobs, those requiring a bachelor’s
degree or higher for entry, and use the occupa- High-skill occupations with a degree gap may
tional composition of those industries along with represent the best opportunities for universities to
their expected job growth, to identify the top create modular programs such as credential pro-
detailed occupations classified as high-skill. We grams, training boot camps, and online options.
present their predicted job needs from 2018 to
2023. High-skill occupations identified in our target
industries, which traditionally required a master’s
The following industries are identified as targets degree for entry with the largest degree gaps
for specific education interventions: include:
i Health Care and Social Assistance i Computer and Information Research
i 21st Century Education Scientists
i Professional and Business Services i Marriage and Family Therapists
i Information i Physician Assistants
i Manufacturing i Education Administrators, Postsecondary
i Librarians
i Statisticians
i Survey Researchers
Degree Gap Analysis
High-skill occupations identified in our target
Changes in the requested entry-level education, industries, which traditionally required a bachelor’s
such as moving from a minimum Associate degree degree for entry with the largest degree gaps
requirement to a bachelor’s degree requirement, include:
in job postings for occupations can identify either
i Computer and Information Systems Managers
a change in the skills, including, for example, the
i Electronics Engineers, Except Computer
expanded use of technology to successfully per-
i Financial Managers
form the job duties, or it may indicate that existing
i Health Educators
education and training programs are not teaching
i Electrical Engineers
the right mix of skills that employers are seek-
i Mechanical Engineers
ing in potential job candidates. We compare the
entry-level education requested in employer job
One way of identifying occupations that are
postings for our target high-skill occupations in
increasing in tech intensity is by tracking
Southern California to the educational attainment
employers requesting a four-year degree for
of workers currently employed in that occupa-
occupations that have typically not required one.
tion in the region to identify degree gaps. In this
These occupations may represent future opportu-
way, imbalances in the regional labor market can
nities for universities to offer new baccalaureate-
be identified. In instances where degree inflation
level programs, providing job seekers with the new
may be occurring (when employers are requesting
skills required by employers for these jobs today
a level of education higher than is necessary to
and into the future.
8 EXECUTIVE SUMMARYThe following middle-skill occupations are i Educational attainment plays an out-sized role
identified as having a degree gap in Southern in our understanding Southern California’s
California: current and future labor markets. It is a key
element in understanding challenges and
i Nuclear Technicians
opportunities present in a region’s workforce.
i Wind Turbine Service Technicians
It helps employers assess the quality of the local
i Environmental Engineering Technicians
labor pool. It helps individuals quantify the
i First-Line Supervisors of Fire Fighting and
benefits of pursuing additional education, such
Prevention Workers
as being less exposed to economic shocks (like
i Respiratory Therapists
the one related to the Coronavirus pandemic),
i Desktop Publishers
and it can reveal whether an area is economi-
i Respiratory Therapy Technicians
cally disadvantaged requiring higher levels of
i Psychiatric Technicians
public services and resources.
i Funeral Service Managers
i Bookkeeping, Accounting, and Auditing Clerks i “Soft skills” matter…a lot. The most in-demand
skills and competencies include “soft skills” such
Regardless of the degree requested, workers as interpersonal skills, creativity, critical thinking
with a higher level of education than necessary and problem solving, and written and verbal
to successfully complete the job duties in an communication skills. Leadership, mathematical
occupation are more likely to feel disengaged or statistical knowledge and data and analysis
and find employment elsewhere. are additional skills required by employers look-
ing to fill high-skill positions.
i Scale and speed of this great economic
transformation are outpacing the ability of
Other Key Findings educators to respond in real-time. Educators
are facing several hurdles when trying to
In addition to identifying hiring industries with
educate students for the jobs of tomorrow:
promise for high-skill occupations and looking
a. Irrespective of the degree program, all stu-
into potential degree gaps, this report identifies
dents will need to adapt quickly to changing
a number of other key findings, including:
technologies and be proficient with data.
i The well-educated are migrating to Southern b. The pace of technology acceptance, adop-
California. While fewer than one-third (31 tion and deployment is affecting the ability
percent) of current Southern California-based of educators to keep up, and so degree and
residents have at least a bachelor’s degree, half non-degree programs are constantly playing
of the individuals who moved into Southern catch up in terms of both their understanding
California from another state or from abroad of and their ability to teach to these changes,
have a bachelor’s degree or higher. This as well as the tasks students and incumbent
suggests that there are significant and growing workers will need to perform as a result.
job prospects for individuals with higher levels c. Educators will need to teach students
of education. how to apply the knowledge they learn in
a real-world, real-time setting.
i Economic transformation presents challenges,
but also opportunities. Collaboration between
employers and educators may reveal oppor-
tunities to create new education and training
programs to ensure workers who completed
these programs are trained in the required skills
and are job ready within specific industries.
9 EXECUTIVE SUMMARYINTRODUCTION
Southern California is experiencing a tight labor EXHIBIT 1-1
By June 2020,
market, with its lowest annual unemployment Unemployment in Southern California the unemployment
1990 to June 2020 rate reached 17.0% as
rate (4.2 percent in 2018) in decades (Exhibit 1-1). a result of COVID-19
Related to this, many employers assert they are
having difficulty finding qualified candidates with 18%
the right mix of skills to meet their diverse needs, 16%
2010 Jan-June
meaning workers with the requisite skills are in 14% 2020
12.2%
high demand. The rapid transition toward informa- 1993 11.1%
12%
9.5%
tion- and knowledge-centered work across 10%
almost all industries and at all skill levels makes 2003
8% 6.4%
an amalgam of soft skills and analytical abilities 6%
essential to a student’s employability and profes- 1990
4% 2000 2007
5.5% 2018
sional advancement in the future. 4.9% 5.0%
2% 4.2%
0%
2020
2010
2012
2014
2016
2018
1990
1992
1994
1996
1998
2000
2002
2004
2006
2008
This report, which is the initial research in a
collaboration between the LAEDC and CSUN,
sheds further light on the above issues and Unemployment Rate Sources: BLS LAU
provides useful information about the region’s Recession
future industrial and high-skill employment
concentrations, forecasting the region’s job
markets and identifying trends (i.e. projected
growth) within key industries and their post-
secondary occupations to help inform and
guide Southern California’s four-year colleges
and universities.
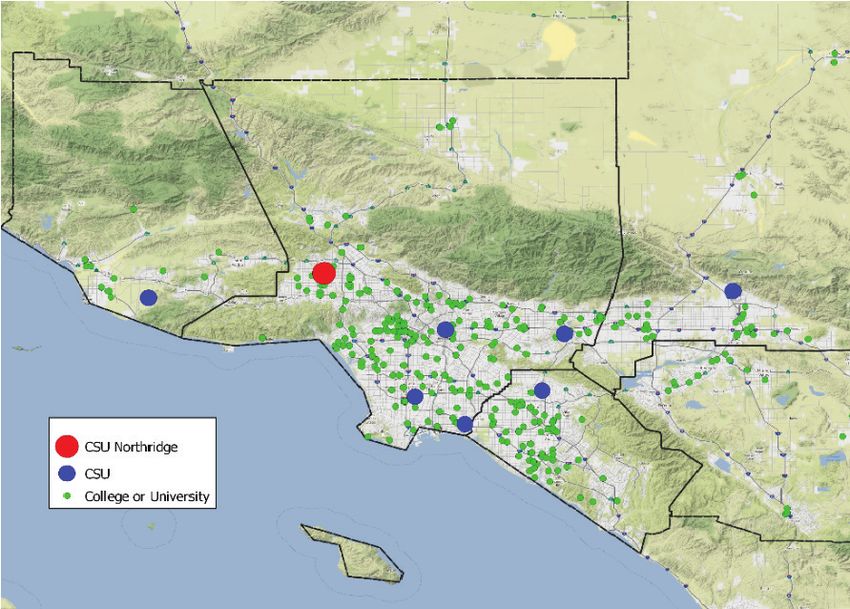
10 Section 1: INTRODUCTIONIndustry forecasts and occupational projections EXHIBIT 1-2
included in this report were developed prior to The Southern California Region
the COVID-19 pandemic. It is likely that growth in
these industries/occupations will be impacted by
the measures taken to mitigate the spread of
the virus, including lingering effects of mandated
closures, new guidelines for doing business,
federal monetary and fiscal policies, local and
state relief measures, and changes in consumer
behavior, but that over the longer-term (beyond
our forecasts and projections for 2023), employ-
ment is expected to return to pre-COVID-19
levels. Due to rapidly changing conditions in the
Southern California economy, the dearth of
real-time economic information and data, and the CSU Northridge Source: LAEDC
uncertainty that exists for many economic factors CSU
College or University
used to determine our forecasts/projections, we
have not yet made revisions.
EXHIBIT 1-3
Nonfarm employment in
Nonfarm Employment June 2020 was 10.4%
Geographic Definintion in Southern California
(millions of jobs)
lower than June 2019
due to COVID-19
The Southern California region in this report 8.4
includes five counties, which are shown in Exhibit 8.2
8.0
1-2 and defined below. 7.8 Jobs lost during Recession
were fully recovered by 2015
7.6
1. LA County 7.4
7.2
2. Orange County 7.0
3. San Bernardino County 6.8
2019 (Jan-June)
2020 (Jan-June)
4. Riverside County 6.6
6.4
5. Ventura County
6.2
6.0
2010
2011
2012
2013
2014
2015
2016
2017
2018
2019
2007
2008
2009
These five counties account for 47.5 percent of
California’s total population of million and 46.4
Sources: BLS SAE
percent of total nonfarm payroll employment
across the state.
Economic Overview
Employment opportunities for residents of Nonfarm employment in Southern California has
Southern California will depend on the health of exceeded pre-recession peak employment (2007)
the regional economy. Before looking at what by more than 600,000 jobs (8.2 percent). While
lies ahead for regional employment, let’s look at recovery from the Great Recession saw anemic
where we have been. employment growth beginning in 2011, by 2015 we
had recovered the number of jobs lost. Nonfarm
employment has been growing in the region for
eight consecutive years, and we anticipate this
trend to continue through 2023 (Exhibit 1-3).
11 Section 1: INTRODUCTIONSimilarly, many industry sectors follow this EXHIBIT 1-4
general contour of growth; however, there are Manufacturing Employment Growth 2008 to 2018
Los Angeles County
differences among individual industries. For
example, manufacturing (NAICS 31-33) employ-
30% 27.1%
ment in Los Angeles County has been experiencing 24.2%
20.3%
a long-term sectoral decline for decades, yet 15%
employment in beverage manufacturing (NAICS
312) and petroleum and petroleum products 0%
manufacturing (NAICS 324) have grown by 20
percent and 27 percent, respectively, over the last -15%
-21.0%
decade (Exhibit 1-4).
-30%
2008 2018
Despite ample positive macroeconomic news, Total, All Industries
the labor market continues to bifurcate, as we Manufacturing (NAICS 31-33)
produce greater numbers of high-tech and other Beverage Mfg (NAICS 312)
Petroleum & Products Mfg (NAICS 324)
“knowledge economy” jobs, as well as a vast
quantity of low-skill service jobs that don’t neces-
sarily provide sustainable career trajectories.
EXHIBIT 1-5
These tight labor market conditions have recently Labor Force Participation Rates
in Southern California
begun to drive wage growth, with increases in
wages being felt most strongly at the low and high
67%
ends of the income distribution. 2009
65.9%
66%
While the broader economy of the region is
quite strong, as reflected by regularly reported 65%
2018
economic data, such as unemployment and 64.1%
production rates, the recovery from the financial 64%
crisis has dramatically shifted the economic
63%
fortunes of most of households. For example, 2015
63.2%
despite the decline in the unemployment rate,
62%
labor force participation remains lower than earlier
2010
2011
2012
2013
2014
2015
2016
2017
2018
2009
levels (Exhibit 1-5), and the workforce overall is
Source: ACS 1-Year Estimates
still feeling the maleficent effects of the structural
shifts that resulted from that dramatic economic
shock, coupled with a fast-transforming macro
economy.
Many long-term trends are shifting the economy As this deceleration in human capital expansion
away from growth predicated on labor—that is, continues, it is important for Southern California
where additional labor capital is the primary driver to fully connect its population to the broader
of value creation—toward an economy in which economy and to take advantage of its existing
growth is dependent on the productivity of the human capital by tackling the skills mismatch and
existing workforce. An aging population and work- connecting the education pipeline to growing
force, coupled with historically low replacement industries in order to provide the labor force
rates, has created additional pressure to automate necessary for the region to experience broad
jobs, and even migration trends are reflecting less based economic prosperity.
domestic labor demand for unskilled labor and
more for immigrants with college degrees.
12 Section 1: INTRODUCTIONWhy Higher Education Matters Universities that provide today the high-talent
university-prepared workforce needed to
Higher education plays an essential and dynamic lead and shape the sustainable and more equitable
role in economic development in regions across economic future of complex urban regions, like
the United States, particularly so in large urban Southern California, must be increasingly cross-
areas. In the contemporary context, there is a need disciplinary, purposefully linking the breadth
for a high talent university-prepared workforce; of education (general/liberal) to preparation
it is a key component of economic growth, for professional practice in any field. That is, a
diversification, and attracting and holding both university-level education today should be increas-
new and existing employers with evolving needs ingly focused on educating students to be
that are often engaged nationally and globally. both thought and field leaders. Indeed, those
For the university-prepared workforce today, the organizations hiring, for example, someone with
nature of practice across the career span requires advanced university preparation in computer
a great deal of versatility and conceptual depth engineering, social work, or media development,
and breadth. are not looking for individuals who require a
significant amount of guidance and oversight.
Today, an individual’s compilation of knowledge, Instead, they are looking for individuals with a
skills, abilities, experiences, values, and habits level of talent and insight in such fields that will
of mind is required to be responsive to changing tell them what the organization needs to do—
possibilities and evolving realities in and across what new possibilities are there, how to think
fields of expertise and in practice. Increasingly, about the work differently in market and industry
an individual working in the contemporary context, how to create/co-create, and how to
context must be ready to apply knowledge design solutions to a changing array of challenges.
(broadly understood) of a changing array of
roles/projects and the altering nature of the work
done by any highly-competitive employer as the
regional and world economy evolves. Given the
nature of work for the university-prepared work-
force today and looking towards the future of
work, universities are now called upon to rethink
the education they provide. Disciplines and fields
are integrating and transforming in contemporary
professional practice. Universities are (or need
to be) responding to that fundamental change,
providing the knowledge and skills a university
graduate at the baccalaureate or graduate level
needs to know and the training for how they need
to think in many different working groups. These
graduates will be engaging with others who bring
a very different compilation of capabilities to the
work—making the high-value collaborative work
they produce far greater than the sum of its parts,
leading to new directions and other possibilities.
13 Section 1: INTRODUCTIONEducation and EXHIBIT 1-6
Economic Opportunity Civilian Unemployment Rate 2018
by educational attainment
Obtaining some form of higher learning is the ■ California
7.0% ■ Southern California
primary vehicle to better one’s economic position,
whether it is to increase employment opportuni- 5.9% 5.8%
5.5%
ties, change career paths, earn higher wages, or
4.7% 4.5%
seek out a better quality of life. Unemployment
rates, median earnings and poverty levels all differ 3.1%
3.4%
according to the highest level of education ob-
tained; that is, an individual’s educational attain-
ment.
Less than High School Associate/ Bachelor’s
High School or equiv. Some college and higher
Unemployment is highly correlated with educa- Source: 2018 ACS 1-year estimates
tional attainment (Exhibit 1-6).
Overall, the unemployment rate for individuals
aged 25 to 64 years was 4.5 percent in Southern EXHIBIT 1-7
Median Earnings and Educational Attainment 2018
California in 2018. However, residents with a Population 25 years and older
bachelor’s degree or higher had an unemployment
rate of just 3.4 percent in the region in 2018, $81,923
Graduate/Professional
roughly half the rate experienced by those at the $90,204
opposite end of the spectrum. (Those with less Bachelor's $59,890
than a high school education and those with $62,347
a high school diploma or equivalent reported Associate/Some college $38,430
$39,614
an unemployment rate of 5.9 and 5.5 percent,
High School or equiv. $31,313
respectively.) Median Earnings
$31,954 Population 25+ years:
$24,122 Southern CA: $40,240
Less than High School California: $42,160
Higher levels of educational attainment are also $24,263
highly correlated with higher earnings (Exhibit
■ Southern California
1-7). ■ California Source: 2018 ACS 1-year estimates
Earnings differentials exist among employed indi-
viduals with varying levels of educational attain-
ment. In the Southern California region, those with
the highest level of education—i.e. a graduate or
professional degree—earn an annual wage premi-
um of about $58,000 over those with less than a
high school education. Similarly, individuals with
an bachelor’s degree enjoy a significant wage pre-
mium over those with lower levels of educational
attainment; approximately $28,500 over those
with a high school diploma or equivalent annually,
and close to $36,000 over those with less than a
high school education annually.
The combination of higher rates of unemployment
and lower annual median earnings yield higher
levels of poverty for those with lower levels of
education. Relative poverty is a measure of income
inequality.
14 Section 1: INTRODUCTIONEducation and COVID-19 rates. In stark contrast, a significant portion of
jobs that require lower levels of education are
Moving into 2020, we were continuing a long and concentrated in businesses identified as non-
unprecedented expansionary period, economic essential that were mandated to close under the
fundamentals were strong, with few economists Stay at Home order issued by Governor Gavin
predicting a recession in 2020…just a few months Newsom on March 19, 2020.
later we found ourselves in a whole different
world. In the midst of the Coronavirus, weekly initial
Unemployment Insurance (UI) claims data has
First appearing in California in late-February, the been a metric providing much needed insight on
novel Coronavirus (COVID-19) and the measures the effects the pandemic has been having on our
taken to mitigate the spread of the virus, brought economy, specifically, the magnitude of COVID-
business and life to a grinding halt over the first 19’s labor market impacts and how different types
half of 2020. In mid-March, we had already started of workers are experiencing these impacts. More
to experience disruptions in global supply chains, than 4.8 million initial UI claims have been filed in
hoarding and the resulting short-term shortages California from March 15th to May 30th (Exhibit
of essential goods, the cancellation of large 1-8). Of these claims, just under 4.1 million were
gatherings, the closure of schools and universities filed by those with an education of less than a
moving to online instruction, sheltering in place bachelor’s degree, accounting for more than
and self-quarantining, and of course, the mandated three quarters (76.2 percent) of total initial claims
closure of nonessential businesses such as filed over the period.
restaurants, hair and nail salons, theaters, and
retail stores, which left many workers in Southern
California stuck at home without the guarantee
EXHIBIT 1-8
of pay. These events have given rise to unprece- Initial UI Claims in CA During the COVID-19 Crisis*
dented economic challenges. by educational attainment
In a typical recession, which is usually a “demand- 2,376,289 Initial UI Claims Filed
from 3/15 to 5/30:
side” problem, driven by a demand shortfall, the
4.8 million
contraction takes place over several quarters
or months, but this economic disruption is both 1,272,300
a demand and supply-side problem, with demand
and supply shocks, and it was almost instantaneous, 595,861
441,331
occurring in a matter of weeks. While COVID-19 163,122
may be an exogenous, single event-driven
economic shock, and some indicators may Less HS Associate/ Bachelor’s Graduate
than HS or equiv. Some college
return to their pre-crisis trend, it is highly likely
* Excludes PUA claims
that longer-term implications for the diverse Source: CA Policy Lab
industries here in Southern California will be
varied.
The immediate economic effects of COVID-19
have not been equally distributed. Higher-income
workers in professional services, management, and
computer and mathematical occupations were
able to make the transition to work remotely. Not
only have their jobs been somewhat inoculated,
if not protected over the short-term, but these
households are also likely to have higher saving
15 Section 1: INTRODUCTIONIf we split out the labor force in California accord- EXHIBIT 1-9
ing to the educational attainment of workers and Initial UI Claims in CA by Education*
then look at the number of initial UI claims filed as a share of each cohort's labor force
as a share of each cohort (Exhibit 1-9), the data Share of Initial UI Claims
shows workers with lower levels of educational 55.3% Filed by Workers with Less
than a Bachelor's Degree
attainment have been experiencing unemploy- from 3/15 to 5/30:
ment at higher rates compared to those with a 76.2 percent
bachelor’s or graduate degree; over 55 percent of
25.1% 25.0%
those in the labor force with a high school diploma 19.3%
(or equivalent) have filed an initial UI claim, that’s 12.1% 5.7%
over four and a half times the share of claims filed
Less HS Associate/ Bachelor’s Graduate All levels
by those with a bachelor’s degree and more than than HS or equiv. Some college of education
ten times the share of claims filed by those with a
* Excludes PUA claims
graduate degree. Source: CA Policy Lab
Going forward, workers with low educational
EXHIBIT 1-10
attainment who lose their jobs during this global
Job Distribution in Southern CA 2018
health crisis will find it much more difficult to find Entry-level education requirements
new ones in similar sectors decimated by the
Master's
secondary economic effects of the pandemic. 1%
PhD/professional
Increasingly a bachelor’s degree is a key driver 2%
and predictor of joblessness, and going forward it Associate
2%
may increasingly determine how many factors, Some college, High school
including health outcomes, play out over a no degree diploma or equiv.
2% 38%
person’s lifetime.
Postsecondary
non-degree award
6%
Education and skills requirements Bachelor's
20%
for growing occupations Less than HS
29%
Another way to illustrate the value in postsecond-
ary education is by looking at occupational
employment grouped together by entry-level Source: BLS, LAEDC
educational requirements.
EXHIBIT 1-11
In Southern California in 2018, approximately EXHIBIT
EXHIBIT 1-11
1-11 Individuals who moved into Southern California from
Individuals
Individuals who
who moved into Southern California from
20 percent of employment exists in occupations outmoved into
of state Southern
or from California
abroad in 2017from
out
out of
of state
state or
or from
from abroad
abroad in
in 2017
2017
having the entry-level education requirement Population 25 years and over by educational attainment
Population
Population 2525 years
years and
and over
over by
by educational
educational attainment
attainment
of a bachelor’s degree and three percent (3%)
require a graduate or professional degree for entry
(Exhibit 1-10).
High school
Looking at the educational attainment of individuals High
High school
school or less
or
or less
less
moving into Southern California reveals that about 57,473
57,473
57,473 Bachelor's
28%
half of those who moved from another state 28%
28%
Bachelor's
Bachelor's or higher
or
or higher
higher
or from abroad to our region have a bachelor’s 105,484
105,484
105,484 50%
degree or higher (Exhibit 1-11). This suggests that 50%
50%
there are significant job prospects for individuals Associate/
Associate/
Associate/ some college
with higher levels of education. some
some college
college 45,982
45,982
45,982 22%
22%
22%
Source: 2018 ACS 1-year estimate
Source: 2018 ACS 1-year estimate
16 Section 1: INTRODUCTIONJobs in occupations with an entry-level education
EXHIBIT 1-12
requirement of a bachelor’s degree or higher are Projected Job Growth by Entry-Level Education
expected to grow at faster rates compared to Percentage change from 2018 to 2023
occupations requiring lower levels of education
for entry (Exhibit 1-12). Master's degree 9.6%
Associate degree 7.7%
Postsecondary non-degree award 7.1%
The projected net change in jobs in Southern PhD/professional degree 7.1%
California between 2018 and 2023 ranked by Bachelor's degree 7.0%
educational requirements, provides insight into High school diploma or equivalent 6.5%
expected hiring trends. Over the five-year Less than high school 6.2%
Some college, no degree 5.3%
period, the number of jobs in occupations requir-
ing a bachelor’s degree, will grow by seven
Total, all levels of education 6.6%
percent (7%), those requiring a master’s degree
Source: LAEDC
will grow by almost 10 percent (the fastest growth
rate), and doctorate and professional degrees
are expected to grow by just over seven percent
(7%).
The Role the California State
Alternatively, jobs requiring lower levels of
education for entry, less than high school, a high University System Plays
school diploma or equivalent and some college
with no degree, are expected to have lower Given the requirements of what is needed for
growth rates between 2018 and 2023. a robust regional economy today, Southern
California needs the full capabilities of all universi-
Higher education ultimately enables greater ties serving the region. Among those higher-
employment opportunities for students, leads to education resources, California State Universities
upskilling amongst incumbent workers, and assists (CSUs) serving Southern California are well
in providing education for career changers. The positioned to provide the kind of education needed
different growth rates across the various levels of for the regional economy of tomorrow; both the
educational attainment illustrate that Southern public and private sector, and across all industries
California’s system of four-year colleges and and fields important for sustainable and equitable
universities, along with the professional and economic growth—from arts to zoology. Each CSU
advanced degree schools they support, will play has a strong link to the region it serves as well as
a more prominent role in satisfying the region’s to other CSUs serving interconnected large urban
labor force needs. regions. An example of this is the CSU55 serving
Los Angeles County. The CSUs are not just
regionally located; they are stewards of place that
have the future of the region embedded in their
mission.
The CSU system was formed in 1960 under the
California Master Plan for Higher Education.
Currently, the CSU system has 23 campuses and
eight off-campus centers, making it the largest
four-year public university system in the U.S.
5
CSU5 includes California State Polytechnic University,
Pomona; CSU Dominguez Hills; CSU Long Beach; CSU
Los Angeles; and CSU Northridge
17 Section 1: INTRODUCTIONThe CSU system is a major player in California’s EXHIBIT 1-13
talent development; 95 percent of enrolled Graduates in California 2017/2018
Four-year colleges and universities
students are California residents, 91 percent of all
new undergraduate transfers are from community
colleges in the state, and 88 percent of first-time
freshmen come from public high schools in
California. Other CSUs
67,136
23%
The CSU system graduates approximately 126,000 Other public
and private
students annually, representing about forty universities
percent of all college graduates in the state of SoCal CSUs 173,787
54,448 59%
California (Exhibit 1-13). 18%
Total Number
The CSU system has a diverse student body, of Graduates:
socioeconomically, demographically (age, race 295,371
and ethnicity) and academically. Of the 23 CSUs in
Source: IPEDS, LAEDC
California, 21 CSUs have at least 25 percent of their
student enrollment reported as Latino.6 Pell grant
recipients account for 43 percent of all under-
graduates in the system. Close to a third of their
students are first-generation college students,
making the system a vital part of economic
mobility in the state.
The CSU system is often considered more respon- EXHIBIT 1-14
Share of Graduates in California by Degree Type 2017/2018
sive to industrial and economic transformations Four-year colleges and universities
when compared to other postsecondary systems
(such as the University of California system). Each
Bachelor's 45,016 55,962 103,823
CSU university has ongoing connections to pro-
fessional practice in the region that allows for a Master’s 9,352 10,914 53,192
dynamic dialog between university preparation 188
and rapidly evolving professional practice. Each PhD/Professional 16,946
CSU university has a significant range of fields, 0% 352
20% 40% 60% 80% 100%
disciplines, centers and institutes that can be ■ SoCal CSUs
engaged in new ways across disciplinary lines. ■ Other CSUs
They also have the ability to make significant ■ Other public and private universities Source: IPEDS, LAEDC
changes in the curriculum, as warranted, to
provide the kind of university education needed
as the region looks to the jobs of the future. For
example, a number of CSU campuses have
created academic programs for nascent and
emerging industries, such as cybersecurity, sus-
tainable business, and environmental technology.
These regionally-focused and globally-connected
universities also have a rapidly growing number
of programs with strong foundations in faculty
and student research, which leads to graduates
well prepared to analyze, investigate, explore new
options, and test the viability of those options. The
CSUs now provide many well-designed opportu-
nities for learning in the classroom and in practice
that includes internships, fieldwork, and the like.
18 Section 1: INTRODUCTIONThe system’s extended post-baccalaureate capacity can be, and often is, used as a co-cre-
education programs are often able to respond ative and agile context for the development and
quickly to shifts and technological changes in implementation of new programs (degree and
industry. These programs are selected and non-degree) that respond to regional needs, which
developed carefully as they are market-driven is important for increasing the responsiveness of
funded and receive no public funding. While their CSU universities to those needs for a university-
market-driven funding model allows for more prepared workforce in changing and cross-
agility in program development, this model also disciplinary fields. It is also important for the
comes with more risk, as these programs will fail ongoing expansion and refinement of compilation
fast if students and employers do not see the of knowledge, skills, abilities, experience and
benefit in enrolling. Taken together, the real-time habits of mind that define each high-value
adaptiveness and “fail fast” quality (as opposed member of a region’s university-prepared work-
to continuing a program long after it loses its force. The ability to add to that compilation in
market value) of these extended education significant ways throughout the career span,
programs make them highly practical and suitable during which field and disciplinary knowledge
for today’s rapidly transforming economy. expands and changes as the economy and
practice shifts, as careers are redirected, and
A number of initiatives have been put in place by as new knowledge and insights are needed in the
the CSU system to raise completion rates and industry or global context, is essential. Indeed,
improve instruction in STEM (science, technology, the ability for universities to provide ongoing
engineering and mathematics) programs. The education in many formats and delivery modes to
Graduation Initiative 2025 was launched in 2016 to degreed (baccalaureate, master’s, or doctorate)
increase completion rates and narrow equity gaps individuals across the career span will be moving
between underserved students and their peers. very soon from useful to essential.
All CSU campuses are now connected by the new
STEM NET affinity group, which enables faculty The CSU system has responded to changing
to share best practices in science, technology, workforce demands by expanding resources for
engineering and mathematics. incumbent workers and working professionals. In
addition to the PaCE program outlined above,
While the CSU is a public university system, the CSU Open University (Open U) program allows
each CSU university also has Professional and anyone to enroll in courses at any of the 23 CSU
Continuing Education (PaCE) colleges that provide campuses without being admitted to the system.
the capacity to create new programs and test new Open U and PaCE are progressive solutions to
ideas outside of the programs funded by state meet workforce demands, upskill workers, and
resources. The PaCE program extends resources provide flexible resources.
related to degree and certificate programs, per-
sonal enrichment, and professional development. As an example of how one CSU university has
PaCE courses are offered online or face-to-face to used this PaCE self-funding innovative capacity
encourage lifelong learning for anyone, from high is California State University Northridge (CSUN)
school students, working professionals, military, to through its Tseng College: Graduate, International,
international students. Having this capacity allows and Midcareer Education. The Tseng College has
for more rapid innovation as well as allows for a been able to engage its faculty within and across
wide range of productive collaboration between disciplinary lines to respond to the dynamics of
economic development initiatives, employers, and the regional economy with nationally recognized
the university across fields and disciplines. This programs with distinctive formats, effective digital
delivery modes in many cases, and high rates
of student success as measured by on-time
graduation rates and the performance of gradu-
ates on national licensure exams required for
some fields of professional practice.
6
These 21 CSU campuses have been recognized by the
Department of Education as Hispanic-Serving Institutions
(HSIs).
19 Section 1: INTRODUCTIONExamples of these programs include: The system also faces a number of challenges.
For example, the CSU system receives so many
i Master’s Degree in Assistive Technologies7
applications that some programs have become
i Master’s Degree in Diverse Community
impacted and require higher standards for admis-
Development Leadership8
sion. This is exacerbated on campuses with local
i Master’s Degree in Music Industry
admission guarantee policies for graduates and by
Administration9
transfers from local high schools and community
i Master’s in Public Health: Community
colleges. The local admission requirements they
Health Education10
face further restricts admission for promising appli-
i Certificate of Advanced Professional
cants who do not live locally. Impacted programs
Development in Leadership in the Age
are likely to intensify with reduced state funding
of Disruption11
and investment. The state general fund covers
slightly more than half the CSU operating costs,
All of these programs are developed and taught
while tuition fees cover the remainder. Therefore,
by CSUN faculty working across disciplinary lines
a decrease in funding will either drive CSUs to cut
with a focus on the changing realities of the urban
costs or increase tuition fees. Concerns over oper-
economy and professional practice in that context.
ating costs could strain faculty, which would have
Each CSU university has a similar capacity that
adverse effects on the student-to-faculty ratio,
can be engaged to leverage university strengths
providing less assistance to enrolled students and
in light of the necessary evolution of the regional
potentially increasing the time it takes to receive
economy and a similar need for the purposeful
a degree. An increase in tuition fees would deter
evolution of higher education, so that the university-
more student from enrollment or impede on their
prepared workforce is indeed ready to be both the
ability to graduate. Higher fees also impede the
foundation and the pathfinders as urban regions
CSU mission of accessibility. Low-income students
collide with local and international shifts that could
and those from non-traditional backgrounds could
easily change the economic realities of the future
be deterred from enrollment or degree completion
for all.
if fees were to rise substantially, without any
increase in financial aid assistance. Potential
Employers and the region’s economic development
funding cuts continue to be a primary concern
leaders will need to learn more about what univer-
for the CSU system, which is dedicated to being
sities can do beyond what is traditionally expected
an affordable and quality provider of higher
and, in turn, engage those capacities in a collabo-
education.
rative and sustained effort leading to a positive
impact on each region’s future. Indeed, a more
active and comprehensive partnership between
regional economic development leaders, employers
and industries, and higher education is no longer … a more active and
optional if those now graduating from universities
are to thrive in the years ahead. Nor is the ability of comprehensive partnership
universities to innovate, not just once but regularly
and at greater speed, optional anymore. between regional economic
development leaders,
employers and industries,
and higher education is no
7
https://tsengcollege.csun.edu/programs/ATE
longer optional.
8
https://tsengcollege.csun.edu/programs/DCDL
9
https://tsengcollege.csun.edu/programs/MIA
10
https://tsengcollege.csun.edu/programs/MPH
11
https://tsengcollege.csun.edu/programs/LAD
20 Section 1: INTRODUCTIONSOUTHERN CALIFORNIA
This section presents a picture of the characteris- EXHIBIT 2-1
Selected Demographic and
tics of Southern California’s resident population, Income Characteristics 2018
accompanied by an overview of the region’s labor
market, including its industrial base and occupa- Southern California Southern
California California
tional composition. versus CA
Population 18,764,814 39,557,045 47.4%
Median age 36.6 36.7 younger
Resident Characteristics Households 5,993,032 13,072,122 45.8%
Average household size 3.08 2.96 larger
Median household income 71,489 75,277 -5.0%
Social and economic characteristics of the resi-
HH below poverty level 12.9% 12.2% -0.7%
dents of Southern California provide context and
Per capita income 33,856 37,124 -8.8%
insight into the strengths and challenges of the
Individuals below poverty 13.2% 12.8% -0.4%
region. Based upon this information, trends and
patterns are revealed and can be used to target Source: 2018 ACS 1 year estimates
education programs and other types of talent de-
velopment efforts.
The population of the Southern California region
in 2018 was 18.8 million in 6.0 million households,
accounting for just under 48 percent of the pop-
ulation of the State of California (Exhibit 2-1). The
median age is 36.6 years.
Median household income in Southern California,
estimated to be $71,489, is approximately 5 per-
cent lower than the state median. At $33,856, per
capita income in the region is 9 percent below the
state average.
21 Section 2: SOUTHERN CALIFORNIAYou can also read