Mapping the Impact of Coal Mines and their Closure: A Case of Betul - THE ENERGY AND RESOURCES INSTITUTE - TERI
←
→
Page content transcription
If your browser does not render page correctly, please read the page content below
Mapping the Impact of Coal
 Mines and their Closure:
     A Case of Betul
                     Ruchi Gupta

                      THE ENERGY AND
                      RESOURCES INSTITUTE
     Creating Innovative Solutions for a Sustainable Future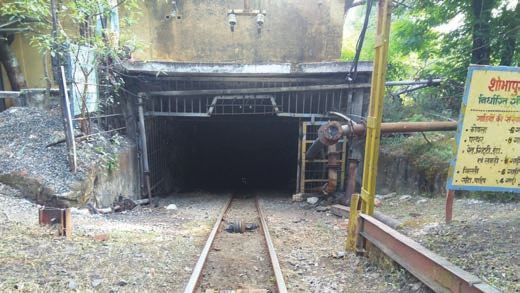
MAPPING THE IMPACT OF
COAL MINES AND THEIR
      CLOSURE
       A CASE OF BETUL

              RUCHI GUPTA
       Electricity and Fuels Division
     The Energy and Resources Institute

                           THE ENERGY AND
                           RESOURCES INSTITUTE
          Creating Innovative Solutions for a Sustainable Future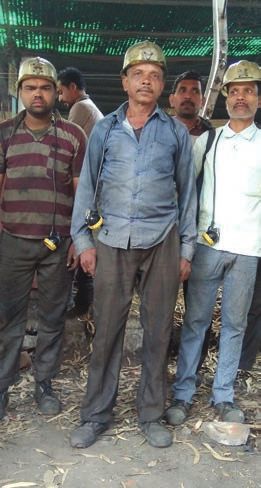
© THE ENERGY AND RESOURCES INSTITUTE 2021

The material in this publication is copyrighted. Content from this Report may be used for non-commercial
purposes, provided is attributed to the source.

Author

Ruchi Gupta, Electricity and Fuels Division, TERI

Advisors

Dr Ajay Mathur, Director General, TERI

Mr Ajay Shankar, Distinguished Fellow, TERI

Mr K Ramanathan, Distinguished Fellow, TERI

Mr Sanjay Mitra, Distinguished Fellow, TERI

Reviewers:

Mr AK Saxena, Senior Fellow & Senior Director, Electricity & Fuels Division, TERI

Mr Amit Kumar, Senior Fellow & Senior Director, Rural Energy and Livelihoods Division, TERI

Mr Girish Sethi, Senior Fellow & Senior Director, Industrial Energy Efficiency Division, TERI

Suggested Format for Citation

Gupta, Ruchi. 2021. Mapping the Impact of Coal Mines and their Closure: A Case of Betul. New Delhi: The
Energy and Resources Institute

Editorial and Design Team

Ms Ipshita Mitra, Ms Sushmita Ghosh, Mr Rajiv Sharma, Mr Santosh Gautam and Mr Vijay Nipane

Published by

The Energy and Resources Institute, New Delhi, India

For more information

Project Monitoring Cell

The Energy and Resources Institute, Darbari Seth Block, IHC Complex, Lodhi Road, New Delhi 110003, India

Tel: +91 11 2468 2100 | Fax: +91 11 2468 2144 | Email: pmc@teri.res.in | Web: www.teriin.org
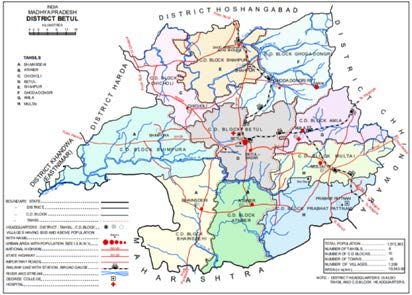
TABLE OF CONTENTS
Acknowledgements.................................................................................................................................. ix
Abbreviations........................................................................................................................................... xi
About the Research................................................................................................................................. xiii
Executive Summary...................................................................................................................................xv
1.    An Overview of the Energy Industry.................................................................................................. 1
     1.1 Locating Pathakhera Coalfield in Betul ........................................................................................ 1
			            1.1.1 Brief History ................................................................................................................. 1
     1.2 Demand for Coal by Satpura Thermal Power Station......................................................................3
     1.3 Coal Production and Supply from Pathakhera ..............................................................................4
			            1.3.1 Supply to STPS .............................................................................................................4
			            1.3.2 Supply to Non-core Sectors ........................................................................................... 5
     1.4 Mine Closure and Proposal for New Mines ...................................................................................6
			            1.4.1 WCL’s Justification for New Mines in Pathakhera .............................................................6
			            1.4.2 People’s Demand for New Mines in Pathakhera..............................................................8
2. Coal’s Interaction with Betul’s Economy ................................................................................................9
     2.1 An Overview of the District’s Economy ........................................................................................9
     2.2 Coal’s Role..................................................................................................................................9
     2.3 Employment Scenario in the District ..........................................................................................11
			            2.3.1 Workforce Composition................................................................................................11
			            2.3.2 The ‘Main’ Workers..................................................................................................... 12
			            2.3.3 Average Daily Employment in the District..................................................................... 12
     2.4 Manufacturing in the District .................................................................................................... 13
			            2.4.1 Major Commodities .....................................................................................................13
			            2.4.2 Micro, Small, and Medium Enterprises ....................................................................... 14
     2.5 Coal’s Influence on the Development Pattern .............................................................................17
			            2.5.1 Comparison of Coal Tahsil with Other Tahsils................................................................ 18
			            2.5.2 Coal and Electricity Consumption................................................................................ 22
			            2.5.3 Transport, Trade Around Coal ..................................................................................... 23
     2.6 Coal and its Proceeds ............................................................................................................... 25
			            2.6.1 Revenue Source for District and Local Municipal Body.................................................. 26
			            2.6.2 Corporate Social Responsibility Expenditure ...............................................................28
			            2.6.3 Worker Compensation ................................................................................................ 29
     2.7 Impact of the Incomes from Mining on Final Demand for Goods and Services .............................30
     2.8 Coal’s Influence on the Workforce Composition and Income Distribution in the Region ...............32
     2.9 Discussion ............................................................................................................................... 35
3. Overview of Employment in the Energy Industry................................................................................... 37
     3.1 Coal Mining............................................................................................................................... 37
3.1.1 Brief Background of the Coal Mine Employment in Pathakhera....................................... 37
		        3.1.2 Impact of Mass Recruitment of the Early Years on Mass Retirements Today..................... 38
		        3.1.3 Drivers to the Shift in Recruitment ............................................................................... 39
		        3.1.4 The Declining Regular Workforce................................................................................. 41
  3.2 Employment in Satpura Thermal Power Station ......................................................................... 41
  3.3 The Social Composition of the Workforce ................................................................................... 42
  3.4 The Reservation Policy and Its Implication................................................................................. 44
  3.5 The Industry Defined Socio-political Milieu................................................................................46
  3.6 Emergence of Informality.......................................................................................................... 47
  3.7 Formal Provisions for the Informal Workers and their Governance............................................... 49
		 3.7.1 Disparity in Entitlements and Working Conditions......................................................... 50
		        3.7.2 Missing Social Context of Decent Work for the Contract Worker...................................... 50
		        3.7.3 Implications of Informality on the Economy...................................................................51
  3.8 The Labour Market Around Coal................................................................................................. 51
  3.9 Hearing First-hand from the Youth, the Front runners of Transition............................................. 54
  3.10 Rising Undercurrents and the Political Demand for More Mines................................................ 54
  3.11 Discussion............................................................................................................................... 57

4. Agrarian Landscape: Understanding the Economy Beyond Coal............................................................ 59
     4.1 Pandemic and the Returnees..................................................................................................... 59
     4.2 The Stress on Agriculture.......................................................................................................... 59
     4.3 Understanding the District’s Agriculture (not Including Fisheries)..............................................60
		           4.3.1 Change in Farmers’ Composition.................................................................................60
		           4.3.2 Changing Cropping Pattern.........................................................................................60
		           4.3.3 Fodder....................................................................................................................... 62
		           4.3.4 Irrigation................................................................................................................... 63
		           4.3.5 Emerging Issues of Groundwater................................................................................. 63
     4.4 Linkages Between the Energy Industry and Agriculture.............................................................. 63
		 4.4.1 Villages Under Active Mining.......................................................................................64
		           4.4.2 Villages in the Vicinity of Mining and Power Plant........................................................64
		           4.4.3 Village Proposed for Mining........................................................................................66
     4.5 Discussion................................................................................................................................ 67

5. Conclusion ..........................................................................................................................................69
6. Way Forward....................................................................................................................................... 73
LIST OF FIGURES
Figure 1: Chronology of the power plant and mine development.................................................................. 2
Figure 2: Phase-wise coal consumption at STPS.......................................................................................... 3
Figure 3: Coal demand of STPS................................................................................................................... 4
Figure 4: Coal production from 1973–2019, Pathakhera Coalfield................................................................. 4
Figure 5: Coal supply for STPS from Pathakhera Coalfield............................................................................. 5
Figure 6: Transport mode for coal supply to STPS from Pathakhera Coalfield................................................ 6
Figure 7: Percentage of coal auction to total production, Pathakhera Coalfield............................................. 6
Figure 8: Sectoral composition of Betul’s economy...................................................................................... 9
Figure 9: Gross value added at constant (11–12) prices by primary sector................................................... 10
Figure 10: Gross value added at constant (11–12) prices by secondary sector............................................. 10
Figure 11: Gross value added at constant (11–12) prices by tertiary sector................................................... 10
Figure 12: Betul’s rank in the overall district on per capita income..............................................................11
Figure 13: Changing workforce composition...............................................................................................11
Figure 14: Composition of the main workforce........................................................................................... 12
Figure 15: Sector-wise units registered, 2011–12........................................................................................ 12
Figure 16: Sector-wise average daily employment, 2011–12........................................................................13
Figure 17: Nature and size of MSME establishments.................................................................................. 14
Figure 18: Employment across various MSMEs...........................................................................................15
Figure 19: Tahsil-wise distribution of MSMEs..............................................................................................15
Figure 20: Administrative map of Betul......................................................................................................17
Figure 21: Growth of key towns in the district............................................................................................ 18
Figure 22: Tahsil-wise road density, 2012–13............................................................................................ 19
Figure 23: Tahsil-wise households with piped sewerage............................................................................ 20
Figure 24:Tahsil-wise households with septic tanks.................................................................................. 20
Figure 25:Tahsil-wise households without any kind of drainage facility...................................................... 21
Figure 26: Tahsil-wise households with treated tap water.......................................................................... 21
Figure 27: Tahsil-wise percentage of households availing banking services................................................ 22
Figure 28: Sector-wise electricity consumption in the district..................................................................... 22
Figure 29: Generation and utilisation of fly ash, STPS................................................................................ 24
Figure 30: Fly ash consumption for various purposes, STPS....................................................................... 25
Figure 31: Composition of coal proceeds from Pathakhera Coalfield........................................................... 25
Figure 32: Share of royalty in the non-tax revenue of the district, 2012–13.................................................. 26
Figure 33: Share of property tax from energy industry, Sarni Municipal Council, 2018–19............................ 27

                                                                      | v |
MAPPING THE IMPACT OF COAL MINES AND THEIR CLOSURE

Figure 34: Annual income of the municipal bodies in the district............................................................... 27
Figure 35: Annual incomes of nagar panchayats in the district................................................................... 28
Figure 36: Property tax demand, Sarni Nagar Palika.................................................................................. 28
Figure 37: Tahsil-wise household ownership of two wheelers..................................................................... 30
Figure 38: Tahsil-wise households with mobile phones..............................................................................31
Figure 39: Tahsil-wise households with laptop/computer...........................................................................31
Figure 40: Tahsil-wise households without assets..................................................................................... 32
Figure 41: Tahsil-wise composition of ‘main’ workers................................................................................. 32
Figure 42: Modes of income, urban households........................................................................................ 33
Figure 43: Modes of income, rural households.......................................................................................... 33
Figure 44: Salaried job distribution, rural households............................................................................... 34
Figure 45: Monthly income of the highest earning household member (rural)............................................. 34
Figure 46: Retirement trend at Pathakhera Coalfield.................................................................................. 38
Figure 47: Age profile of the Pathakhera Coalfield workforce, December 2019............................................ 39
Figure 48: All India trend of coal production and average daily employment in underground and
opencast mining...................................................................................................................................... 39
Figure 49: Recruitment of miners under various categories, 2015–19..........................................................41
Figure 50: Declining workforce in the coalfield, 1992–19............................................................................41
Figure 51: Declining workforce at STPS...................................................................................................... 42
Figure 53: Employee distribution across various grades in the energy industry........................................... 43
Figure 52: Retirement at STPS, 2009–19................................................................................................... 43
Figure 54: Scheduled castes composition across the industry wards.......................................................... 44
Figure 55: SCs, STs and OBCs representation in Coal India Limited, 2013–14.............................................. 45
Figure 56: Distribution of Scheduled Castes across urban towns, Betul...................................................... 47
Figure 57: Trend of average daily employment in mines and regular workforce, Pathakhera Coalfield.......... 48
Figure 58: Social composition of workers undergoing training at VTC, Pathakhera...................................... 52
Figure 59: Urban illiteracy rate, Betul........................................................................................................ 52
Figure 60: Rural illiteracy rate, Betul......................................................................................................... 53
Figure 61: Education level (rural) across tahsils, Betul............................................................................... 53
Figure 62: Reported crime (select) in Sarni subdivision, 2008–18.............................................................. 56
Figure 63: Referral cases from area hospital, Pathakhera Coalfield............................................................. 57
Figure 64: Landholding of farmers, Betul...................................................................................................60
Figure 65: Declining milch livestock, Betul................................................................................................ 62
Figure 66: Irrigation sources, Betul........................................................................................................... 63

                                                                         | vi |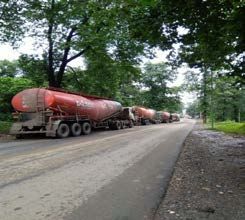
LIST OF TABLES
Table 1: WCL’s projection for coal production.............................................................................................. 7
Table 2: Production details of the proposed new mines...............................................................................8
Table 3: Key activities under CSR, 2016–19................................................................................................ 29
Table 4: Directives for reservation in recruitment and promotion................................................................ 44
Table 5: Representation of SCs, STs, and OBCs in Pathakhera Coalfield, 2020........................................... 46
Table 6: Assembly constituencies in Betul ................................................................................................ 46
Table 7: Wages of contract workers under Xth Wage Agreement.................................................................. 49
Table 8: Changing composition of cultivators in Betul over two Census periods.......................................... 59
Table 9: Percentage area under each crop................................................................................................. 61

LIST OF BOXES
Box 1: Coal mining from 2000-20: Viewpoint of a garment seller................................................................ 16
Box 2: Diversification : Pawar’s survival strategy....................................................................................... 16
Box 3: Vanishing coal : a tea seller’s woe.................................................................................................. 16
Box 4: Details from village on mining and its impact as experienced.......................................................... 65
Box 5: Non-Timber Forest Produce............................................................................................................. 67

LIST OF PICTURES
Picture 1: Fly ash dumpers waiting at the STPS.......................................................................................... 23
Picture 2: Coal trucks dot the road between Sarni and Pathakhera............................................................. 24
Picture 3: Called the Shaheed Stambh (Martyrs Memorial), in memory of those workers who died in an
accident in Satpura 1 mine in 1986........................................................................................................... 37
Picture 4: Ruins of the historic chakka/wheel, Shobhapur Mine................................................................. 38
Picture 5: Miners await the man riding system, Shobhapur Mine............................................................... 42
Picture 6: Youth in discussion.................................................................................................................. 54
Picture 7: Discussion Snippets................................................................................................................. 55
Picture 8: With panchayat representatives and teachers, village Shobhapur.............................................. 64
Picture 9: Mapping the change................................................................................................................. 65
Picture 10: Discussion with the community of a downstream village, Salaiya..............................................66

                                                                      | vii |
MAPPING THE IMPACT OF COAL MINES AND THEIR CLOSURE

                       | viii |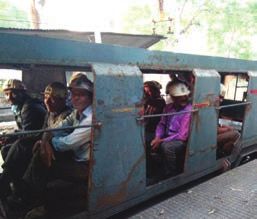
ACKNOWLEDGEMENTS
A research study of this kind would not have been possible without the help of a great number of individuals
from various places who offered their time, assistance, and information. I gratefully acknowledge
Mr Vidyasagar Giri from the All India Trade Union Congress (AITUC) for helping identify Betul as a potential area
for understanding the impact of coal mine closure.

Dr Tejaswi S Naik, then District Magistrate of Betul, and the district administration led by him supported the
field visits, interactions and datasets that were integral to this report. Sincere thanks to Ms Harsimranpreet
Kaur and Mr Shashank Shukla for their active involvement.

I thank Mr Dhananjay Kumar of Western Coalfields Limited, Mr PK Choudhary and his entire team at Pathakhera
for welcoming me. This study was made possible by the numerous interactions they facilitated, and the
estimates and data they shared. I acknowledge Mr VK Kailasia of Satpura Thermal Power Station too, for
making data available.

I would like to thank all five central trade unions at Pathakhera for their rich inputs and discussions. A special
mention of Mr Ashok Namdeo of Koyla Shramik Sabha and Mr Ashok Malviya of Bharatiya Koyala Khadan
Mazdoor Sangh for their continued support. Deep gratitude to all the workers and communities who shared
their experience with me, which I hold as invaluable.

This acknowledgment does not imply in any way these individuals’ concordance with the content of the report,
the usual disclaimers apply.

Within TERI, motivation, and guidance at critical stages of the study was given by Dr Ajay Mathur, Director
General of TERI; continuous guidance and inputs by Mr AK Saxena, Senior Director of the Electricity and
Fuels Division helped shape the study as he painstakingly went through various drafts. Review from Mr Amit
Kumar, Senior Director of Social Transformation and regular comments from Mr Ajay Shankar, Distinguished
Fellow; Mr K Ramanathan, Distinguished Fellow; Mr Sanjay Mitra, Distinguished Fellow; Mr Girish Sethi, Senior
Director, Energy; Mr Thomas Spencer, Fellow and Dr Gopal Sarangi, Associate Professor, TERI SAS, immensely
benefitted the report. Technical support on data handling by Mr Shubham Thakre and Mr Rishabh Sethi are
greatly acknowledged. Finally, sincere thanks to all colleagues at TERI, particularly TERI Press for their support.

                                                      | ix |
MAPPING THE IMPACT OF COAL MINES AND THEIR CLOSURE
| x |ABBREVIATIONS
AITUC All India Trade Union Congress
BHEL Bharat Heavy Electricals Limited
BMS Bharatiya Mazdoor Sangh
BT Billion Tonne
CAGR Compound Annual Growth Rate
CIL Coal India Limited
CITU Centre of Indian Trade Unions
CLIP Contract Labour Information Portal
CMPDI Central Mine Planning and Design Institute
CMPF Coal Mines Provident Fund
COVID-19 Corona Virus Disease of 2019
CPSU Central Public Sector Undertaking
CSR Corporate Social Responsibility
DGMS Directorate General of Mines Safety
DIC District Industries Centre
DMF District Mineral Fund
EMS Earnings per Manshift
GCV Gross Calorific Value
GDP Gross Domestic Product
GST Goods and Services Tax
GVA Gross Value Added
HMS Hind Mazdoor Sabha
HPC High Powered Committee
INR Indian Rupee
INTUC Indian National Trade Union Congress
IRR Internal Rate of Return
ITI Industrial Training Institute
JBCCI Joint Bipartite Committee for the Coal Industry
LMT Lakh Metric Tonne
PM-KUSUM Pradhan Mantri Kisan Urja Suraksha evam Utthaan Mahabhiyan
MGNREGA Mahatma Gandhi National Rural Employment Guarantee Act
MP Madhya Pradesh
MPGATSVA Madhya Pradesh Gramin Avsanrachna Tatha Sadak Vikas Adhiniyam (MP Rural
and Road Development Act)
MPMKVVCL Madhya Pradesh Madhya Kshetra Vidyut Vitaran Company Limited
MPPGCL Madhya Pradesh Power Generating Company Limited
MSME Micro Small and Medium Enterprises
MSP Minimum Support Price
MT Million Tonne
MTPA Million Tonne Per Annum
MW Megawatt
NCDC National Coal Development Corporation
NMET National Mineral Exploration Trust
NRLM National Rural Livelihood Mission
NSA Net Sown Area
| xi |MAPPING THE IMPACT OF COAL MINES AND THEIR CLOSURE
NTFP Non-timber Forest Products
OBC Other Backward Classes
OC Open Cast
PF Provident Fund
PH Phase
PLF Plant Load Factor
PME Premedical Examination
PSU Public Sector Undertaking
RW Regional Workshop
SC Scheduled Castes
SECL South Eastern Coalfields Limited
ST Scheduled Tribes
STEM Science, Technology, Engineering, and Mathematics
STPS Satpura Thermal Power Station
TERI The Energy and Resources Institute
UG Underground
UHV Useful Heat Value
VRS Voluntary Retirement Scheme
VTC Vocational Training Centre
WCL Western Coalfields Limited
| xii |ABOUT THE RESEARCH
This research is a deep dive into Betul, a southern district of Madhya Pradesh where coal mining has a history
of a hundred and fifty years. Four mines out of ten closed due to mineral exhaustion, in quick succession. The
fourth mine closed in 2013; two more are slated to close by March 2021.
The research has attempted to stitch together various socio-politico-economic linkages that were established
around coal, and consequences of its closure. The energy industry (coal mining and thermal power plant)
became central to the district. Coal, that once offered prosperity, seemed eternal. That mines will close, was
known; but even today there is little preparedness to deal with the change. The closures have had ripple
effects on the place. Sarni, the coal town, witnessed de-population, trade and businesses either slowed or
moved away. Jobs that were induced by the incomes generated from the energy industry and spent locally,
dwindled.
If transition to a low carbon pathway is to take place and for it to be just, it is important to map each of those
affected either by mining or by its decline, and their concerns and aspirations. Dialogue with them will be
the starting point to any transition. Given the limited geographical coverage, Betul may be considered a local
case study. But the results of the study are illustrative of the challenges faced by other mining districts in the
country. Most of these challenges have been exacerbated now by the COVID-19 pandemic.
The research reached out to diverse groups of stakeholders to understand their experience of mining and its
decline.
District Administration
District Magistrate, Superintendent of Police, District Forest Officer (North), District Mining Officer, District
Planning Officer, District Industries Officer, Sub Divisional Magistrate (Shahpur), Tahsildar, Chief Municipal
Officer (Sarni Nagar Palika)
South East Central Railway
Divisional Railway Manager (Nagpur)
Energy Industry
Pathakhera Coalfields: Area General Manager, Area Personnel Manager, Area Sales Manager, Area Finance
Manager, Area Planning Officer, Chief Medical Officer, Senior Mine Manager
Satpura Thermal Power Station: Chief Engineer
Workers
Regular workers, contract workers
Union
Laal Jhanda Coal Mines Union (affiliated to CITU), All India Khadaan Mazdoor Sangh (affiliated to AITUC), Koyla
Shramik Sabha (affiliated to HMS), Bhartiya Koyala Khadan Mazdoor Sangh (affiliated to BMS), Rashtriya
Koyala Khadaan Mazdoor Sangh (affiliated to INTUC)
| xiii |Community
People and their representatives from upstream and downstream villages of Shobhapur, Chhattarpur (II),
Pandhra, Sillaiya, Sukhadhana, Shaktigarh, Mordongri, Bakud, Belond
Convenor of Udyog Bachao Nagar Bachao Samiti
Business
Kalimai Vyaapari Sangh, Kalimai Truck Owners Association, Mining Contractors, Traders and shopkeepers in
Pathakhera
| xiv |EXECUTIVE SUMMARY
Chapter one ‘an overview of the energy industry’, describes a brief history of Pathakhera mines from 1867
when coal from here was shipped to Bombay to fuel the steamships, to 1963 when these mines operated
under National Coal Development Corporation and served as captive to the Satpura Thermal Power Station.
In 1973 Western Coalfields Limited (WCL), a subsidiary of Coal India Limited took over the mine. This chapter
maps the commissioning of various units of Satpura power plant and the corresponding opening of mines.
Pathakhera held a significant place as captive to the power plant, till it catered to all the units in Phase I. After
these units were de commissioned, it catered to a single unit in Phase II. While the power plant meets its coal
requirements for Phase II and III from mines under WCL, it procures coal from South Eastern Coalfield Limited for
Phase IV.
Pathakhera was appreciated for its geographical proximity and supply of coal through road transport and
conveyor belt. When newer mines opened in 1992–2003, Pathakhera recorded its peak production in 2006.
Gradually with the decline in coal resource and the closure of four mines, the industry and the region slumped
into a phase of decline.
WCL has approved the opening of two new mines at Pathakhera, predominantly to meet the coal demand of
the power plant as well as to meet its 75 MT of production target by 2023–24. But the proposed mines await
clearance from the Ministry of Environment, Forest and Climate Change. With two more mines (Shobhapur and
Sarni) slated to close by March 2021, the coal transporters, traders and workers unions in the district’s coal
region have demand for new mines.
Chapter two, ‘coal’s interaction with Betul’s economy’, shows that the district’s economy is intricately linked
to its natural resource base. The primary sector constitutes 40% of the district’s gross domestic product. The
nature of coal’s embeddedness in its economy is understood in the period following the mine closure, when
there was a fall in the value added by mining in the district’s gross domestic product and a simultaneous fall
was recorded in all the components of the secondary sector, and that of ‘trade, repair, hotels and restaurants’
and ‘financials’ in the tertiary sector.
In the overall per capita income ranking of the State, Betul’s ranking fell from 18 in 2011–12 to 36 in 2015–16.
The impoverishment of the district is also reflected from the continuous decline in the share of its ‘main’
workforce, and an increasing share of the ‘marginal’ workers. The bulk of the ‘main’ workforce is agricultural
labour followed by cultivators.
On analysing the average daily employment in the district, it is evident that the State followed by mining
provide for the highest employment opportunity. Pathakhera Coalfield and Satpura Thermal Power Station
were the only large industries in the district. The emergence of Sarni town makes it evident that coal has
been the driving force in the district’s development. Sarni is the only town to have come up after the district
headquarters (also called Betul town) till today. In 1991 and in 2001, Sarni’s population was higher than Betul
town. As coal declined, Sarni also increasingly witnessed depopulation. Sarni’s population fell from 95,000 in
2001 to 86,000 in 2011. Most of the retired employees and others chose to move out as they saw no future for
themselves or for their children in the place. As a result businesses, trade and commerce declined in general
in Sarni.
| xv |MAPPING THE IMPACT OF COAL MINES AND THEIR CLOSURE
The energy industry emerged as a strong player in the region has been evident from the skewed distribution
of infrastructure at the level of the tahsil (between Betul tahsil1 and Ghodadongri tahsil where the industry is
located). The concentration is also seen at the level of households where resources are tilted in favour of the
urban households in Ghodadongri.
Coal forms the fiscal base of the district’s economy as royalty (on coal) alone accounts for 33% of the district’s
non-tax revenue. In addition to royalty, the district also benefits from receipts under the District Mineral Fund,
MPGATSAVA2, Transit fee levied on coal. The Sarni nagar palika (municipal body) carved to serve the industrial
wards and those around it, receive 74% of their revenue from the coalfield and power plant.
Chapter three provides an ‘overview of employment in the energy industry’. It describes the change in the
recruitment practice over the years in the coalfield and its implications. Earlier there were mass recruitment
drives and the region saw an influx of workers to take up job as miners. There were no criteria for educational
qualification and anyone who cleared a physical endurance test, was selected. The last such drive was in
1984.
However, new recruitments are restricted to statutory positions and to compensatory positions (employment
given to next of kin in case of death of employee while in service, or in case of disability of the employee; to
those who lose land under the ‘project affected persons’). The region now sees massive retirements every
year, both in the coalfield and in the power plant. By 2030, 46% of the coalfield’s workforce strength of 2019
is expected to retire.
For any discussion on transition, it is important to understand the workforce composition of the industry- the
nature of jobs (whether formal or informal), their social and educational status and their ability to respond
to change. The bulk of the workers in both coalfield and power plant are non-executives. Particularly in the
coalfield, 93% of its workers are engaged in Group C&D. The social composition of the workforce was also to
an extent influenced by caste. A large section of the workers have limited upward mobility in employment and
carry the burden of being socially disadvantaged. Sarni, now forms a part of the Scheduled Castes reserved
assembly constituency in the district.
The decline in regular workforce is compensated by a new force of informal, contract workers. The region
foresees an increase in informal workers so long as the industry continues, and retirements take place.
Contracting is not a new phenomenon, but its implications need to be understood. While it addresses the
revenue and production target of the industry and brings down the cost; it also brings with it practices that
increase inequality and marginalization of the growing number of contract workers. Though the industry
insists on fair treatment of contract workers, the compliances rests with the contractor.
The disparity in entitlements and working conditions between the regular and the informal workforce translates
to extreme socio-economic inequality in the region. The informal worker gets trapped in a cycle of poverty and
this race to the bottom will damage the labour market of the future.
Lately, employment in the industry for the locals have been largely limited to compensatory employment
(under project affected persons) or in the informal and temporary jobs. Coal mines are in rural areas where
agriculture continues to be the mainstay. With decline in agricultural returns and for lack of better alternatives,
the youth take up informal job in the mines or else is left with the option to migrate out. This research does not
support opening of new mines or promoting employment in mines. All it has done is to attract the attention of
stakeholders to the growing informal workforce in the coal mines.
1 Each state in India is divided into districts. Each district is further divided into sub-districts kn own differently in different parts in the country (e.g., tahsil,
taluka, community development [CD] block, mandal, etc.).
2 Madhya Pradesh Gramin Avsanrachna Tatha Sadak Vikas Adhiniyam (MP Rural and Road Development Act)
| xvi |MAPPING THE IMPACT OF COAL MINES AND THEIR CLOSURE
Chapter four on ‘agrarian landscape: understanding the economy beyond coal’, looks at some of the key
factors in the growing share of agricultural labour. The rural community of farmers and farmer turned miners
have been experiencing marginalization. The declining share of large and medium farmers and an increasing
share of small and marginal farmers in the region explain largely the growing numbers seeking work as casual
labour in the mines or as agricultural labour. In the district, rural Ghodadongri (where energy industry is
located) has the highest percentage of households engaged in manual casual labour (60%) and the least
percentage of households in agriculture (28%) across the district.
Shift from food crops to cash crops (e.g. the traditional millets kodo kutki, now replaced by sugarcane and
soyabean) has had a direct bearing on the water table in the region. Exacerbated by mining, there is now
limited water availability. The district and the industry (through its corporate social responsibility) have been
faced with the demand of meeting the needs of irrigation infrastructure of the place.
This section also takes through the impact of the energy industry on the agricultural productivity and practices
in the villages in its vicinity. While the villages benefitted from the infrastructure built by the industry,
particularly roads, the township provided a ready market for their produce. The upstream community however
suffered from fly ash and coal dust that destroyed the produce and the productivity, depleted ground water
aquifers, polluted streams, cracks and subsidence on landscapes. Increased competition for water and land,
eventually driving the rural agrarian community (who also are the indigenous Gonds), to the margins.
The research has tried to bring out the ramifications of mining and its closure. Besides the environmental and
health impact of mining, it severely impacted the lives and livelihood of the indigenous community. Closure
of mines brought about a complex situation. De-population of Sarni, its inability to prepare a Master Plan,
rise in police interventions (reported crimes), increasing cases of mental health and stress reported amongst
employees in the area hospital of the coalfield, formation of forums such as ‘udyog bachao nagar bachao’
demanding opening of new mines and setting new units of power plant, are some of the challenges that the
region now faces. Moving away from coal does not find a place in the political manifesto of any political party
in the region, nor any mention in the local media.
The way forward suggests tailor made approach for the district that focuses on rural incomes and enhancing
opportunities that reduces vulnerabilities. The identified local priorities emphasised on strengthening
agriculture and on education and skill building. The study suggests convergence of efforts of the state
and the public sector undertaking; and Mapping the impact of coal mines and their closure 10 mobilising
financial resources, (particularly receipts from coal realised under the DMF, MPGATSVA, CSR and transit fee) to
additionally fund works for the affected communities.
| xvii |MAPPING THE IMPACT OF COAL MINES AND THEIR CLOSURE
| xviii |1 An Overview of the
Energy Industry
1.1 Locating Pathakhera Coalfield in Betul
The Pathakhera Coalfield comes under the Western Coalfields Limited (WCL), a subsidiary of Coal India Limited
(CIL). The WCL is headquartered in Nagpur, Maharashtra, and has three operational areas in Madhya Pradesh
(MP)-Pathakhera-Kanhan-Pench. The entire area spreads across the Betul and Chhindwara districts of MP.
Pathakhera forms the western-most part of this belt and lies in the Betul district. This coalfield holds a premier
position in India for having a considerable share of reserves of thermal grades of non-coking coal.1 Pathakhera
lies in the Satpura Melghat forest, a rich forestland and wildlife corridor. Mines in the region are underground
(depending on the depth of feasible coal seams).
1.1.1 Brief History
The centrality that coal occupies in the Pathakhera region can be traced to 1867 when seams of good quality
coal of 3 m thickness were explored and coal reserves were estimated at 150 lakh tonnes. The first mine in the
region was leased to an Englishman in 1934 and coal was sent to Bombay to fuel the steamships. However,
after a period of time, mining was discontinued as seams of sandstone were struck, giving the region its name
‘Pathakhera’.2
In 1963, the mines were re-opened by the National Coal Development Corporation (NCDC) to serve as captive
to the Satpura Thermal Power Plant. After the Coal Mines Nationalisation Act of 1973, Pathakhera was brought
under the Western Coalfields Limited (WCL), a subsidiary of Coal India Limited (CIL).
Pathakhera mines developed as captive to the pithead Satpura Thermal Power Station (STPS) of MP Power
Generating Company Limited (MPPGCL) at Sarni,3 is at a distance of 5 km. The STPS was the biggest power
project in the state when completed in 1967, with financial aid from US Agency for International Development.
In 1967, five units (Unit I to Unit V) of 62.5 MW each were commissioned at the STPS. The period 1969–1975 saw
continuous opening of five mines to meet the requirement of coal-fired electricity generation. These mines are
Pathakhera I (opened in 1969), Pathakhera II (1971), Satpura I (1972), Satpura II (1973) and Shobhapur (1975).
From a capacity of 312.5 MW in 1967 (five units of 62.5 MW each) based on imported electrical equipment
from USA, the power plant enhanced its capacity subsequently to 1142.5 MW with indigenously made turbo
generator set and boilers by Bharat Heavy Electricals Limited (BHEL). Between 1979 and 1984, four additional
units (Unit 6,7,8 and 9) at STPS were commissioned, which increased the capacity by 830 MW (200+210*3
1 Source: CMPDI. 2015. Report on land use/vegetation cover mapping of Pench-Kanhan-Tawa Valley Coalfield based on satellite data for the year 2014,
Ranchi
2 WCL Documentary on Pathakhera
3 CMPDIL, Environment Department. 2011. Executive Summary for Environmental Impact Assessment and Environmental Management Plan for Public
Hearing as per EIA Notification, 2006, TAWA, Pathakhera Area, WCL
| 1 |MAPPING THE IMPACT OF COAL MINES AND THEIR CLOSURE
units). This also coincides with the period when the country experienced oil shocks ( of 1973–74, 1978–79,
1980–81) and the Fuel Policy Committee identified coal as the primary source of commercial energy.4
Sarni mines were opened in 1979 and because of the continuous growing demand for coal in the power plant,
four more mines began operations, namely, Tawa I (1992), Chhattarpur I (1992), Chhattarpur II (1992), and
Tawa II (2003).
While the first five units of 62.5 MW were decommissioned (had completed their service life and were
subsequently dismantled), between 2012 and 2014, two new units–Unit 10 and Unit 11, of 250 MW each, were
commissioned in the same period. A pictorial depiction of the details is given in Figure 1. Currently, the total
installed generating capacity at STPS is 1330 MW, comprising 1x200 MW, 2x210 MW, and 2x250 MW.
Figure 1: Chronology of the power plant and mine development
Note: Figures outside the mine indicate reserves in the mines as of 2010
The power evacuation infrastructure for the STPS comprises the following high-voltage AC transmission lines:5
4 History of Coal India Limited: Factors which led to the Nationalisation of Coal Industry in India. Details available at https://www.coalindia.in/en-us/
company/history.aspx
5 Madhya Pradesh Power Generating Company Limited. Details available at http://www.mppgcl.mp.gov.in/stps-sarni.html
| 2 |MAPPING THE IMPACT OF COAL MINES AND THEIR CLOSURE
Power evacuation 400 kv lines STP: Itarsi/Indore
STP: Koradi/Bhilai
220 kv lines STP: Itarsi (4)
STP: Kalmeshwar (1)
1.2 Demand for Coal by Satpura Thermal Power Station
Coal requirements for STPS till recently were met entirely by WCL. Till 2014, the annual allocation of coal from
WCL was 6.6 MT for the older units (PH-I, PH-II, PH-III) and 1.9 MT for the new units in PH-IV.
3
2.5
2
In MT
1.5
1
0.5
0
2011-12 2012-13 2013-14 2014-15 2015-16 2016-17 2017-18 2018-19
PH-I PH-II (units 6&7) PH-III (units 8&9) PH-IV (units 10&11)
Figure 2: Phase-wise coal consumption at STPS
Source: Office of the Chief Engineer, STPS
Pathakhera held a significant place as captive to STPS till it catered to all five units of PH-I. According to
officials of STPS, since the decommissioning of five units, Pathakhera’s coal is now used for Unit 6 of PH-II. For
units 7,8 and 9, coal supply is met from WCL’s Pench Kanhan, Ballarpur, Wani, Mauri, and Nagpur fields. South
Eastern Coalfields Limited (SECL) meets the coal requirement of PH-IV.
Coal consumption by STPS reached its nadir during 2016–17. During this time, all the units at STPS were kept
in reserve shutdown. Low demand and power purchase agreement with private producers forced the state
government to pay the private players even when the purchased power was not in use. This caused the state-
owned thermal units to be kept in reserve shutdown.6
Figure 3 summarises the coal quantity purchased and consumed by STPS.
Officials point that the decision to close the four units 6, 7, 8 and 9 by 2021–22, is in the pipeline and that a
non-pit head, super critical plant of 660 MW, by 2026–27 is underway. The STPS had once witnessed a period
when each unit of 62.5 MW consumed 5 lakh tonne of coal. Today, technological changes and automation
have improved energy efficiency. Now, a single new unit can replace the older ones and stricter emissions
reduction norms affect the demand for coal too.
6
Details available at https://timesofindia.indiatimes.com/city/bhopal/mp-power-generation-by-state-owned-units-just-40-of-capacity/
articleshow/57819318.cms
| 3 |MAPPING THE IMPACT OF COAL MINES AND THEIR CLOSURE
5.83
5.73
5.72
5.54
5.52
5.43
5.27
5.24
5.23
5.07
4.94
4.53
3.57
3.49
IN MT
2.68
2.24
2011-12 2012-13 2013-14 2014-15 2015-16 2016-17 2017-18 2018-19
Coal Quantity Purchased Coal Consumption
Figure 3: Coal demand of STPS
Source: Office of the Chief Engineer, STPS, Sarni
1.3 Coal Production and Supply from Pathakhera
1.3.1 Supply to STPS
Pathakhera is the only coalfield that supplies coal through conveyor belt and road transport. The geographical
distance plays an important role in determining the price of coal and the reliability of its delivery. WCL coal
mines have the advantage of close proximity to STPS as the distances range from 8 km to 458 km, whereas the
SECL supply sources are situated between 735 km and 906 km.
Figure 4 shows the trend in coal production in the region. The demand of coal for electricity generation at STPS
spiked the production at Pathakhera. The period (1986–87) in which three units of 200 MW and 210 MW were
commissioned, also witnessed a fourfold increase in coal production. Pathakhera was appreciated for its coal
3.31 3.26
3.5 3.07 2.95
2.81 2.83
3 2.65
2.31
2.5
1.90
1.72
2
1.5
1
0.5 0.63
0
1973-74
1986-87
1991-92
1996-97
2006-07
2007-08
2008-09
2009-10
2010-11
2011-12
2012-13
2013-14
2014-15
2015-16
2016-17
2017-18
2018-19
Coal Production in Million Tonne (Pathakhera)
Figure 4: Coal production from 1973–2019, Pathakhera Coalfield
Source: An Overview, 2014–2015, Western Coalfields Limited
| 4 |MAPPING THE IMPACT OF COAL MINES AND THEIR CLOSURE
supply owing to its geographical proximity that considerably reduced transportation costs. Newer mines opened
in 1992–2003 and the region recorded its peak production at 3.3 MT. Gradually with the closure of four mines,
the industry and the region slumped into a phase of decline.
In 2016–17, the nadir in the region reached when the power plant was put under reserve shutdown and 2.24
MT of coal was procured, consequently Pathakhera’s coal supply dropped to 1.4 MT (Figure 5). The annual
coal output since this period has been on decline and in 2018–19 reached the lowest in the last three de-
cades (Figure 5).
7
6
5
4
In MT
3
2
1
0
2011-12 2012-13 2013-14 2014-15 2015-16 2016-17 2017-18 2018-19
Coal Quantity Procured by STPS Coal Quantity Supplied by Pathakhera
Figure 5: Coal supply for STPS from Pathakhera Coalfield
Source: Office of Chief Engineer, STPS, Sarni
The supply of Pathakhera coal through conveyor belt and road transport was by far the greatest advantage
to STPS. According to officials, road transport ensures timely and an assured supply of coal. Besides the
limitation of service reliability, unless there is a demand of 4000 tonne, i.e. demand for a rail rake, the order
may run a chance of getting diverted to other plants. Due to the close locational proximity there was negligible
additional landed cost of coal.
(MPPGCL has its railway siding and a dedicated railway line from Ghodadongri to Sarni for the transportation of
coal and other associated infrastructure required for operation of the existing power plant. Railway siding was
set up between 1992 and 1995 under the supervision of the Indian Railways. Currently, work of augmenting
railway siding at the Ghodadongri and Sarni Yard (at the plant yard of 2 ×250MW) is being undertaken.7)
Sarni and Shobhapur mines at Pathakhera are directly connected to the power plant by conveyor belt. As
reserves in these two mines are near exhaustion and operations will close by March 2021, the supply through
conveyor belt will be put to a halt. As evident in Figure 6, the share of transport through conveyor belt began
decreasing from 2011–12.
1.3.2 Supply to Non-core Sectors
Besides the supply to the power plant, coal from Pathakhera also finds its market through e-auction (Figure 7).
Under the New Coal Distribution Policy of 2007, 10% of CIL’s estimated annual production can be offered under
e-auction, though this quantity is revised from time to time.8
7 Details available at http://www.mppgcl.mp.gov.in/Growth%20Plans/STPS-STAGE-123.pdf
8 Ministry of Coal, Government of India. 2007. New Coal Distribution Policy. Details available at http://www.westerncoal.in/sites/default/files/userfiles/
policy181007.pdf
| 5 |MAPPING THE IMPACT OF COAL MINES AND THEIR CLOSURE
100%
90%
80%
70%
60%
50%
40%
30%
20%
10%
0%
2011-12 2012-13 2013-14 2014-15 2015-16 2016-17 2017-18 2018-19
Road Conveyor Belt
Figure 6: Transport mode for coal supply to STPS from Pathakhera Coalfield
Source: Office of the Area General Manager, Pathakhera Coalfield
25.0
20.0
Percentage of coal auction
15.0
22.1
10.0
15.6 16.6
12.0
5.0 10.1 9.3
7.2
0.0
2006-07
2007-08
2008-09
2009-10
2010-11
2011-12
2012-13
2013-14
2014-15
2015-16
2016-17
2017-18
2018-19
Figure 7: Percentage of coal auction to total production, Pathakhera Coalfield
Source: Office of the Area General Manager, Pathakhera Coalfield
E-auction helps higher realization as compared to the coal sold to the power plant at a pre-determined price.
Coal from e-auction is in demand from various segments of buyers who do not have a steady supply contract
of coal with CIL.
Road transportation of coal through trucks to the power plant (command 75% of the total transport share) and to
the buyers under e-auction, has come to occupy a central position in the economy of the region.
1.4 Mine Closure and Proposal for New Mines
1.4.1 WCL’s justification for New Mines in Pathakhera
The years between 2010 and 2013 saw a continual closure of mines Pathakhera I (closed in 2010), Pathakhera
II (2011), and Satpura II (2013). Satpura I mine had already closed in 1998. The reserves from these mines
| 6 |MAPPING THE IMPACT OF COAL MINES AND THEIR CLOSURE
either depleted or the remaining was not feasible to extract. Pathakhera II and Satpura II mines were closed
with intact reserves of 0.46 MT and 0.74 MT, respectively. By March 2021, a fifth mine, ‘Shobhapur’, is slated
to close too.
The proposal to open up new mines has been pushed forth predominantly for meeting the coal demand of
the Satpura Thermal Power Station (STPS) and to re-deploy the workforce of the closed mines.9 The annual
requirement of coal for STPS is 7.10 MT out of which 2.5 MT is met by Pathakhera. The remaining requirement
is met from neighbouring Pench-Kanhan and distant coalfields of Kamptee, Wardha under WCL, and South
Eastern Coalfields Limited (SECL).
Moreover, the justification for new mines has also been looked at from the point of meeting the production
target of the larger subsidiary, i.e. WCL. CIL targets reaching 1 billion tonne of coal in financial year 2023–24
with WCL’s share of 75 MT.10
To meet the planned target of production by WCL as a whole as shown in Table 1, and in particular to increase
the coal supply to STPS from Pathakhera, which is presently 33.3%; it became incumbent upon WCL to identify
new mines.
Table 1: WCL’s projection for coal production
Year Coal (MT)
2021–22 65
2022–23 70
2023–24 75
Source: Western Coalfields Limited, Annual Report & Accounts 2019–20
Pathakhera now faces threats of sorts in the coal market as not only the despatch to the power plant has
declined with STPS fulfilling its requirement for its energy-efficient units from other coalfields in WCL and
SECL, but the reserves in its existing mines have also declined. Moreover, it is unable to meet the rising cost of
production even with the supply in auction at market prices (the maximum is only 20% of the output) as there
is a strong imperative to sell maximum to the power plant at a rate that ensures cheap electricity.
A TERI analysis for this coalfield over a six-year period (2012–18) of the CAGR (compound annual growth rate)
of its cost of production and the price of coal, suggests that the CAGR of the cost of production is 14% against
the CAGR of the price of coal (price to the power plant) at 6%. This significant difference in CAGR indicates the
reduction in profitability of the coalfield over the years.
Three new mines namely, Tawa III, Gandhigram, and Shaktigarh have been proposed for opening in Pathakhera
(Table 2). Though WCL has not approved Shaktigarh mines as it is not expected to yield the desired 12% IRR11
(Internal Rate of Return) and hence economically unviable, the Tawa III12 and Gandhigram mines have been
approved by it.
During the period of this study, as on December 2019, the proposed TAWA III and Gandhigram mines were yet
to receive forest and environmental clearances, but they have raised sufficient aspirations and concerns in
the region.
9 CMPDI. 2010. Project report for Tawa III UG mines. Details available at http://forestsclearance.nic.in/writereaddata/FormA/
Miningletter/1111101261221B9CZ8Tawa3PR.pdf
10 Details accessed from https://pib.gov.in/PressReleasePage.aspx?PRID=1629862
11 CMPDI. 2016. Recast project report for Gandhigram U/G mine available at http://environmentclearance.nic.in/writereaddata/Online/TOR/01_
Apr_2017_124644550JUZXP0QFExecutiveSummary.pdf
12 CMPDI. 2018. Recast project report for Tawa-III U/G mine available at available at http://environmentclearance.nic.in/writereaddata/Online/TOR/05_No
v_2018_124705900DJKTHUYUAnnexure-PFR-TAWA-IIIUG.pdf
| 7 |You can also read