Energy Industry Competitive Analysis for the Sweetgrass Region
←
→
Page content transcription
If your browser does not render page correctly, please read the page content below

Energy Industry Competitive Analysis for
                  the Sweetgrass Region

0|Energy Industry Competitive Analysis for Sweetgrass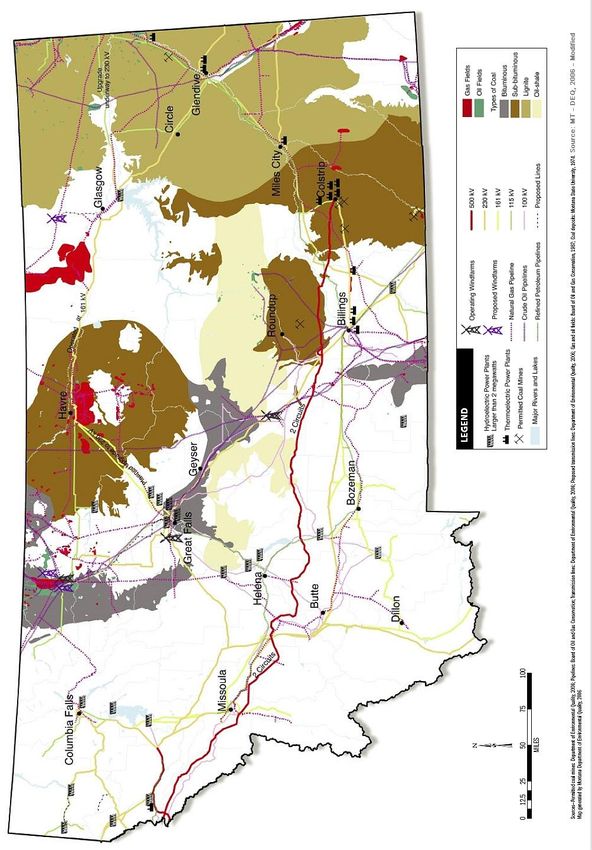
Table of Contents
Contents
Executive Summary....................................................................................................................................... 5
Introduction .................................................................................................................................................. 6
Project Methodology .................................................................................................................................... 7
Energy Demand Trends ................................................................................................................................. 7
Regional Energy Production ........................................................................................................................ 17
   Historic Energy Production ..................................................................................................................... 17
       Wind .................................................................................................................................................... 17
       Hydro................................................................................................................................................... 18
       Coal ..................................................................................................................................................... 19
       Oil ........................................................................................................................................................ 21
       Natural Gas ......................................................................................................................................... 22
   Current/Developing Energy Production ................................................................................................. 23
       Wind .................................................................................................................................................... 23
       Hydro................................................................................................................................................... 26
       Micro-Hydro ........................................................................................................................................ 27
       Geothermal ......................................................................................................................................... 30
       Coal ..................................................................................................................................................... 33
       Natural Gas ......................................................................................................................................... 34
       Solar .................................................................................................................................................... 36
       Combined Heat and Power ................................................................................................................. 37
       Bio Gas ................................................................................................................................................ 38
       Nuclear ................................................................................................................................................ 41
       Oil ........................................................................................................................................................ 41
Potential Energy Resources/Technologies.................................................................................................. 43
  Electrical Generation/Storage/Power Firming........................................................................................ 43
       Flywheels............................................................................................................................................. 43
       Vanadium Redox Batteries.................................................................................................................. 46
       Compressed Air Energy Storage.......................................................................................................... 48
       Pumped Hydroelectricty Storage ........................................................................................................ 50

1|Energy Industry Competitive Analysis for Sweetgrass
Superconducting Magnetic Energy Storage Systems.......................................................................... 50
       Combined Heat and Power ................................................................................................................. 51
       Bio-Gas ................................................................................................................................................ 52
       Clean Coal ........................................................................................................................................... 54
       Biomass ............................................................................................................................................... 55
   Heat Generation...................................................................................................................................... 57
   Transportation Fuels ............................................................................................................................... 60
Regional Energy Production Advantages .................................................................................................... 61
Regional Energy Production Disadvantages ............................................................................................... 73
Energy Development Opportunities ........................................................................................................... 76
Funding ....................................................................................................................................................... 80
  Generation .............................................................................................................................................. 80
   Transmission ........................................................................................................................................... 84
   Storage .................................................................................................................................................... 84
   Liquid fuel................................................................................................................................................ 85
   Gas .......................................................................................................................................................... 86
   Bioenergy ................................................................................................................................................ 86
   Solar ........................................................................................................................................................ 86
   Geothermal ............................................................................................................................................. 86
   Wind ........................................................................................................................................................ 88
Conclusion ................................................................................................................................................... 89
Appendix A- Sweetgrass Energy Feasibility Study Contacts ....................................................................... 91

Table of Figures
Figure 1- Map illustration of the Sweetgrass Region study area .................................................................. 6
Figure 2 - World marketed energy consumption 1980-2030 ....................................................................... 8
Figure 3 - World marketed energy use by fuel type, 1990-2030 .................................................................. 9
Figure 4 - World liquid fuel consumption by end-use sector, 2005-2030 .................................................. 10
Figure 5 - Primary U.S. energy use by fuel type, 1980-2030 (in quadrillion BTU’s) .................................... 11
Figure 6 – *Outdated* Delivered U.S. energy use by sector, 1980-2030 (in quadrillion BTUs) ................. 12
Figure 7 - Total U.S. energy use by end-use sector, 2007-2030 (in quadrillion BTUs)................................ 13

2|Energy Industry Competitive Analysis for Sweetgrass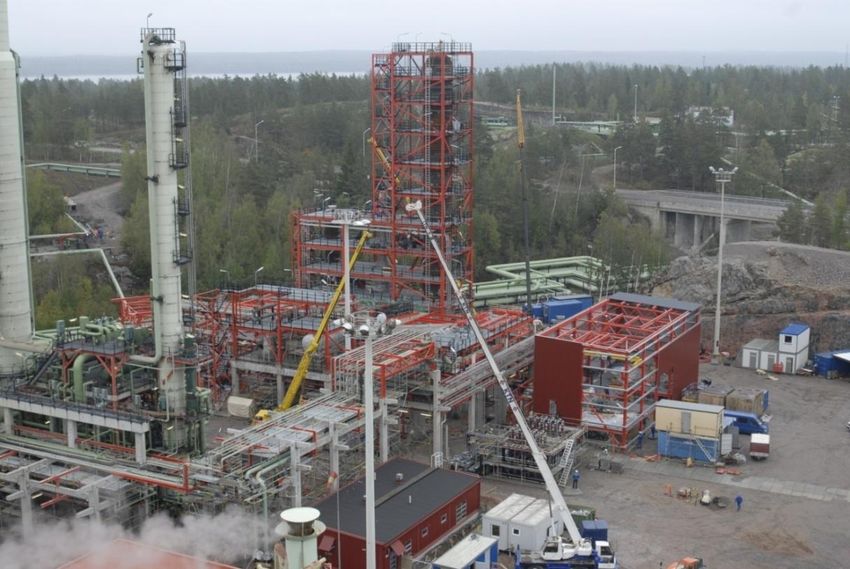
Figure 8 - Projected U.S. transportation energy consumption by mode, 2007-2030 (in quadrillion BTUs)
.................................................................................................................................................................... 14
Figure 9 - Historic Montana energy consumption* by source (in trillion BTUs) ......................................... 15
Figure 10 - Historic Montana Energy Consumption* by Sector (in trillion BTUs) ....................................... 17
Figure 11 - Electric utility hydroelectric net generation by state ............................................................... 18
Figure 12 – U.S. coal reserves and production in 2006 .............................................................................. 19
Figure 13 - Montana coal production 1998-2007 ....................................................................................... 20
Figure 14 – Major Montana coal mines and designated coal impact area................................................. 21
Figure 15 - Graphic representation of Bakken Shale Formation ................................................................ 22
Figure 16 - Dry natural gas proved reserves 2007 ...................................................................................... 23
Figure 17 - Glacier 1 Wind Farm ................................................................................................................. 23
Figure 18 - Horseshoe Bend Wind Farm ..................................................................................................... 24
Figure 19 – Montana wind power resource estimates ............................................................................... 25
Figure 20 – Montana hydroelectric plants .................................................................................................. 26
Figure 21 - State owned micro-hydro facilities ........................................................................................... 28
Figure 22 - Micro-hydro projects operated by Department of Fish, Wildlife, and Parks ........................... 29
Figure 23 - Geothermal potential ............................................................................................................... 30
Figure 24 - Montana principal geothermal sites ......................................................................................... 31
Figure 25 – Montana geothermal sites/contours and land ownership ...................................................... 32
Figure 26 – Montana coal producing counties map ................................................................................... 33
Figure 27 - Coal plants in Montana by capacity and status map ................................................................ 34
Figure 28 - Montana natural gas producing counties ................................................................................. 35
Figure 29 - Montana solar operations ........................................................................................................ 37
Figure 30 – Montana solar insolation ......................................................................................................... 37
Figure 31 - CHP units in Montana ............................................................................................................... 38
Figure 32 – Montana animal units .............................................................................................................. 39
Figure 33 – U.S. Biomass Resource ............................................................................................................. 40
Figure 34 - Uranium concentrations ........................................................................................................... 41
Figure 35 – Montana refineries .................................................................................................................. 42
Figure 36 – Montana oil counties ............................................................................................................... 42
Figure 37 - Oil production in Montana ....................................................................................................... 43
Figure 38 - Flywheel energy storage system............................................................................................... 44

3|Energy Industry Competitive Analysis for Sweetgrass
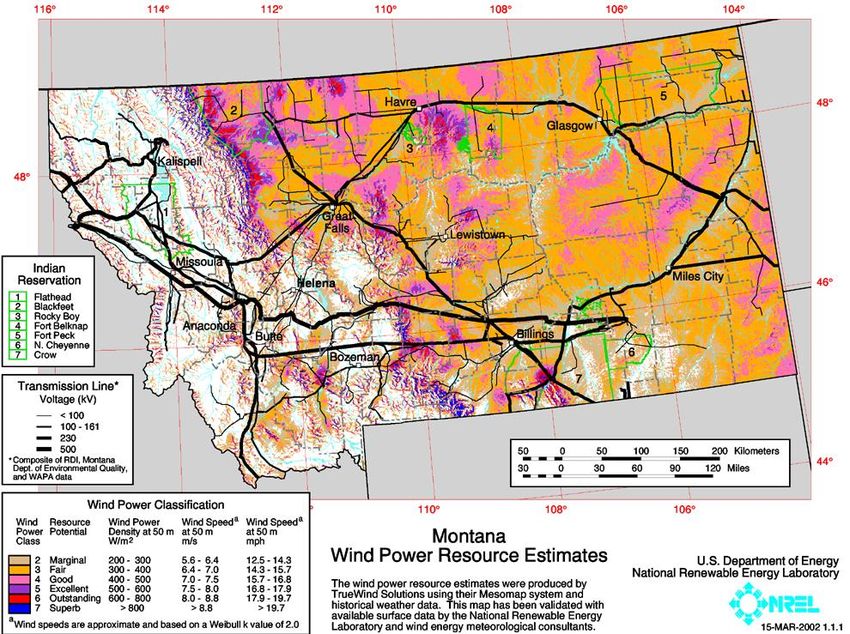
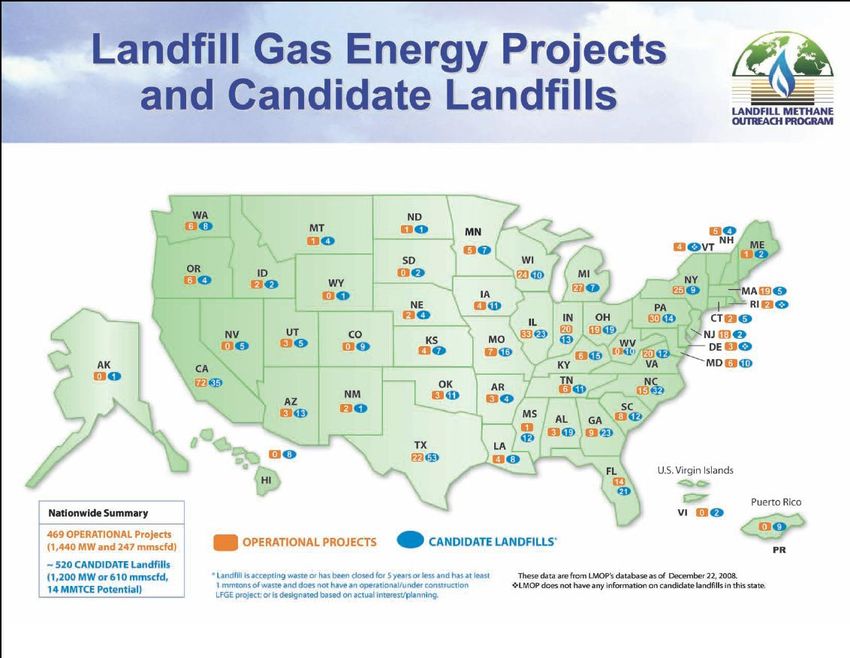
Figure 39 - Enercon Flywheel ...................................................................................................................... 45
Figure 40 - Flywheel energy storage systems ............................................................................................. 46
Figure 41 - Vanadium Redox Flow Battery Diagram ................................................................................... 47
Figure 42 - Vanadium Redox Battery Energy Storage Systems ................................................................... 48
Figure 43 – Diabatic CAES system ............................................................................................................... 49
Figure 44 - Graphic representation of PHS ................................................................................................. 50
Figure 45 - Superconducting magnetic energy storage system diagram.................................................... 51
Figure 46 - Conventional technology vs. CHP technology .......................................................................... 52
Figure 47 - Landfill gas energy projects and candidate landfills ................................................................. 53
Figure 48- Fundamentals of biogas production from dairy manure, 2001................................................. 53
Figure 49 – Montana animal units .............................................................................................................. 54
Figure 50 - Carbon sequestration options .................................................................................................. 55
Figure 51 - Biomass energy hierarchy ......................................................................................................... 56
Figure 52 - Biomass-residue energy potential ............................................................................................ 57
Figure 53 - Photos from the Calumet/Laurium/Keweenaw School District’s (VT) biomass heating system
.................................................................................................................................................................... 58
Figure 54 – Live tree above-ground woody biomass on Montana timberland .......................................... 58
Figure 55 – Live tree woody biomass and timberland acreage by ownership in Montana ........................ 59
Figure 56 – Live and standing dead tree above-ground woody biomass on Montana non-reservation
timberland................................................................................................................................................... 59
Figure 57 - Biofuels overview, 2002-2006 (Trillion BTU) ............................................................................ 61
Figure 58 - Small portion of the Sweetgrass Region’s water energy resource sites ................................... 63
Figure 59 - Wind generation located at the Glacier I Wind Farm (looking NW) ......................................... 64
Figure 60 - Wind resource map of the U.S. arrow showing Sweetgrass Region......................................... 65
Figure 61 - Approved Montana route of the MATL 230 kV transmission line ............................................ 67
Figure 62 - NorthWestern energy natural gas compressor station – Cut Bank, MT................................... 70
Figure 63 - Montana energy resources, production and transmission locations ....................................... 71
Figure 64 - Neste Oil’s renewable diesel refinery under construction in Porvoo, Finland (2006).............. 79
Figure 65 - Manure biodigester and methane-fired electrical genset in Wisconsin .................................. 80

4|Energy Industry Competitive Analysis for Sweetgrass
Executive Summary
The Sweetgrass Region of Montana – located along the eastern front of the Rocky Mountains – is a
region that has been endowed with abundant and diverse energy resources. With a history of energy
production spanning more than a century, the region has existing energy production, transportation
infrastructure, personnel, and support businesses in place to both utilize and build upon. Much of the
region’s historical energy production has been fossil fuels – oil, gas, and coal. However Great Falls’
nickname, “the electric city,” speaks to its long history and regional dominance in the production of
renewable energy derived from hydroelectric generation.

While extraction, processing and utilization of fossil fuel energy sources in the region will continue for
decades, current societal and governmental emphasis is focused on developing renewable and
sustainable energy resources – especially those with either no or neutral carbon (mostly CO2) emissions.
Changes in technology, policy and public perception may bring renewed emphasis on development of
abundant fossil fuel energy resources like coal in the future.

Given the current depressed economic conditions and both public sentiment and government policies
(including incentives and mandates) the results of this study indicate that renewable energy-related
development projects should be pursued in the region at this time. Two specific areas of energy
development are recommended: production of renewable diesel/jet fuel, and production of renewable
high value, firmed, clean, electricity.

The Sweetgrass Region has the potential to both produce the feedstock for and process/refine a
superior biofuels product, renewable diesel/jet fuel, for which there is current and projected to be
continually increasing demand. This endeavor will require construction of a renewable fuel refinery in
the region, preferably in association with an existing petroleum refinery. Farmers and agricultural-
related businesses, such as oil seed crushing and fat rendering plants, will need to supply the feedstocks.
Much of the infrastructure to support such a venture is in place in the region, and abundant oil seed
production and crushing capacity is currently available in nearby Alberta Canada.

The region currently has a great deal of renewable electricity production capacity from both wind and
hydroelectric generation sources. The region currently produces more electricity than it consumes, and
additional, short-term production will need to be transmitted to distant export markets. Justifying large
expenditures in new transmission infrastructure will require a high value product (renewable generated
electricity), that is available for the market when needed and of high quality (firm/clean). The region has
an abundance of undeveloped renewable energy resources (water and wind power) that can be
harnessed to generate electricity. These in addition to power regulating and additional transmission
capabilities will need to be developed in a strategic and integrated fashion in order to realize the
region’s full energy production and economic potential.

5|Energy Industry Competitive Analysis for Sweetgrass
Introduction
In January 2007, the U.S. Air Force announced plans to deactivate the 564th Missile Squadron from the
mission on Malmstrom Air Force Base. Acknowledging the need to mitigate the economic impact of such
a move, the Great Falls Development Authority (GFDA) and Cascade County solicited funding assistance
from the Department of Defense’s Office of Economic Adjustment (OEA), which they received in January
2008. The SGR admittedly relies too heavily on government/military spending and tourism to carry its
economy and sees the value in diversifying not only because of the opportune moment, but because of
the time-tested truth that through diversification and the sound adherence to change, a community can
strengthen its asset base to protect those things it deems most valuable. The Sweetgrass
Comprehensive Economic Development Strategy (CEDS) incorporates a philosophy of economic
development that supports the notion that prosperity depends upon creating environments in which
entrepreneurship flourishes and succeeds. In such an environment, assets are exploited, weaknesses are
mitigated, and cultivation of innovative ideas is encouraged, all while supporting regional partnerships.
The Defense Diversification Project will draw upon these concepts as it seeks to revitalize the regional
economy and create further opportunities in Glacier, Toole, Pondera, Cascade and Teton counties.

                          Figure 1- Map illustration of the Sweetgrass Region study area

                                                  Sources: KL&J

6|Energy Industry Competitive Analysis for Sweetgrass
Project Methodology
The Government Affairs division of Kadrmas, Lee & Jackson (KL&J) headed the SGR Energy Industry
Competitive analysis. Throughout the period of this study the analysis team performed research in
various areas of energy generation, liquid fuel production, transmission, funding opportunities,
legislation, and governmental regulations, as well as energy storage techniques. For energy generation,
liquid fuel production, and energy storage techniques, a strong focus was placed on what the SGR is
currently producing and what the region has produced in the past, in addition to the future energy
potential of the area. Available technology in each area was also a key factor that was thoroughly
examined.

The analysis team worked collectively in all areas of the study. Meetings were held at various milestones
of the project for the team to regroup and compile their findings. These meetings were crucial to the
success of the project, along with the numerous phone calls and on-site visits that took place between
KL&J and individuals from the SGR. Mark Luther, project manager, met with various industry
professionals throughout the duration of the project to discuss the region’s current and future needs for
energy generation, as well as exportation potential.

Following the completion of the initial research phase from December 2008 through April 2009, the staff
on the analysis team assembled the information gathered into meaningful and comprehensive sections,
which went on to be combined to form the final analysis report. As more information became available
through additional research, on-site visits, and phone calls, that information was incorporated into the
existing sections.

Energy Demand Trends
While one can easily view historical trends of energy consumption for the past several decades, it is now
increasingly difficult to predict future trends. There are several rapidly changing factors that are
influencing energy consumption and pricing on the international, national, and even regional scale.
Factors such as concerns over CO2 emissions and global warming, environmental damage, the impact of
renewables, alternative energy sources and related technologies, trade deficits, dependence on hostile
and/or unstable countries, “food to fuel” concerns, and greater awareness of the inefficient use of
limited and finite traditional energy resources are just a few of the factors that are causing massive
shifts in how populations view and plan to utilize energy resources in the future. Without a doubt the
current economic downturn coupled with the record high petroleum prices of 2008 have had an impact
(decreased consumption) on nearly all categories of energy use in the U.S. Time will tell if this is just a
temporary reaction to drastic fluctuations in energy costs and reduced expenditures by business and
consumers. To illustrate the changing nature of projections for future energy use, in addition to recent
projections, previous projections are included to illustrate the significant differences in perceived
reactions to the energy environment that exists today.

7|Energy Industry Competitive Analysis for Sweetgrass
While the rate of energy consumption is likely to remain moderate in the more developed countries of
the world, overall worldwide consumption of all forms of energy will continue to increase - driven for
the most part by the large, emerging economies in Asia. As shown in Figure 1, overall energy use
worldwide is projected to continue rising at a slightly higher rate over the next 20+ years than it has over
the previous three decades.

                                Figure 2 - World marketed energy consumption 1980-2030

 Sources: History: Energy Information Administration (EIA), International Energy Annual 2005. Projections: EIA, World Energy
                                                  Projections Plus (2008).

The relative contribution of the major fuel types to the total energy consumption of any given country,
or even for regions within a country, is strongly tied to both price and availability. In countries with
abundant petroleum (liquid fuels) production, that form of energy is more widely used as an energy
source for all the primary consumption sectors (residential, commercial, industrial, transportation) than
for a petroleum deficient country that might rely on liquid fuels primarily for transportation. As seen in
Figure 2, liquid fuels have been and are projected to be the largest category of fuel type consumed
worldwide. Liquid fuel use is projected to increase at a steady rate – similar to that shown for the
previous 18 years – over the next 20+ years.

It is interesting to note, given the high level of concern over global warming and coal use, that coal
consumption is projected to increase more rapidly than any other fuel type – solidly retaining and
expanding its stature as the second most used fuel type worldwide. Note that the consumption of all
five major fuel types is projected to steadily increase over the next 20+ years.

8|Energy Industry Competitive Analysis for Sweetgrass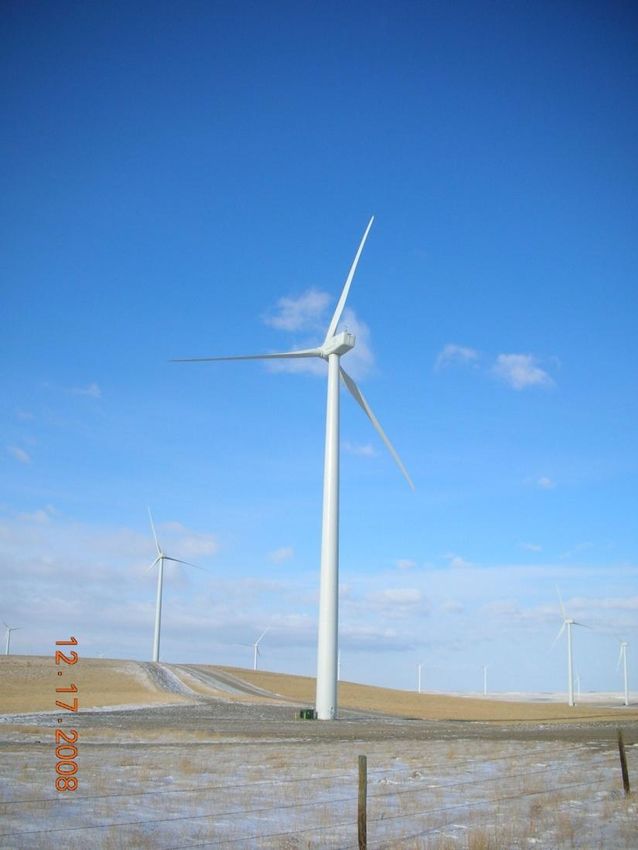
Figure 3 - World marketed energy use by fuel type, 1990-2030

 Sources: History: Energy Information Administration (EIA), International Energy Annual 2005. Projections: EIA, World Energy
                                                  Projections Plus (2008).

Once again, as seen in Figure 2, liquid fuels are currently the number one fuel type in the world and are
projected to maintain that standing for the foreseeable future. Although the end uses for liquid fuels are
many, the majority of its consumption is directly related to transportation. Figure 3 illustrates both the
projected uniform increase in demand for liquid fuels in total, as well as the continued dominance of
transportation related to consumption. It is interesting to note that the use of liquid fuels for electrical
generation is projected to decrease over time; this is likely due to increases in the use of coal and/or
alternative/renewable energy sources for electrical generation.

9|Energy Industry Competitive Analysis for Sweetgrass
Figure 4 - World liquid fuel consumption by end-use sector, 2005-2030
Sources: 2005: Energy Information Administration (EIA), International Energy Annual 2005. Projections: EIA, World Energy
Projections Plus (2008).
Narrowing our view from worldwide energy use now to strictly U.S., historical and projected energy
demands paints a significantly different picture from the previous. As a long-time developed country,
the U.S. in recent years has not nor is projected in the foreseeable future to increase its consumption of
energy at a rate of growth shown on the international stage. Projections indicate that there will be
growth in U.S. energy consumption, but it will be very minimal and supplied in large by the addition of a
mix of renewable energy types. Coal usage will also continue to increase, albeit at a very low rate
compared to its increased use worldwide. It is likely that increased coal use in the U.S. will come about
utilizing clean coal technologies, carbon sequestration, and/or some form of advanced fuels technology.
As shown in Figure 5 below, nuclear, natural gas, and liquid fuels consumption is projected to remain
relatively stable through 2030. As for natural gas, the projection for a stable level of consumption over
the next 20+ years will likely be dependent on its level of use in new electrical generation facilities for
providing either baseload, peaking, or firming power. The recent announcement at the proposed
Highwood Generation Station near Great Falls, MT of design changes to an under construction,
permitted coal-fired powerplant, to instead be a natural gas-fired powerplant is just one example of the
potential for unexpected large consumers of natural gas to appear in the future due to environmental
and financing concerns.
10 | E n e r g y I n d u s t r y C o m p e t i t i v e A n a l y s i s f o r S w e e t g r a s sFigure 5 - Primary U.S. energy use by fuel type, 1980-2030 (in quadrillion BTU’s)
Source: USDOE/EIA Annual Energy Outlook 2009
One thing is certain, and that is that there are a very large number of factors affecting both the types of
fuels being consumed as well as their relative prices. The complexity and number of factors involved has
made future-looking energy projections very difficult to compile – subject to frequent and substantial
changes, and useful mostly as a general guideline to illustrate trends. The days of relatively accurate
projections being tied mostly to the simple economics of supply and demand are long gone, controlled
by those factors as well as complex social, political, environmental, and technology concerns and
changes.
An example of recent changes to published energy usage data in the U.S. can be seen in a comparison of
Figure 6 and Figure 7. Data/graph sources for these two figures are both from the Department of Energy
– Energy Information Administration (USDOE/EIA), which is the federal agency that compiles energy
statistics and tracks both historical energy use and production, as well as creates projections for future
energy production and consumption. If one looks specifically at the transportation and industrial sectors
and compares the 2007 data versus the 2009 data, one can see the dramatic changes in outlook that can
come about due to changes in the nation’s financial health, administration policies and public
perceptions. It is important to remember that projections are highly influenced by current events that
may or may not have long-term impacts and influence on consumer behavior.
11 | E n e r g y I n d u s t r y C o m p e t i t i v e A n a l y s i s f o r S w e e t g r a s sFigure 6 – *Outdated* Delivered U.S. energy use by sector, 1980-2030 (in quadrillion BTUs)
Source: USDOE/EIA Energy Outlook 2007
12 | E n e r g y I n d u s t r y C o m p e t i t i v e A n a l y s i s f o r S w e e t g r a s sFigure 7 - Total U.S. energy use by end-use sector, 2007-2030 (in quadrillion BTUs)
Data Sources: History: EIA-AER “Energy Consumption by Sector, 1949-2007” Table. Projections: USDOE/EIA Annual Energy
Outlook 2009. Note: Total energy consumption includes electrical system energy losses – delivered energy is significantly lower
for all categories other than transportation.
For the U.S. in general, one type of consumer behavior that has responded to recent economic
conditions and the high crude oil prices of the past two years is travel. Americans have cut back
significantly on travel – especially discretionary travel and to some extent business travel. This is
reflected in Figure 7 by the projected decreasing consumption of energy in the transportation sector
over the next 2-3 years, before returning to the long-term trend of increased consumption. It is unlikely
that additional dramatic drops in the consumption of transportation fuels will occur over the next
decade or two. The energy inefficient centralized product distribution systems and dominant suburban
housing patterns that have developed over the last several decades of inexpensive energy will be very
difficult, if not impossible, in the near term to change; this due to the tremendous amounts of societal
wealth that has been invested in infrastructure and systems centered around cheap energy and ease of
transportation.
While much effort is underway regarding alternative transportation fuels (i.e., hydrogen, fuel cell,
electricity to name a few), the dominant fuel for transportation is and for the foreseeable future will
continue to be liquid fuels – primarily petroleum derived fuels. In the 2009 EIA projections (Figure 7) it is
interesting to note that the only categories of transportation that are projecting significant increases in
energy consumption are those of heavy-duty vehicles and air transport – both of which rely almost
exclusively on petroleum distillates (i.e., diesel and jet fuel), or to a lesser extent biofuels and similar
synthesized GTL fuels. This expanding market sector will receive further attention in the “Energy
Development Opportunities” section of this document.
13 | E n e r g y I n d u s t r y C o m p e t i t i v e A n a l y s i s f o r S w e e t g r a s sFigure 8 - Projected U.S. transportation energy consumption by mode, 2007-2030 (in quadrillion BTUs)
Source: USDOE/EIA Annual Energy Outlook 2009
Narrowing the focus now to energy use in Montana provides the reader with a picture of energy
consumption and trends that are not mirror images of either world or U.S. consumption patterns.
Similar to both world and U.S. patterns, liquid (primarily petroleum) energy sources have been at or
near the top of energy sources consumed in Montana during the reporting period (Figure 8). Montana
has been a producer of crude oil for nearly a century now, and continues to be a significant producer,
consumer, and exporter of liquid fuels. Since Montana is a very large and primarily rural state,
consumption of energy – especially transportation fuels – is markedly higher per capita than in most
states. In fact, according to DOE-EIA “Montana Quick Facts”, Montana ranks 44th in population in the
U.S. (2008), but 10th in energy consumption per capita (2006). Shortages of diesel fuel – critical for the
agriculture and trucking industries – have occurred periodically during recent years.
Renewable liquid transportation fuels (ethanol and biodiesel) have increasingly been utilized over the
past several years in Montana, with ethanol consumption going from a bit over 1.6 million gallons per
year in 2004, to slightly more than 21 million gallons (about 4.5% of the quantity of gasoline consumed)
in 2007 (EIA-SEDS). Biodiesel is also being consumed in the state – most notably in the region around
Missoula – but quantities are small and only four retail sales locations (Missoula and Kalispell areas) are
listed by the National Biodiesel Board for the entire state. Recent reports (April 2009) coming out of
Missoula, indicate that even those locations may not be receiving product from suppliers at this time.
14 | E n e r g y I n d u s t r y C o m p e t i t i v e A n a l y s i s f o r S w e e t g r a s sMontana Energy Use 1960 - 2006
250
200
150 Coal
Trillion Btu
Natural Gas
100 Petroleum
Renewables
*Export/Loss
50
0
Source Data: EIA State Energy Data 2006
Figure 9 - Historic Montana energy consumption* by source (in trillion BTUs)
(* includes electricity exported/line loss - undifferentiated by source)
As mentioned previously in the discussion of world energy consumption, patterns of energy use (types,
amounts, etc.) are strongly tied to both price and availability; this also holds true in Montana. A striking
pattern can be shown in Montana for the reported years shown in Figure 8, where renewable energy
(primarily hydroelectric) has provided a consistent and very large percentage of the energy produced
and consumed in Montana. Renewables historically have provided a much higher percentage of energy
consumed in Montana than in either the U.S. or the world. However, the rapid rise in the use of coal
(primarily for electricity generation) between 1975 and 1990 has now moved coal to at or near the top
of consumed energy sources in Montana. Relatively speaking, the rank of coal as a consumed energy
source in Montana now exceeds its rank in either the world or U.S. on average. However, since most of
the coal consumed in Montana is for electrical generation, and roughly half of the electricity generated
in Montana is either exported out-of-state or to a much lesser extent lost in transmission losses (Figure
9*), it is difficult to discern exactly how much coal-based energy versus renewable (primarily
hydroelectric) energy is actually consumed in Montana. Once electricity is put into the electrical grid it is
difficult to determine the exact source of that electricity. Suffice it to say, electric power consumption in
Montana has increasingly been supported by a coal energy source versus the high level of renewable
(primarily hydroelectric) sources seen in the past.
As of 2007, Montana produced (marketed) approximately 117 billion ft3 of natural gas – while
consuming approximately 74 billion ft3 (76 trillion BTU) of that energy source in state. As a natural gas
producer and exporter, Montana natural gas consumption has been relatively level over the past nearly
15 | E n e r g y I n d u s t r y C o m p e t i t i v e A n a l y s i s f o r S w e e t g r a s s50 years (Figure 8) with consumption now only approximately 30% higher than it was in 1960. About 60% of Montana households use natural gas as their primary energy source for home heating (EIA – “Montana Quick Facts”). It is worth noting again that due to environmental concerns, the proposed coal- fired Highwood Power Station near Great Falls is now in the process of being reconfigured as a 120 megawatt natural gas powered generation station. The addition of large natural gas consumers such as electric utilities will increase natural gas consumption in the state, and will almost certainly impact residential consumers in the future. Changing the focus from energy source consumption to the individual sectors that are consuming energy in Montana, gives a pattern (Figure 10) that is somewhat more similar to that seen in the U.S. as a whole (Figure 7). As in the U.S. energy sector graph, industrial energy use is the highest, followed by transportation and residential, with the commercial sector consuming the least energy of the four. Although the graph for Montana (Figure 10) includes data going back 20 years further than the U.S. graph, it does show a similar pattern of energy consumption. While there is considerable fluctuation in energy use by the industrial sector in Montana – more so than the U.S. as a whole – one can still see that there has been relatively little if any growth in consumption in either case between 1980 and 2006. In both the U.S. and Montana charts one can see that the transportation sector has had the largest and most consistent growth in energy consumption of all the sectors. Growth in both residential and commercial energy consumption has flattened out in recent years. Although energy consumption isn’t broken out by county or region here in this report, the SGR’s five counties contain roughly 12% of the population in the state of Montana and can be assumed to consume a proportionate share of the energy totals shown on the previous graphs. 16 | E n e r g y I n d u s t r y C o m p e t i t i v e A n a l y s i s f o r S w e e t g r a s s
180

                160

                140

                120
                                                                                                           Residential
       Trillion Btu

                100
                                                                                                           Commercial
                      80
                                                                                                           Industrial
                      60

                      40

                      20

                       0

                           Figure 10 - Historic Montana Energy Consumption* by Sector (in trillion BTUs)

                                                Source: EIA State Energy Data 2006

Regional Energy Production
Historic Energy Production
Wind
Wind energy projects have been in operation for decades, but it is only in the past 20 years that of wind
technology has drastically evolved into what is in operation today. In the late 1970s, wind energy cost 40
cents per kWh. Today, wind energy costs approximately 3.5 cents per kWh. This drastic drop in price is
due to the technology advancements that have made capturing the power of wind more economically
feasible. Currently, wind power plants can be integrated into an automatic generation control system
and can participate in frequency regulation. These plus various additional features are made possible by
the introduction of new power electronic controlled interfaces. Despite the technological strides in wind
power over the past decades, wind cannot be fully scheduled over long periods of time and the
development of firming and storage methods will be essential; several of these methods are discussed
in the Potential Energy Resources/Technologies section of this report. Another concern with large
volumes of wind energy production and a lack of adequate storage technology is the ability, or lack
thereof, to transmit the energy throughout the state and also over longer distances.

17 | E n e r g y I n d u s t r y C o m p e t i t i v e A n a l y s i s f o r S w e e t g r a s s
Hydro
Hydroelectric power (hydropower) is a reliable, emission-free renewable resource that utilizes the
natural flow of water to generate clean, fast, flexible electricity. Hydropower has grown over the last
century from 45 hydroelectric facilities in 1886 to over 2,000 facilities in the U.S. that contribute
approximately 80,000 MW to our nation’s electrical capacity (1 MW provides electricity for 750
households). That amount represents nearly 10% of our country’s electrical generating capability and
provides more than 75% of the electricity generated from renewable resources. Today, a majority of
hydropower generations stations operate in the form of “run-of-the-river” or hydroelectric dams. Most
hydroelectric power comes from the potential energy of dammed water driving a water turbine and
generator. Through this method of generation, energy extracted from the water depends on the volume
and height difference between the source and the water's outflow.
Figure 11 - Electric utility hydroelectric net generation by state
Source: USGA http://ga.water.usgs.gov/edu/wuhy.html
Besides serving as a reliable and environmentally-friendly form of electrical generation, hydropower also
offers more non-power benefits than any other electrical generation sources: water supply, flood
control, navigation, irrigation, and recreation.
18 | E n e r g y I n d u s t r y C o m p e t i t i v e A n a l y s i s f o r S w e e t g r a s sCoal
Coal Reserves and Production
Reserve
Base Rank by
(Billions of Reserve 2006 Production Rank by
State Tons) Base (Millions of Tons) Production
MT 119.2 1 41.8 6
IL 104.4 2 32.8 9
WY 63.3 3 446.7 1
WV 32.7 4 152.4 2
KY 29.8 5 120.8 3
PA 27.3 6 66 4
OH 23.3 7 22.7 13
CO 16.2 8 36.3 7
TX 12.3 9 45.5 5
NM 12.1 10 25.9 12
IN 9.4 11 35.1 8
ND 9.0 12 30.4 10
AL 6.1 13 1.4 14
MO 6.0 14 0.4 15
UT 5.3 15 26 11
Figure 12 – U.S. coal reserves and production in 2006
Source: MT Coal Council
As shown in Figure 13, Montana has the largest coal reserves in the country, however, it lags behind
other states in coal production – most notably, Wyoming. Several reasons serve to explain this
discrepancy. According to the Montana Environmental Information Center (MEIC), much of Montana’s
coal costs too much to mine and transport. The economic problems arise from two factors: geography
19 | E n e r g y I n d u s t r y C o m p e t i t i v e A n a l y s i s f o r S w e e t g r a s sand geology. Montana is located further from the major coal-consuming markets than other suppliers of
coal. Exacerbating this disadvantage is that there is only one railroad that serves the state – the
Burlington Northern Santa Fe. With this monopoly in place, shipping rates remain high. In regard to
geology, there is more overburden on average on top of Montana coal; once this overburden is
removed, the coal seams aren’t as thick. In addition, some Montana coal, particularly in the Tongue
River Basin, contains elevated levels of sodium. This characteristic makes it less desirable to burn
because of the residue left behind in boilers.
Coal Production
Production
(Million
Year Tons)
1998 42.6
1999 41.1
2000 38.3
2001 39.2
2002 37.3
2003 37.0
2004 40.1
2005 40.6
2006 41.8
2007 43.2
Figure 13 - Montana coal production 1998-2007
Source: Montana Coal Council
Notwithstanding these drawbacks, Montana has been able to establish a modest, stable coal industry, as
shown in Figure 13. Approximately 35-40 million tons of coal is mined annually in Montana, ranking the
state sixth in coal production. Montana’s coal is predominantly surface-mined and most of the coal
originates from five strip mines: the Decker and Spring Creek mines near Decker; the Western Energy-
Rosebud and Westmoreland Resources-Absaloka mines at Colstrip; and the Sarpy Creek mine near
Hardin. Other coal mine activity within the state includes Bull Mountain in Roundup, an underground
mine; Savage Mine in Savage, a lignite mine; and Nelson Creek (lignite mine), Otter Creek, Signal Peak
20 | E n e r g y I n d u s t r y C o m p e t i t i v e A n a l y s i s f o r S w e e t g r a s s(underground mine), and Carpenter Creek. Figure 14 gives a visual representation of the major coal
mines in Montana and the coal impact area.
Figure 14 – Major Montana coal mines and designated coal impact area
Source: Census and Economic Information Center Department of Commerce,
“Montana’s Energy Resources,” Energy Open 2007, Susan Ockert
Oil
The major oil source rock shale formation in the state is the Bakken formation, located in the Williston
Basin as depicted in Figure 15. According to the U.S. Geological Survey, 3 to 4.3 billion barrels of
recoverable oil exist within this formation. The Bakken is projected to produce more than 130 million
barrels of oil in the current development areas, with the potential of producing an additional 300 million
barrels from expanded areas. At present, over 500,000 acres have been leased for drilling, with 210
horizontal wells drilled as of 2008 that have yielded 11 million barrels of oil. The average capital required
for a well presently stands at $2.7 million. As of 2008, the Bakken produces 33,000 barrels of oil and 20
million cubic feet of natural gas per day.
21 | E n e r g y I n d u s t r y C o m p e t i t i v e A n a l y s i s f o r S w e e t g r a s sFigure 15 - Graphic representation of Bakken Shale Formation
Source: gemex.energygem.com/bakken.jpg 3/5/2009
Natural Gas
According to the Energy Information Administration’s most recent data, Montana has 1,052 billion cubic
feet of dry natural gas reserves, as illustrated in Figure 16. In December of 2007, gross gas withdrawals
totaled 10,496 million cubic feet. In 2004, gross gas withdrawals totaled 7,916 million cubic feet; in
1999, withdrawals totaled 5,291 million cubic feet. Clearly, gross natural gas withdrawals have trended
upwards in the past decade. Accordingly, the number of natural gas wells in the state has increased
from 3,071 in 1997 to 6,925 in 2007. In January of 2009, the Bush administration approved a plan that
could allow more than 18,000 natural gas wells to be drilled in southeastern Montana’s Powder River
Basin on 1.5 million acres of federal land.
22 | E n e r g y I n d u s t r y C o m p e t i t i v e A n a l y s i s f o r S w e e t g r a s sFigure 16 - Dry natural gas proved reserves 2007
Source: Energy Information Administration, U.S. Department of Energy
“U.S. Crude Oil, Natural Gas, and Natural Gas Liquids Reserves 2007 Annual Report.”
Current/Developing Energy Production
Wind
Montana is currently testing and developing wind energy generating stations throughout the state.
Below, in Figure 17 and Figure 18, both Glacier 1 and Horseshoe Bend wind farms are featured.
Figure 17 - Glacier 1 Wind Farm
23 | E n e r g y I n d u s t r y C o m p e t i t i v e A n a l y s i s f o r S w e e t g r a s sFigure 18 - Horseshoe Bend Wind Farm
Source: Mark Luther, KL&J
Wind developers, land owners, and the state are also in the process of developing several other
commercial wind energy generating facilities throughout the state. Some of the nearest developments
in relation to Great Falls and the SGR are Horseshoe Bend Wind Farm, Glacier 1 and Glacier 2 Wind
Farms, and Rimrock Wind Farm.
24 | E n e r g y I n d u s t r y C o m p e t i t i v e A n a l y s i s f o r S w e e t g r a s sFigure 19 – Montana wind power resource estimates As shown in Figure 19, a majority of Montana is in the “fair” wind power classification. There are several exceptions throughout the state where the rating jumps to “good” or even “excellent” in specific areas. The SGR happens to be in an area with a significant amount of “good” wind power sites. Many local residents are taking advantage of wind power opportunities on their land by constructing independent wind power generating turbines. Many personal turbine owners have had significant success in these efforts. The state of Montana has a “net metering” program in place to entice land owners to produce renewable energy to fulfill a portion of their energy needs. Any facility that is installed for the production of electric energy that uses as its fuel solar, wind, or hydropower; has a generating capacity of not more than 50 kilowatts; is located on the customer-generator’s premises; operates in parallel with the distribution services provider’s distribution facilities; and is intended primarily to offset part or all of the customer generator’s requirements for electricity qualifies for the “net metering” program. 25 | E n e r g y I n d u s t r y C o m p e t i t i v e A n a l y s i s f o r S w e e t g r a s s
Hydro

                                      Figure 20 – Montana hydroelectric plants

                                   Source: PPL-Montana website, KL&J modified

The SGR has taken a very aggressive approach to hydroelectric power generation and Montana is
actively working to increase its use of renewable energy, particularly hydroelectric power, which now
comprises over 25% of the state’s total electric generation. Pennsylvania Power & Light (PPL) Montana is
the owner/operator of the major hydropower generators in/near the SGR. As depicted in Figure 20,
commercially operating hydroelectric plants are:

        Rainbow Dam: 8 units, 36 MW (total)
        Black Eagle Dam: 3 units, 21 MW (total)
        Cochrane Dam: 3 units, 60 MW (total)
        Ryan Dam: 6 units, 60 MW (total)
        Morony Dam: 2 units, 48 MW (total)
        Hauser Dam: 6 units, 19 MW (total)
        Holter Dam: 4 units, 48 MW (total)

All of the above facilities are owned and operated by PPL Montana. All of the aforementioned
generation stations are located on the Missouri River and are classified as run-of-the-river projects. The
Rainbow Dam is scheduled to undergo a major construction project that is expected to take 2 ½ years to
complete. This update will relocate the powerhouse 200 yards further downstream from the
powerhouse that is currently in operation. There will also be one huge turbine replacing the eight
turbines currently in operation. This will increase the generation capacity by 70% (from 35 MW to 60

26 | E n e r g y I n d u s t r y C o m p e t i t i v e A n a l y s i s f o r S w e e t g r a s s
MW). The project is set to being in early 2010 and is expected to employ a large number of people in the area. Spring 2012 is the projected date of completion. Micro-Hydro As discussed in the Hydroelectric section of this report, there is a great deal of hydropower potential in the SGR, and the state is developing and expanding this form of energy production. Aside from focusing on commercial size hydropower stations, a significant amount of attention has shifted to micro-hydro generation projects. There are over 25 documented micro-hydro projects that the state owns and operates. Figure 21 provides a list of the state owned micro-hydro facilities as well as each site’s statistics. Figure 22 lists the micro-hydro projects that the Department of Fish, Wildlife, and Parks Dams currently has in operation. 27 | E n e r g y I n d u s t r y C o m p e t i t i v e A n a l y s i s f o r S w e e t g r a s s
Name                                   Year                   Storage               Height   County
                                         Completed              (acre-feet)           (feet)

  Ackley Lake Dam                        1938                   5,815                 51       Judith Basin

  Bair Reservoir Dam                     1939                   7,010                 102      Meagher

  Cataract Dam                           1959                   1,478                 80       Madison

  Cooney Dam                             1937                   28,400                102      Carbon

  Cottonwood Dam                         1953                   1,900                 39       Park

  Deadmans Basin Dam                     1941                   72,220                60       Wheatland

  East Fork of Rock Creek Dam            1938                   16,040                83       Granite

  Fred Burr Dam                          1948                   516                   50       Ravalli

  Frenchman Dam                          1952                   3,750                 44       Phillips

  Glacier Lake Dam                       1937                   4,200                 57       Carbon

  Martinsdale Dam                        1939                   23,110                91       Wheatland

  Middle Creek Dam (Hyalite)             1951                   10,184                125      Gallatin

  Nevada Creek Dam                       1938                   12,640                88       Powell

  Nilan Dam                              1951                   10,090                54       Lewis & Clark

  North Fork of Smith River Dam          1936                   11,406                84       Meagher

  Painted Rocks Dam                      1940                   32,362                143      Ravalli

  Ruby River Dam                         1939                   36,633                111      Madison

  Tongue River Dam                       1939                   79,071                94       Big Horn

  Toston Dam (Broadwater-Missouri)       1940                   3,000                 56       Broadwater

  Willow Creek Dam                       1938                   17,730                105      Madison

  Yellow Water Dam                       1938                   3,840                 37       Petroleum

                                     Figure 21 - State owned micro-hydro facilities

28 | E n e r g y I n d u s t r y C o m p e t i t i v e A n a l y s i s f o r S w e e t g r a s s
Name Year Storage Height County
Completed (acre-feet) (feet)
Ashley Lake Dam -- 20,400 10 Flathead
Bearpaw Dam 1958 535 59 Hill
Clearwater Fish Barrier 1963 less than 50 15 Missoula
Gartside Dam 1962 326 30 Richland
Johnson Reservoir Dam 1930s 208 23 Dawson
Knowlton Reservoir Dam 1890-1910 166 15 Teton
South Sandstone Reservoir Dam 1975 940 38 Fallon
Whitetail Dam 1930s 198 21 Daniels
Rainy Lake Fish Barrier -- -- -- Missoula
Figure 22 - Micro-hydro projects operated by Department of Fish, Wildlife, and Parks
Source: Montana Water Projects Bureau, DNRC Water Resources Division
http://dnrc.mt.gov/wrd/water_proj/default.asp
In addition to state owned projects, there are numerous independent projects that landowners from
across the state are implementing. The following paragraphs describe two privately owned micro-hydro
projects that have been highlighted on the state’s website.
Just 20 miles south of Darby located on Boulder Creek, is an ES&D turbo system ideal for low-head
generation. With this particular project, there is only 25 feet of head, but the system is capable of
generating over 400 watts. The owners of this project made the decision to make this facility “grid-
intertied” to take advantage of Montana’s net metering program. This system provides all of the power
needed for one 220-volt and one 110-volt application for a single house. This particular system was
purchased from Solar Plexus out of Missoula.
The second micro-hydro project is located near Manhattan and is a solar/hydro combination system.
This combined system generates nearly enough electricity to fulfill the family’s household energy needs.
The system is composed of two sets of 12, 100-watt Siemens photovoltaic panels and two 24-volt
submersible generator turbines by Aquair. This project is also incorporated into the net metering
program offered by the State.
29 | E n e r g y I n d u s t r y C o m p e t i t i v e A n a l y s i s f o r S w e e t g r a s sYou can also read