Worlds Apart - Squarespace
←
→
Page content transcription
If your browser does not render page correctly, please read the page content below
Worlds Apart

Agronomy Capital Advisors Limited   January 2019

Contents
   Executive Summary – A Seismic Divide............................................. 4
   Modern Demand Drivers.................................................................. 6
      Packaged Coconut Water................................................................. 6
            Jax Coco – The Chicest Coconut Water (Vogue).............................................. 7
       Coconut Milk -Dairy Alternatives..................................................... 8
            A Multi-segmented Product Sector................................................................. 8
            Coconut Milk Nutrition................................................................................... 8
            Dairy Alternatives Market Segment................................................................ 9
       Virgin Coconut Oil............................................................................ 9
       Activated Carbon Products............................................................ 10
       The Traditional Coconut Economy................................................. 11
            Coconut Oil................................................................................................... 11
            Desiccated Coconut...................................................................................... 12
            Coconut Milk................................................................................................. 12
            Coir................................................................................................................ 12
   Profile of The Global Coconut Production Sector . .......................... 13
      An Informal Smallholder Dominated Sector.................................. 15
      Indonesia – An Informal Producer Sector Blessed By Climate....... 17
            Three Limiting Factors................................................................................... 19
       Profile of The Sambu Group.......................................................... 23
            Origins........................................................................................................... 23
            Ecosystem..................................................................................................... 23
            Proprietary Plantations................................................................................. 24
            Processing..................................................................................................... 24
            Zero Waste.................................................................................................... 25
            PT Pulau Sambu (Kuala Enok)....................................................................... 25
            PT Pulau Sambu (Guntung)........................................................................... 25
            PT Riau Sakti United Plantations................................................................... 26
            Staff and Staff Management......................................................................... 26
            Products & Brands........................................................................................ 27
            Postscript: Peat Land Agriculture ................................................................. 27
                                                                                                                                      PT. Riau Sakti United Plantations

Agronomy Capital Advisors Limited                                                                                          January 2019                                   2
The Philippines – A Dysfunctional Supply Chain............................ 28
Regional Analysis.......................................................................................... 30
Ageing Palms................................................................................................. 32
Absent Economies of Scale and Dysfunctional Supply Chain........................ 33
Questionable Leadership and Political Support............................................ 35
Industrial Processing..................................................................................... 35
Conclusion.................................................................................................... 38
India – A Complex Jigsaw............................................................... 39
An Agricultural Economy............................................................................... 39
‘Tree of Heaven’, Central To Farming In Peninsular India.............................. 39
Climatic Zones in India; The Köppen Classification System........................... 42
Sub-optimal Planting Densities..................................................................... 42
Rainfed versus Irrigated................................................................................ 43
Uneconomic Producer Units......................................................................... 44
Progressive Replanting – Perspective of Deejay Farms................................. 44
A Focus on Breeding..................................................................................... 44
Processing Sector.......................................................................................... 45
Brazil – “Invented Here”................................................................ 46
Brazilian Coconut Sector Origins................................................................... 46
Growth Driven By Domestic Market............................................................. 47
Productivity................................................................................................... 48
Government Backed Research Support for Brazilian Coconut Sector....... 52
The Importance of Embrapa......................................................................... 52
Conclusion...................................................................................... 54
Appendix 1..................................................................................... 56
Agronomic Requirements.............................................................. 56
Climatic Requirements.................................................................................. 56
Soil Preferences............................................................................................ 56
Water Requirement...................................................................................... 56
Mineral Nutrition: Uptake and Export of Nutrients...................................... 57
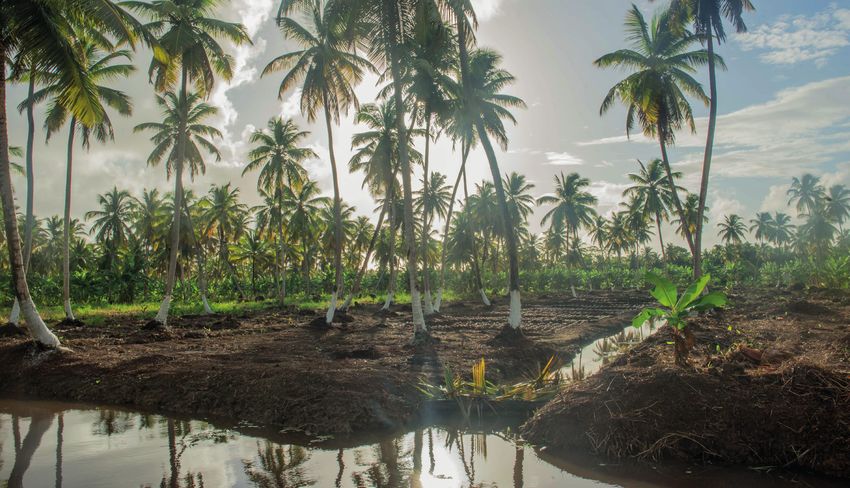
Agronomy Capital Advisors Limited Disclaimer............................... 59 Brazilian Green Dwarf plantation, Luiz Mirisola Fihlo, Touros, Rio Grande do
Norte, Brazil
Agronomy Capital Advisors Limited January 2019 3
Executive Summary – A Seismic Divide
   Agronomy Capital Advisors Ltd (ACAL) has sought to provide an               of unproven genetic provenance, and managed by ageing (and
   analysis of the global coconut producer sector. While the data are not      ‘unbankable’) farmers, many of whom live below the poverty line,
   available to compare operational and financial efficiencies by corporate    achieve an average yield of 4.8 MT of coconuts per hectare annually.
   producers across the sector, we have focused the operational and            In the case of the Philippines, with the world’s largest production
   sector differences between Brazil (with a spotlight on that country’s       area, the yields are lower at 3.9 MT/Ha. As ‘price takers’, achieving
   agro-industrial and vertically integrated producers) and the major          (typically) between US$0.071 cents and US$21 cents ($0.30 cents
   global producer countries Indonesia, the Philippines and India.             per nut at the very best), these farmers are not incentivised typically,
   The findings have been stark. In comparison with a well-funded,             to invest in fertilisers or crop protection systems, or in high yielding
   progressive and vertically integrated agro-industrial coconut producer      planting material (even if they could access such). For some the
   sector, which has been developing in Brazil since the second half of        production of coconuts is a secondary activity and ‘orchards’ may
   the 20th Century, but which has picked up significant pace in the           be no more than rows of palms planted along farm boundaries or
   21st Century in tandem with the global surge in demand for modern           around homesteads. Frequently, depending on farmgate ‘collectors’,
   coconut products, almost the entirety of the global producer sector         farmers receive the lowest value for the coconut along the value
   is structurally constrained by the dominance and central importance         chain, and for much of the production across Asia, there has been
   of smallholders, in some cases producing coconuts as a secondary            a traditional focus on low value products such as copra, coconut oil
   activity. However, in Eastern Sumatra, in the province of Riau,             and coconut meal. Near impossible logistics, and local processing
   dispersed smallholder production has been integrated seamlessly into        facilities which may be basic and even unsanitary, precludes any
   a massively scaled industrial economic activity. The Sambu Group, an        opportunity to address high value end user markets. Remarkably,
   Indonesian family business, has established a fully integrated value        whereas some 50% of the population of the Philippines and more
   chain business in the production and supply of coconut products to          than 25 million Indonesians, are thought to depend directly or
   some 150 countries around the world, receiving and processing circa 5       indirectly on the coconut industry, in both countries, the sector
   million coconuts per day at three industrial scaled plants in the region.   appears to lack strong official support; in the Philippines there is
   At 5 million nuts per day processed, the Sambu Group processes more         even political impatience with the sector. The contrast with the
   than 3x the volume of coconuts of its nearest rival, Franklin Baker in      modern agro-industrial Brazilian sector could not be greater.
   the Philippines.
                                                                               Modern coconut production in Brazil, as exemplified by names like
   Very small (less than 1 hectare) and widely scattered, subsistence farms    Aurantiaca, Ducoco, and Sococo (all with proprietary plantations),
   across Asia, (Indonesia, the Philippines and India which between them       CocoSamba, Coco do Vale, and others (drawing off 3rd party
   account for more than 70% of the global coconut crop), characterised        producers), is based on vertical integration of the value chain.
   by ageing, low yielding coconut palms (most commonly Tall varieties)        Processing facilities, designed to extract maximum value from

Agronomy Capital Advisors Limited                                      January 2019                                                                       4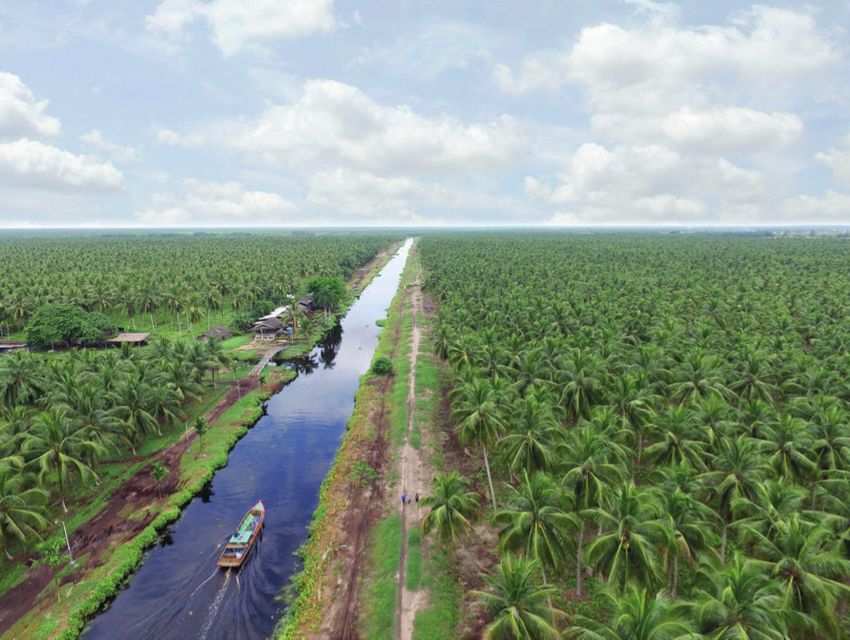
the coconut feedstock, are located within easy transport reach                                    coconuts (as established across Asia) is very substantially based on a
   of the plantations. Modern plantations are being architected for                                  ‘price taking’ model: while largely informal, price data confirms that
   technologically based farming, with advanced irrigation systems and                               smallholder farmers in Indonesia and the Philippines are receiving
   high yielding varietals, purpose bred for specific product niches. A well-                        between US$0.07 to US$0.21 (India and Vietnam appear to be higher
   funded state agricultural research agency, Embrapa, provides indirect                             at up to US$0.30 per nut, from time to time). For processors the
   support to the industry with development of planting materials and                                cost of goods may be nearer to US$0.15-US$0.30, once payments to
   supportive technologies. Importantly too, the modern Brazilian sector                             aggregators and logistics costs are included, but some are likely able to
   has access to a significant domestic market for higher value coconut                              still acquire raw materials at nearer to US$0.10 per nut, adjusting the
   products, a sophisticated modern distribution network, and access to                              price of nuts to the international price for coconut oil. Across the big
   capital via private wealth and commercial banks.                                                  three Asian producer countries, it is not unfair to describe the coconut
                                                                                                     supply model as stagnating and structurally impaired, with the Sambu
   While we have not been able to drill down into the cost of production                             Group’s globally scaled operations in Riau Province, Sumatra a notable
   for specific commercial producers in Brazil, local intelligence indicates                         exception. By contrast with the Asian model (ex-Sambu Group), the
   that the cost of production per nut on professional farms, may vary                               modern Brazilian producers look to have a competitive lead on most
   from US$0.053 to US$0.123 for Dwarf production and US$0.084                                       other producers in the world.
   to US$0.211 per nut for Hybrid production. The world market for

      Source: Brazilian Green Dwarf plantation, Luiz Mirisola Fihlo, Touros, Rio Grande do Norte, Brazil

Agronomy Capital Advisors Limited                                                          January 2019                                                                          5
Modern Demand Drivers
   Every so often a new dietary fashion captures the popular imagination.                 between packaged coconut water from mature nuts (mostly) and
   Whether it is blueberries, kale, goji berries, or high cocoa content dark              green nuts, and fresh coconut water, direct from green or immature
   chocolate, health and dietary commentators have a history of hyping                    nuts (mostly) and in some cases mature nuts. This range extends from
   the qualities of one fruit or vegetable, to elevate its desirability in the            the Reuters reported global value of $6bn, to sundry other estimates
   minds of consumers. One such phenomenon, born of this century,                         ranging from $3.0bn and upwards. What is not in question is that
   has been coconut water. The growth in demand for packaged coconut                      this market has developed primarily, since the turn of the present
   water has been attributed to the appeal of the product to ‘Millennial’                 century. Demand for packaged coconut water (the modern product,
   consumers; the research and consultancy firm New Nutrition Business                    distinct from drinking fresh coconut water direct from the nut at or
   was reported to have remarked that ‘Millennials’ perceived coconut as                  near the site of production), has been driven by so called ‘Millennial’
   “a naturally healthy food”. 1                                                          consumers, who are reputed to be focused on healthier, natural
                                                                                          products with an ethical provenance. The $6.15bn market estimate for
                                                                                          2017 compares with a similar estimate (by Euromonitor International)
   Packaged Coconut Water                                                                 of $6bn for the global packaged water market in 2019.3 Euromonitor’s
                                                                                          estimate was contrasted with a global market value of $1.9bn in 2014.
   The marketing of coconut water, and its appeal to consumers has                        These various data indicate that the market for packaged coconut
   focused on its dietary, health and functional benefits. Amongst the                    water has been exceeding growth expectations. If there was early
   nutrients it contains, are vitamins, minerals, amino acids, antioxidants               phase concern that the ‘craze’ for the beverage would peter out, these
   and enzymes. The product is said to represent a rich source of such im-                data imply that the product line is now well entrenched in consumer
   portant minerals as potassium, calcium and magnesium, in addition to                   purchasing patterns.
   the trace elements iodine, zinc, sulphur, selenium, manganese, boron
   and molybdenum. In June 2018 Reuters published an article reviewing                    According to the research report referenced by Reuters, “…the global
   a market outlook study of demand for packaged coconut water: “The                      production of coconut water will increase from 1,138.32 Million Litres
   worldwide market for Coconut Water is expected to grow at a CAGR of                    in 2011 to 2,310.08 Million Litres in 2016 at an average annual growth
   roughly 14.4% over the next five years, will reach 13,800 million US$ in               rate of more than 15.00%”. Definitions are important: packaged water
   2023, from 6,150 million US$ in 2017, according to a new GIR (Global                   (as opposed to coconut water consumed fresh from the nut), narrows
   Info Research) study”. 2                                                               the category.US market leader Vita Coco, sells in Walmart at circa $5.17
                                                                                          per litre, at which price a global market of $11.9bn would be implied.
   ACAL notes that there is a wide range of projections for the size of the
   market today and its growth rates, most likely based on the distinction                Green coconut water is produced from green, immature coconuts,
   1      Food Navigator.com 31st August 2017; Katy Askew
   2      https://www.reuters.com/brandfeatures/venture-capital/article?id=38929          3       The Grocer (25th August 2016; Julia Glotz)

Agronomy Capital Advisors Limited                                                  January 2019                                                                      6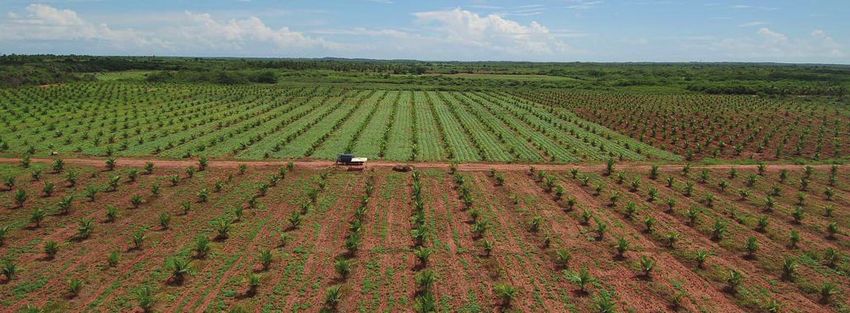
6-7 months of age. This product must be drunk within 10 days of             Jax Coco coconut water is packaged in chic, stylish glass bottles. The
   harvesting, or packaged aseptically, most commonly in Tetrapak              brand was created by renowned U.K. designer Alasdhair Willis the
   containers. In 2016 Vinay Chand Associates (VCA) estimated that the         creative director of Hunter - a British heritage brand, and previously
   green water segment had an annual value of circa US$600 million at          publishing director of Wallpaper, the Time Warner magazine focused
   retail. VCA was of the opinion that the majority of these coconuts were     on design, architecture, fashion, travel, art, and lifestyle.
   consumed in the source countries as a component of the ordinary diet.
   The market is mostly informal, and these nuts (sold for drinking) are       The brand promise could not have come at a better time. As reported
   typically significantly cheaper than packaged mature coconut water          in The Grocer (25th August, 2016) “In August 2014, an explosive doc-
   products, notwithstanding that green coconut water is considered            ument appeared on the website of US juice supplier ITI Tropicals. The
   to be very much superior to water from mature nuts. VCA estimated           company (ITI Tropicals) had hired an independent consultant…to run
   that if this segment was to be priced at global retail market levels, the   tests on 20 coconut waters on sale in the US…to look for undeclared
   combined segment of mature packaged water products and green                sugars and preservatives – and it found plenty…twelve out of twenty
   water / fresh immature nuts for drinking, would be equivalent to            contained added sugar not declared on the label; two had undeclared
   circa $5bn. This correlates closely with the $6bn market referenced         preservatives”.
   by Reuters (above). Packaged coconut water by contrast may also be
   sourced from mature nuts of 10 months or older. Water produced from         Jax Coco surveyed a sample group of millennial consumers, identifying
   these nuts is typically a co-product associated with the production of      that amongst this consumer cohort:
   desiccated coconut. While considered to be an inferior product (from
   consumer experience) than green coconut water, this segment has               •            30% sought products with no artificial flavours
   dominated the market place.                                                   •            29% sought products with no artificial colours
                                                                                 •            24% sought products that were certified organic
   The growing appetite of populations around the developed and devel-           •            20% sought products that were certified sustainable and
   oping worlds for packaged coconut water has transformed the status of       		             Fairtrade.
   this ‘tree’ crop, and it has created an appetite for other modern coco-
   nut products including virgin coconut oil and coconut ‘dairy’ products      Amongst other research sourced by Jax Coco, it identified that 42%
   including ‘milk’ and ‘cream’.                                               of global respondents stated that they were prepared to pay a premi-
                                                                               um for products made with organic or all-natural ingredients. These
   Jax Coco – The Chicest Coconut Water (Vogue)                                findings informed the development of the Jax Coco product ethos and
   Jax Coco, launched in Hong Kong and London in 2012, was conceived           product portfolio. Jax Coco’s product story is built around its origin in
   to win consumer trust and loyalty with a premium product, entirely          the volcanic region of Southern Luzon, and its all-natural, low calorie,
   natural and unadulterated, and stylishly packaged. The company’s            hydrating properties. The brand is positioned alongside other premium
   website observes that Jax Coco unites “the best coconuts with chic,         beverage brands such as Evian, San Pellegrino and Fever Tree, and is
   minimalist design”. Sourced from the South of Luzon in the Philippines,     distributed through a variety of upscale outlets including such iconic

Agronomy Capital Advisors Limited                                      January 2019                                                                        7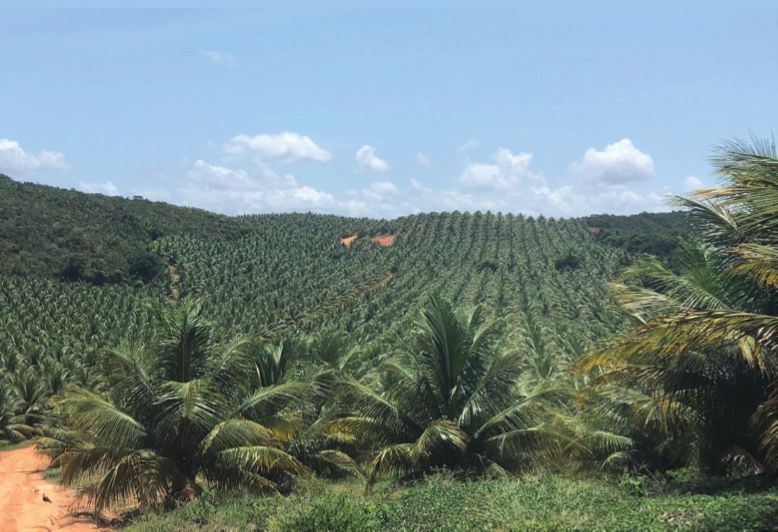
names as Claridges (London) Mandarin Oriental (London, Paris and                 to energy and other metabolites rather than being stored as fat. Such
   Hong Kong), Selfridges and Harvey Nichols (London), The Four Seasons             metabolites can be used by extra-hepatic tissues, such as the brain and
   (Hong Kong), The Ritz (Paris).                                                   heart, as an immediate form of energy. (BBC Good Food website). As
                                                                                    detailed on http://www.med-health.net/Coconut-Milk-Benefits.html,
                                                                                    one cup of coconut milk or 240g contains the nutrients below.
   Coconut Milk -Dairy Alternatives
   According to Future Market Insights, the conventional coconut milk
                                                                                                Minerals                          Vitamins
   segment, (as opposed to the ‘organic’ segment) was estimated to be
                                                                                                Calcium             38.4mg        Vitamin C       6.7mg
   valued at more than US$600 million at end 2017 and was expected to
                                                                                                Magnesium           88.8mg        Vitamin E       .4mg
   increase at a CAGR of 7.0% over the period to 2027, to reach a market
   valuation of more than US$1,100 million. Revenue from the organic                            Potassium           631mg         Vitamin K       .2mcg
   coconut milk segment was expected to increase at a CAGR of 8.2%                              Phosphorus          240mg         Niacin          1.8mg
   during the forecast period and was anticipated to be valued at more                          Iron                3.8mg         Folate          38.4mcg
   than US$220 million in 2017, and projected to reach a market valuation                       Zinc                1.6mg         Vitamin B6      .1mg
   in excess of US$500 Million by the end of 2027.4                                             Copper              .6mg          Thiamine        .1mg
                                                                                                Manganese           2.2mg         Others
   A Multi-segmented Product Sector                                                             Selenium            14.9mcg       Carbohydrates 13mg
   Readers should note that the coconut milk market is bifurcated be-
   tween milk used for cooking, typically to make sauces, (an important                         Fat                               Fiber           5mg
   dietary feature across Asia), and coconut milk as a nutritious beverage.                     Total Fats          57.2 g        Proteins        5mg
   Market sources inform ACAL that in China, coconut milk consumption
   is as much as 10x greater than consumption of packaged coconut wa-                           Saturated Fats      50g           Calories        552
   ter.                                                                                         Omega-6 Fatty
                                                                                                                    626mg         Sodium          36mg
   Coconut Milk Nutrition                                                                       Acids
   Coconut flesh is highly nutritious and rich in fibre, vitamins C, E, B1,                     Monounsaturated
                                                                                                                2.4g              Cholesterol     0mg
   B3, B5 and B6 and minerals including iron, selenium, sodium, calcium,                        Fats
   magnesium and phosphorous. Because coconut milk is lactose free, it                          Source: http://www.med-health.net/Coconut-Milk-Benefits.html
   can be used as a milk substitute by consumers with lactose intolerance.
   Coconut milk is reputed also as a source of energy boosting lauric
   acid. Detailed studies have shown that the majority of ingested lauric
   acid is transported directly to the liver where it is directly converted
   4      https://www.futuremarketinsights.com/reports/coconut-milk-market

Agronomy Capital Advisors Limited                                            January 2019                                                                      8
To manufacture coconut milk and coconut cream, coconut flesh is                   beverage market in 2015, but noted that soy milk could be surpassed
   grated and soaked in hot water. As the coconut cream rises to the                 by the ‘other’ non-dairy milk segment by 2017 and coconut milk by
   top, it is skimmed off. The remaining liquid is squeezed through a                2018, as consumers looked to other plant-based beverages.
   cheesecloth to extract a white liquid that is coconut milk. By repeating
   this process, the coconut milk becomes thinner. The thicker version is            Food and beverage market specialists, like Packaged Facts, indicate
   used for desserts and rich sauces. Thin coconut milk is used for cooking          that plant-based dairy alternatives are commanding increasing
   curries and soups. Coconut milk is widely used across the food industry           attention from consumers. The 2015 report from Packaged Facts
   for enhancing the flavour, aroma and the nutrient content of food.                observed that “…consumers are clearly intrigued by other plant-based
                                                                                     beverages that are being introduced in greater number including
   During this century, global demand for coconut milk has been                      those made from cashew, quinoa, sunflower and flaxseed…”. Market
   increasing owing to a growing focus on health, and rising consumer                leaders in the category include WhiteWave Foods (US), Pure Harvest
   interest in vegan diets and dietary alternatives. In particular, consumer         (Australia), Goya Foods, Inc. (US), McCormick & Company (US),
   interest in dairy alternative, plant-based beverages have seen coconut            Theppadungporn Coconut Co. Ltd. (Thailand), Native Forest (US), and
   milk evolve from simply being a cooking ingredient to becoming a                  Ducoco Produtos Alimenticios S/A (Brazil). According to the Packaged
   health drink and beverage alternative. Coconut milk has become                    Facts report, Denver-based WhiteWave Foods, now owned by Danone
   popular with vegans, seeking dairy substitutes, in which category it              had the largest share of the market at 13% of overall sales, as well as
   competes with a range of plant-based alternatives including soya milk             a 22% of the shelf-stable market. Nestlé and Dr Pepper/Snapple were
   and almond milk.                                                                  also reported to have double-digit shares in the shelf-stable market.

   Dairy Alternatives Market Segment
   As reported by Amanda Del Buono (November 10, 2016)5 , Packaged                   Virgin Coconut Oil
   Facts, a Rockville, Md.-based market research firm, projected (in 2015)
   that the dairy and dairy alternative beverages market would reach                 According to a report by Goldstein Research6, the global virgin coconut
   $31.5 billion by 2019, up by about a third from circa $23.8 billion               market is expected to increase at a CAGR of 9.8% over the period
   in 2015 “Dairy and Dairy Alternative Beverage Trends in the U.S.”                 2016-2024. Growing over the period from US$2.1 billion in 2016 to
   Projecting a compound annual growth rate (CAGR) for the five-year                 reach US$ 4.2 billion by 2024. The report observed that this growth
   period [2015-2019] of 5.8%, the research consultancy attributed this to           was expected to be driven by rising consumer interest in natural
   the expected introduction of new and innovative products, and to the              beauty products. Indicative of the segment’s appeal to modern,
   widespread penetration of premium products in the market. Chicago-                younger consumers, the global market for organic virgin coconut oil
   based Mintel in its April 2016 “Non-Dairy Milk – US” report, noted                is projected to reach a market value of US$1.28 billion at a CAGR of
   that soy milk made up approximately 19.3% of the dairy alternative                10.98% by 2022. Asia Pacific is anticipated to account for a major
   5        https://www.bevindustry.com/articles/89751-almond-coconut-cash-          6        https://www.goldsteinresearch.com/report/virgin-coconut-oil-market-out
   ew-milks-gain-in-dairy-alternatives                                               look-2024-global-opportunity-and-demand-analysis-market-forecast-2016-2024

Agronomy Capital Advisors Limited                                             January 2019                                                                             9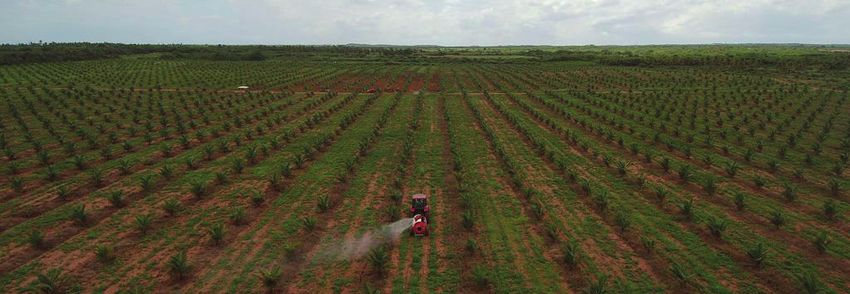
market share of more than 95% during the forecast period.7 The report                      purification has fuelled the market demand over the years to come”.
   cited as key players in the sector: Nutiva, Inc. (U.S.), Celebes Coconut                   Reporting on the Energais report, Global Newswire observed that “…
   Corporation (the Philippines), Greenville Agro Corporation (the                            high end research and development is underway in order to develop
   Philippines), Earth Born Company Ltd. (Thailand), Vita Coco (U.S.), Farm                   new uses of activated carbon. Various key industry experts have been
   Direct Coconuts (U.S.), Parker Biotech Private Ltd (India). In 2016, VCA                   focusing on the use of activated carbon in food products that can
   noted that demand for virgin coconut oil was then growing at some                          cleanse or detoxify the body. These activated carbon food products
   35% pa, being a relatively new product segment manufactured from                           such as black ice cream, black burger buns, black smoothies and black
   fresh coconuts as opposed to dried coconut flesh, more commonly                            cheese, have recently witnessed a rise in social media coverage”.
   known as copra.
                                                                                              According to the Energais report, the coconut shell segment of the
                                                                                              active carbon products market, is expected to account for a significant
   Activated Carbon Products                                                                  share of the market owing to its widespread use. The most commonly
                                                                                              used raw materials in the manufacture of activated carbon include coal
   According to a report published by MarketsandMarkets™, the global
                                                                                              (bituminous, sub-bituminous, lignite and anthracite), coconut shells,
   activated carbon market was valued at US$ 4.74 billion in 2015, and is
                                                                                              wood-sawdust (soft as well as hard) and peat. However, various other
   projected to reach US$ 8.12 billion by 2021, at a CAGR of 9.4% from                        raw materials have been identified for the manufacture of activated
   2016 to 2021. The market size in terms of volume was 2,743.4 kiloton
                                                                                              carbon such as walnut shells, olive stones and palm kernels but their
   in 2015 and is projected to reach 3,587.9 kiloton, by 2021, at a CAGR                      commercial application is limited due to their supply. Coconut shells,
   of 8.4% from 2016 to 2021. In this study, 2015 has been considered the                     being a renewable source of carbon offer hardness and low dust
   base year, 2016 as estimated year and 2021 as the forecasted year to                       generation along with high resistance to abrasion. Therefore, the use
   estimate the market sizes of activated carbon.                                             of coconut shells in the production of activated carbon products is
                                                                                              expected to increase.
   An August 2018 report by Energias Market Research projected that the
   global activated carbon market is projected to witness a CAGR of 12.1%                     Activated carbon may be made available in different forms such as
   over the period 2017-2024. Energias noted that “The industry is likely                     granular, powdered, impregnated, extruded, woven, polymer coated
   to expand from USD 4.2 billion in 2017 to USD 10.2 billion by 2024. The                    and more. Among these the granular activated carbon offers high
   growth can be primarily attributed to the increasing use of activated                      adsorption that makes it ideal for removing contaminants from air,
   carbon for addressing the concerns regarding mercury emissions. The                        water, liquids and gases. Granular activated carbons have relatively
   growing environmental concern for pollution control has fostered the
                                                                                              larger particle size as compared to powdered ones. In addition,
   use of activated carbon for reducing mercury emissions from power
                                                                                              these activated carbons can be used for liquid as well as gas phase
   plants. Also, rising investment in the use of activated carbon for water
                                                                                              applications, thereby driving the market demand.
   7        http://www.abnewswire.com/pressreleases/global-organic-virgin-coconut-oil-mar-
   ket-2018-to-reach-valued-at-128-billion-and-grow-at-a-1098-cagr-forecast-to-2023_176720.   Asia Pacific emerged as the leading regional market owing to the
   html.

Agronomy Capital Advisors Limited                                                      January 2019                                                                     10
rapid industrialization along with the initiation of various stringent
regulations so as to address the rising environmental concerns. Also,
The Traditional Coconut Economy
the growing demand from countries such as China, Japan and India, Consumers’ engagement with coconuts has traditionally taken one of
has significantly contributed to the market growth in the region. four principal forms:
Moreover, its increasing application in the food and beverages industry,
the pharmaceutical sectors and water and air purification, have all 1. Fresh coconuts as a fruit, predominantly in source countries
contributed to demand growth for the category.8 2. Desiccated coconut for use in baking and food preparation – a
global product
Activated carbon, also called activated charcoal, is a form of carbon 3. Coconut oil as a dietary product (and not without some
processed to have small, low-volume pores that increase the surface controversy as detailed in the paragraph below)
area available for adsorption or chemical reactions. According to 4. Coconut oil as the principal oil in body care products and cos
Wikipedia,” Due to its high degree of micro-porosity, one gram of metics.
activated carbon has a surface area in excess of 3,000 m2 (32,000
sq ft) as determined by gas adsorption. An activation level sufficient
for useful application may be obtained solely from high surface area. Coconut Oil
Further chemical treatment often enhances adsorption properties”. Coconut oil is about 90% saturated fat, which is a higher percentage
Adsorption is the process in which atoms, ions or molecules from than butter (about 64% saturated fat), beef fat (40%), or even lard (also
a substance (it could be gas, liquid or dissolved solid) adhere to a 40%). Coconut oil is considered to be very effective at boosting levels
surface of the adsorbent. The Indonesian producer of activated of “good” HDL cholesterol. But dietary advisors in the late 20th Century
carbon products from coconut shell, PT Freeman, notes on its website: and into this century have argued for the sparing use of coconut oil
“Activated carbon is an amorphous form of graphite with a highly in the diet, citing concerns about its possible contribution to heart
developed internal pore structure that gives the material its unique disease and promoting as more ‘healthful’, vegetable oils such as olive
adsorptive properties”. oil and soybean oil, which are mainly unsaturated fat and which lower
the LDL and increase the HDL forms of cholesterol.9 From an economic
The natural hardness of coconut shell renders derived carbon highly perspective, the production of coconut oil from copra, and its co-
resistant to physical breakdown through attrition. PT Freeman product, coconut meal has been described by Mr Vinay Chand of Vinay
produces activated carbons from coconut shell using a steam activation Chand Associates (VCA), as “a pursuit to keep farmers in poverty”.
technology in rotary kilns. According to Chand, the coconut sector’s most traditional product
segment, copra, should be reviewed and its production downscaled (a
view echoed in this report by various commentators in the Philippines).
The dried flesh of the coconut is used for the production of coconut oil
8 Global Activated Carbon Market Outlook, Trend and Opportunity Analysis, Competi- and coconut meal, but the profile and economics of both commodities,
tive Insights, Actionable Segmentation & Forecast 2024
9 http://www.health.harvard.edu/staying-healthy/coconut-oil
Agronomy Capital Advisors Limited January 2019 11render them less competitive than palm oil products and soya bean In the period January-December 2017, BPS-Statistics Indonesia
meal. recorded that export volume of desiccated coconut from Indonesia was
98,038 MT. This was higher by 23.7% compared to the volume of the
Desiccated Coconut same period in previous year. The export level was even higher than
Desiccated coconut is a dried (a maximum of 3% moisture content), that of 2014’s volume which was 86,797 MT Asia and Europe are the
grated and unsweetened fresh kernel or meat of a coconut’s mature principal markets for desiccated coconut from Indonesia. 49.2% out of
fruit. It is used as an ingredient in food manufacturing and home 98,038 MT desiccated coconut from Indonesia was shipped to Asian
cooking. Desiccated coconut is predominantly produced in the countries. Europe absorbed 32.5% of Indonesia’s desiccated coconut
Southeast Asian producer countries, and is traded worldwide. Since exports. The global market for desiccated coconut is estimated by ACAL
the ingredient is used in food industries such as bakery, confectionery, at between US$800 million to US$1 billion annually.
culinary, beverages etc., the growth and demand for desiccated
coconut has a high correlation with the performance of the above- Coconut Milk
mentioned food industries. Attributed to its low cholesterol or trans- The processing of mature coconuts for the production of coconut milk
fats content while rich in a variety of essential nutrient contents which is dominated by consumption within the source countries where it has
includes dietary fibre, copper, manganese and selenium, the product traditionally been used for culinary purposes and as a drink (packaged
has witnessed increased demand during this century. The global whole coconut milk and skimmed milk). Coconut milk is also highly
segment is described as fragmented with numerous manufacturers suitable for the production of coconut ice cream and coconut yoghurt.
operating over a number of regional markets. The category can be In 2016 VCA estimated that the international market for packaged
segmented on the basis of cut: regular cut, fine cut, medium cut, super coconut milk products was then relatively mature with a retail value of
fine cut, fancy cut, chips, flakes, threads and shreds. $400m pa. The market has proven to be anything other than mature.
Chand opined that the market for fresh coconut milk products (in the
During 2017, the price of desiccated coconut, in the main producer source countries) could be 10x larger than the packaged segment.
countries, Philippines and Indonesia, was relatively stable at annual
average of US$2,537/MT and US$2,409/MT respectively. Coir
Rubberised coir is derived from the husks of mature coconuts. Coir can
In 2017, official data from the Philippines Statistics Authority, indicated be rubberized for use in mattresses for which there is strong demand
that in the period January to November 2017 108,561 MT were ex- in Asia. In 2016 VCA estimated that the segment had a factory gate
ported, which was 33.7% higher than previous year’s volume for the value of circa $1bn annually and a retail value of perhaps $2bn. Chand
same period. North America and Europe remain major destinations for noted however, that only 17% of the annual crop of coconut husks was
desiccated coconut from the Philippines accounting for more than 82% then used in the manufacture of coir, but the consultancy observed
of the total export. In Asia, China, Korea and Malaysia were amongst that demand had increased strongly (by an estimated 50% in the
the largest importing countries of the product from the Philippines. period 2012-2015).
Agronomy Capital Advisors Limited January 2019 12Profile of The Global Coconut Production Sector
Coconut is one of the most important palm crops of the tropics Table 1
with over 12 million hectares planted with the crop in more than 90 Coconut Production 2016
MT Nuts Produced Hectares Harvested
countries. Data
Indonesia 17,722,429 3,105,259
Coconut withstands conditions considered to be marginal for many Philippines 13,825,080 3,565,059
other crops, and its considerable hardiness contributes as a stabilising India 11,127,898 2,155,749
factor in the farming systems of marginal and fragile environments. The Brazil 2,649,246 234,012
Philippines, Indonesia and India produce more than 70% of the world Sri Lanka 2,520,095 408,918
crop, for an average yield in metric tonnes of nuts at 4.8 per hectare.
Viet Nam 1,469,960 146,835
Some 95% of the crop is produced by an estimated 10 million resource-
Papua New Guinea 1,191,438 207,679
poor smallholder and sharecropper families, on smallholdings under
Mexico 1,157,481 183,637
4 ha, and most frequently under one hectare. Sources, including Oil
World and the Coconut Statistical Yearbook of the APCC, estimate that Thailand 815,406 177,063
one third of the global crop is consumed fresh, with 70% of coconuts United Republic of Tanzania 555,836 732,189
utilised within country of origin. Sub-Total 53,034,869 10,916,400
World Total 59,012,581 12,168,799
Five countries produce more than 80% of the global coconut harvest. Top Ten as % of World 89.90% 89.70%
Four of these countries are relative neighbours, extending in an Yield (MT/Ha) For Top 10 4.86
arc from the South West coastline of India with the Arabian Sea, Source: FAOSTAT 2016/ACAL
to Sri Lanka in the Indian Ocean, and then East to Indonesia and
MT/Ha to 10.0. In all the 10 countries listed in the table, account for
the Philippines which is flanked by South China Sea on its Western
90% of the global harvest of coconuts, but the top 5 names are hugely
coastline, and Pacific to the East. These producer countries are also
dominant.
the largest consumers of coconuts in the world, with collectively some
58% of production being consumed domestically. Brazil sits apart, the
Growth in world supply has exceeded 15% during the period 2000-
leading producer in the Americas, 4th ranked for supply of the global
2016 (inclusive), but this growth has been overwhelmingly a feature
crop.
of the top 6 producer countries, accounting for nearly 97% of the
increased tonnage. Leading producer Indonesia, was surpassed by
Of the other countries listed in Table 2, Viet Nam is noteworthy for
India in terms of total tonnage increase, while Viet Nam turned in the
its growth during this century and its apparent ambition. Production
largest percentage gain at 66%. The Philippines lagged the sector, with
has expanded by 66% since 2000 and yields have widened from 6.3
growth nearly 9 percentage points lower than the world average.
Agronomy Capital Advisors Limited January 2019 13Table 2 rate within the top 10 producer countries this century, and warrants
Coconut Production being taken seriously as a new producer. Vietnamese farmers have a
2016 2000 Change (%) Increase (MT) reputation for entrepreneurial drive, as demonstrated by their success
(MT)
in the global coffee and black pepper (33% of the global production
Indonesia 17,722,429 15,240,000 16.30% 2,482,429
of black pepper 2014) sectors. Vietnam, was the second largest coffee
Philippines 13,825,080 12,994,654 6.40% 830,426
producer in 2017, accounting for roughly 20% of the world production,
India 11,127,898 8,350,000 33.30% 2,777,898
behind Brazil with 36%. In the context of the coconut sector however,
Brazil 2,649,246 1,952,117 35.70% 697,129 the structure of the Vietnamese sector is small farmer focused, and
Sri Lanka 2,520,095 2,353,000 7.10% 167,095 distinctly different from the Brazilian model.
Viet Nam 1,469,960 884,800 66.10% 585,160
Sub-total 49,314,708 41,774,571 18.00% 7,540,137 According to a 2009 report by the Prosperity Initiative: 'Coconuts in
World 59,012,652 51,225,627 15.20% 7,787,025 the Mekong Delta', the Mekong Delta is the centre for the coconut
Source: FAOSTAT 2016/ACAL industry in Vietnam, and Tinh Ben Tre is the hub for the industry in
the Mekong Delta. The total production area in the Mekong Delta
Amongst the wider data, those for Thailand (see Table 1) were stood at some 110,000 ha in 2009 and was then, more than 75% of
surprising with negative growth of nearly 55%: 2016 production of the total coconut area of 130,000 ha. Today, Tinh Ben Tre is reported
815,000 MT contrasts with more than 1.8 million MT in 2000. Coconut to have some 72,000 hectares of coconut plantations with an annual
is grown mainly in the southern and central plain part of Thailand. production volume of 600 million coconuts. The report indicates that
The production area in Thailand has declined mainly due to a growing the development of the coconut industry was targeted as a major
shift to oil palm cultivation, which gives better yield and higher farm priority by the provincial authorities in the Mekong Delta, resulting in
gate price. Approximately 60% of coconuts produced are sold in the the establishment of an industry association and a multi-stakeholder
domestic market. There is limited data on how these nuts are utilized. industry strategy development process including farmer outreach and
Around 25% of total nuts are sold to factories for processing. There sector research. Reports confirm that Chinese demand for Viet Nam’s
is limited information to identify the volumes of final products and coconuts has been a major influence on the pricing and structure of
utilization of these products – although most are understood to be the domestic industry, with a number of processors being put out of
processed by integrated food processors as an ingredient into a wide business, unable to pay the prices offered by Chinese traders. Reports
array of food products as well as some specific coconut products. from mid-2018 (Fresh Plaza, the leading portal for the fruit sector)
The remaining 15% are processed into coconut milk. Some estimates suggest that a hiatus in Chinese buying has disrupted pricing; then
suggest that Thailand may account for 20%-40% of global coconut milk around US$0.145 per nut whereas as high as US$0.25 earlier in the
production. year.
Along with Thailand, Viet Nam also deserves a mention, for the
opposite reason. The country has recorded the highest expansion
Agronomy Capital Advisors Limited January 2019 14An Informal Smallholder Dominated Sector coconuts. Dr Ponciano Batugal, Chairman, Technical Working Group,
Asian and Pacific Coconut Community (APCC) argues that “If farmers
The relative stagnation of coconut productivity and expansion across do not earn more, they will not plant more coconuts…over 50% of
much of Asia-Pacific and the African tropical belt, reflects the informal the coconuts in the world are senile and unproductive and about 700
and unreformed nature of this crop: more than 96% of coconut farmers million coconut trees need to be replanted urgently”.
are smallholders tending 0.5-4.0 (at most) hectares. These farmers are
thought to earn circa USD500/ha/yr. The data presented in Chart 1, below, show sluggish progress in the
case of Indonesia and India over the period under review, but decline
Data for farmgate prices (largely informal data) indicate: in the case of the Philippines. These yield data for the world’s three
largest producers of coconuts have significance for the supply outlook,
• US$0.071 - 0.21 Indonesia and they are in sharp contrast to the reported yield profile for the very
o October average price APCC website: US$0.14 much smaller, fourth placed producer, Brazil.
• US$0.18 Philippines
o October average price APCC website: US$0.149 Chart 1
• US$0.145 – 0.25 Viet Nam
• US$0.30 India
o October/Kerala average price APCC website:
US$0.597
o Prices at all time high due to cost increases being
passed on
• US$0.15-0.30 Brazil.
Smallholder farmers typically do not have access to investment capital,
nor to the planting materials, technologies and mechanization, to
optimize productivity. This sector frequently lacks managerial skills
and has effectively, no direct access to markets for value-added
products. Despite the potential uses of the coconut and production
and use of high-value products in the food, non-food, nutraceutical,
cosmeceutical, pharmaceutical and biofuel industries, smallholder
coconut farmers generally do not benefit proportionally from these
opportunities, as upstream, small-scale suppliers of raw materials to
Source: Presentation by Dr Pons Batugal, President & Board Chair, Farmers Community
aggregators and or processors. Although such farmers may live below Development Foundation International, National Coconut Conference, August 2018, Ipoh,
the poverty line, they are not incentivised to invest in planting more
Agronomy Capital Advisors Limited January 2019 15Consider the relative performance of Brazil to the big three producers the global crop, has like India (18.9% of global crop), increased its
in the Table below, which compares FAOSTAT coconut production planted area by more than 200%, but yield gains have been modest
data for 1961 with 2016. Over the intervening 55 years Brazil has at 14% and 12% for Indonesia and India respectively. The Philippines,
achieved a truly massive increase in production on a very much however, which produced 23.4% of the global crop in 2016, has seen
smaller area expansion (than any of its peers), for yield gains of nearly a decline in coconuts per hectare output, of 7.4% over the period,
500%. Indonesia, the world’s largest producer of coconuts, at 30% of notwithstanding an increase of almost 200% in planted area.
Table 3
FAOSTAT 2016
1961 Data Element Unit Value 1961 Data Source Change (%)
Data
Brazil Area harvested Ha 143,000 FAO estimate 234,012 63.60%
Brazil Production tonnes 271,737 Official data 2,649,246 874.90%
Brazil Yield MT/Ha 1.9 11.3 495.80%
India Area harvested ha 723,000 Official data 2,155,749 198.20%
India Production tonnes 3,328,000 Official data 11,127,898 234.40%
India Yield MT/Ha 4.6 5.2 12.10%
Indonesia Area harvested ha 1,130,000 FAO estimate 3,105,259 174.80%
Indonesia Production tonnes 5,650,000 FAO estimate 17,722,429 213.70%
Indonesia Yield MT/Ha 5 5.7 14.10%
Philippines Area harvested ha 1,199,880 Official data 3,565,059 197.10%
Philippines Production tonnes 5,023,200 Official data 13,825,080 175.20%
Philippines Yield MT/Ha 4.2 3.9 -7.40%
Source: FAOSTAT/ACAL
Agronomy Capital Advisors Limited January 2019 16for farmers to focus on the crop, so that palms are not fertilised or
Indonesia – An Informal Producer Sector routinely protected from pest and disease. Without support from
Blessed By Climate government or other agencies, (a recurring theme across Asia)
and extension services largely being absent, farmers are neither
Indonesia produces some 30% of the global harvest of coconuts, yet incentivized financially, nor equipped technically, to prioritize coconut
the production of the crop is perhaps best described as ‘informal’. production. The production of coconuts in Riau Province is different
The coconut production sector in Indonesia is almost exclusively however. While still a small holder crop, the industrialised processing
the province of smallholder farmers, accounting for 99% of the area of much of the region’s production by the Sambu Group, in three
harvested in Indonesia, and 98.9% of the national production (on a plants in Eastern Sumatra, there is a clearly defined ‘coconut economy’.
copra basis). With the Sambu Group processing some 5 million nuts daily, it is a
reliable off-taker for the production of the region’s farmers, making
In some areas, the production of coconuts is a secondary activity, the production of coconuts an economically important and reliable
defined not so much by area planted as by palms per household. revenue source for the farmers.
An Australia Aid review of the Coconut Sub-Sector in East Java and
West Nusa Tenggara (October 2015) noted that: “Coconut plays a The data in Table 4 illustrates dramatically the scale of the smallholder
role as a secondary income source for farmers. Tree ownership is low, segment across Indonesia’s national coconut production platform, with
with typically only 23-46 trees per household. Production is affected the commercial producer segment, at just 1% of area harvested and
by seasonal variation, climate conditions, and stability of the water national crop. Readers will note that there are significant differences
supply…Management practices are generally poor, and farmers between data sources in respect of area specified: the Directorate
rarely make efforts to improve productivity.” The review, which was General of Estate Crops for Indonesia assessed 2016 production area at
conducted under the umbrella of Australia-Indonesia Partnership for 3,566,103 Ha, whereas FAOSTAT lists the harvested area at 3,105,259
Promoting Rural Income through Support Ha, the difference perhaps being immature area.
for Markets in Agriculture (AIP-PRISMA), Table 4
concluded that “Coconut is often cultivated Production Harvest MT (Copra Basis) Harvest By Producer
as a supplementary income source to more Production Area (Ha) By
2017 Estimate Area As % Of 2017 Estimate; Director Category As % of National
Estate Category
traditional crops and is not prioritized by Total General of Estate Crops Harvest
farmers”. Coconuts may be planted along Smallholder 3,507,764 99.00% 2,839,426 98.90%
farm boundaries and around homesteads, Government 3,874 0.10% 2,584 0.10%
rather than in formal cultivations. There is Private Commercial 32,755 0.90% 29,271 1.00%
also a pattern of intercropping with cash Total Production Area
crops such as sugar cane, cacao and cassava. (Ha) & Production (MT 3,544,393 100.00% 2,871,281 100.00%
With farm gate prices low: from IDR 1,500- Copra basis)
3,500 (US$0.15-21), there is little incentive Source: Estate Crops Report December 2016, Director General of Estate Crops
Agronomy Capital Advisors Limited January 2019 17The Indonesian production area is spread across the length of the intake, with 90% deriving from small holder farmers across Riau
archipelago (it all being well-positioned within the Equatorial belt Province. Combined with its processing plant activities, the Sambu
suitable for coconuts 5 degrees north, 10 degrees south), but with the Group provides direct employment for some 21,000 people in the
largest single concentration of 515,130 Ha in Riau Province, Sumatra region.
from whence the Sambu Group, the largest processor of coconuts in
Indonesia and the World, sources coconuts from smallholders across The climate in Riau is tropical, with 109 mm of rainfall even in the
the region. Sambu Group also has a significant proprietary estate driest month (August) when rainfall typically occurs in 17 days of the
running to some 45,000 hectares, planted in one contiguous parcel on month. The wettest months, like May, can record 500 mm of rainfall,
peat land, and marine soils include clay and mud. with precipitation every day. This climate is considered to be Af
according to the Köppen-Geiger climate classification. Sunshine hours
per month range from 137 in November to as much as 288 hours in
August, with temperatures in a range of 28 Celsius to 37 Celsius across
the year, for an average annual temperature of circa 26.9 °C. In a year,
the average rainfall is 2361 mm. These are pretty much ideal climatic
conditions for coconuts, and this will be a major factor in Indonesia’s
ranking above the average for productivity per hectare.
The Köppen climate classification divides climates into five main
climate groups, with each group being divided based on seasonal
precipitation and temperature patterns. The five main groups are A
(tropical), B (dry), C (temperate), D (continental), and E (polar). Each
group and subgroup is represented by a letter. All climates are assigned
a main group (the first letter). All climates except for those in the E
group are assigned a seasonal precipitation subgroup (the second
letter). For example, Af indicates a tropical rainforest climate. The
system assigns a temperature subgroup for all groups other than those
in the A group, indicated by the third letter for climates in B, C, and
D, and the second letter for climates in E. For example, Cfb indicates
Source: PT. Riau Sakti United Plantations an oceanic climate with warm summers as indicated by the ending b.
Climates are classified based on specific criteria unique to each climate
type.
The estate, planted some 30 years ago, is almost certainly the largest
in the world, but only contributes some 10% of Sambu Group’s daily
Agronomy Capital Advisors Limited January 2019 18Table 5
1. 99% of coconut palms belong to smallholder farmers
who are extremely limited in their ability to invest in
Production Area (Ha) by Province 2017 Estimate Production Area As % Of Total
their coconut orchards
Sumatera 1,122,314 31.70%
a. While the smallholder farmers may have been farming
Jawa 813,289 22.90% the same land for centuries, observers note that
Nusa Tenggara + Bali 269,862 7.60% these farms are frequently poorly managed. Moreover,
Kalimantan 199,537 5.60% palm age and productivity may vary significantly.
Sulawesi 766,796 21.60% b. The limited access to capital, that is the reality for
Maluku + Papua 372,595 10.50% smallholder farmers then reflects in maturity profile
Total Area Harvested 3,544,393 100.00% of the national production platform in Indonesia, with
Source: Estate Crops Report December 2016, Director General of Estate Crops (Indonesia)/ACAL nearly 74% of the production area mature, and more
than 12% of the area damaged, thus likely to experience
Table 6 declining yields.
Yield MT / Ha (Copra Basis) By Province 2017 Estimate
MT Nuts / Ha @ 14.5% Chart 2
Copra
Production Area (Ha) by Status of Plantation
Sumatera 0.8 5.8
Jawa 0.8 5.4
Nusa Tenggara + Bali 0.7 4.8 439,552
Kalimantan 0.7 4.7 12%
485,576
Sulawesi 0.8 5.6 14%
Maluku + Papua 0.9 6.5 Mature Area (Ha)
Average National Yield / Ha (MT) 0.8 5.6 Immature Area (Ha)
Source: Estate Crops Report December 2016, Director General of Estate Crops (Indonesia)/ACAL
Damaged Area (Ha)
2,619,264
74%
Three Limiting Factors
Sources within the coconut value chain in Indonesia describe three
determining factors bearing on the development and the performance Total Area Harvested (Ha) 3,544,392 - 2017 Estimate
of the national coconut production platform: Source: Estate Crops Report December 2016, Director General of Estate Crops (Indonesia)/
ACAL
Agronomy Capital Advisors Limited January 2019 19You can also read