PREPARING WASHINGTON DEPARTMENT OF FISH AND WILDLIFE FOR A CHANGING CLIMATE: JUNE 2021 - WDFW
←
→
Page content transcription
If your browser does not render page correctly, please read the page content below
JUNE 2021

 PREPARING WASHINGTON DEPARTMENT OF
FISH AND WILDLIFE FOR A CHANGING CLIMATE:
    Assessing Risks and Opportunities for Action

    A collaboration of the Washington Department of Fish and Wildlife and
             the University of Washington Climate Impacts Group
Acknowledgments
The authors would like to express their sincere thanks to members of the WDFW
Climate Action Team who participated in a series of internal WDFW workshops that
produced much of the content for this report and provided valuable input during
monthly calls and document review.

WDFW Project Lead: Lynn Helbrecht, Climate Change Coordinator

Members of the Climate Action Team:
 Jane Atha                      John Heimburg               Sam Montgomery
 Dan Auerbach                   Lynn Helbrecht              Tim Quinn
 Joe Buchanan                   Janet Gorrell               Daniel Sund
 Kale Bentley                   Megan Kernan                Elizabeth Torrey
 Nicole Czarnomski              Kristen Kuyekendall         Julie Watson
 Aaron Dufault                  Kessina Lee                 Tristan Weiss

Former Members of the Climate Action Team:
Bridgette Glass, Joel Sisolak

Climate Impacts Group Team:
   •   Meade Krosby
   •   Marwa Mahmoud
   •   Guillaume Mauger
   •   Harriet Morgan
   •   Crystal Raymond
   •   Andrew Shirk

Recommended citation: Shirk, A., Morgan, H., Krosby, M., Raymond, C., Mauger, G.S.,
Helbrecht, L. 2021. Preparing Washington Department of Fish and Wildlife for a changing
climate: assessing risks and opportunities for action. A collaboration of the Washington
Department of Fish and Wildlife and University of Washington Climate Impacts Group.
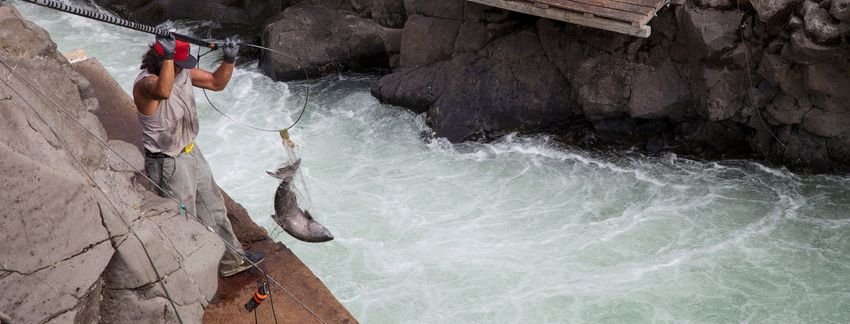
Image Citations

Cover page image:
© Climate Impacts Group; aerial support provided by LightHawk

Section header images:
Introduction: Climbing up Brewton Road, Brewbooks, licensed under CC BY-NC 2.0
Section 1: Blue Horizon, Mark Pouley, licensed under CC BY-NC 2.0
Section 2: Salmon fishing Klickitat River Washington, USFWS, licensed under CC BY-NC 2.0
Section 3: Razor clam dig on Copalis Beach, WDFW staff – provided by the agency
Conclusions: WDFW Facebook Page
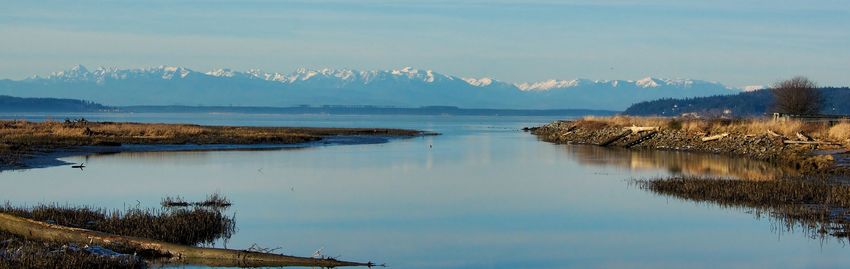
Table of Contents
Introduction                                                                         1
Section 1 - Ecosystem and Resource Impacts                                           3
  1.1 Physical Drivers of Impacts on Ecosystems and Natural Resources                4
  1.2 Impacts on Marine and Near-Shore Habitats                                     10
  1.3 Impacts on Freshwater, Wetland and Riparian Habitats                          13
  1.4 Impacts on Forest Habitats                                                    17
  1.5 Impacts on Alpine Habitats                                                    20
  1.6 Impacts on Shrubsteppe and Grassland Habitats                                 22
Section 2 - Overarching Agency Vulnerabilities                                      24
  2.1 Risks to Species Conservation and Recovery                                    26
  2.2 Risks to Harvest and Recreation Opportunities                                 30
  2.3 Risks to Providing Effective Technical Assistance, Permitting, Research and
  Planning                                                                          34
  2.4 Risks to WDFW Lands and Infrastructure                                        37
Section 3 – Opportunities for Action                                                40
  3.1 Policy, Regulations, Guidance and Management Plans                            41
  3.2 Research, Monitoring, Tools, and Data Management                              45
  3.3 Staff Training, Capacity Building and Coordination                            48
  3.4 Outreach and Communications                                                   49
  3.5 Collaboration and Partnerships                                                51
Conclusions                                                                         53
Appendices                                                                          55
  Appendix A: Section 2 Tabular Summary                                             55
  Appendix B: Section 3 Tabular Summary                                             59
INTRODUCTION
Introduction

The Washington Department of Fish and Wildlife (WDFW) recognizes that climate
change poses challenges to fulfilling its mission to “preserve, protect, and perpetuate
fish, wildlife, and ecosystems while providing sustainable fish and wildlife recreational
and commercial opportunities.” The agency is already experiencing climate-related
impacts, which will be exacerbated as the pace of climate change accelerates over the
coming decades.
Concerns regarding the projected impacts of climate change to the agency motivated
the adoption of Policy #5408: Addressing the Risks of Climate Change. The purpose of
this policy is to provide guidance for managing risks to WDFW investments due to
current and future impacts of climate change. The policy led to the establishment of
the Climate Action Team, which recently held a series of workshops which resulted in a
climate risk assessment for each program 1 within the agency. This report furthers that
work by including a discussion of how climate change might affect species and
ecosystems in Washington (Section 1) and summarizing the overarching vulnerabilities
to agency operations and investments identified in the workshops (Section 2). As a
next step towards building climate resilience across the agency it also summarizes
potential opportunities for action (Section 3) that were identified by the Climate Action
Team.

1
    Habitat, Fish, Capital & Asset Management Program, and Wildlife

                                                                                            1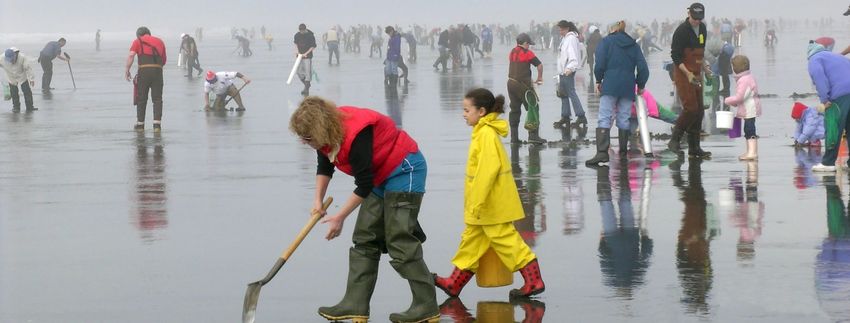
How to Read this Report
This report is written to serve as a reference for agency staff and individuals interested
in understanding:
   1. State of the science on climate and the implications of those changes on
      Washington ecosystems and natural resources of relevance to WDFW,
   2. Four climate-related vulnerabilities that are common across the Fish Program,
      Wildlife Program, Habitat Program and the CAMP program.
   3. Potential opportunities for action to address these climate-related
      vulnerabilities.
The above topics comprise the three main report sections. Written to serve as an easy-
to-read resource, each section employs a nested hierarchy of bolded text, italicized
text, and bullet points to facilitate information accessibility in a skimmable format.
Bold text presents higher-level overarching statements, italicized text provides key
words or phrases covered in each bullet, and bullet points provide a specific example
or concept that is representative of the bolded statement (Figure 1). For example, if a
reader was solely interested in the high-level takeaways from each section, they should
center their skimming on the bolded statements within each subsection.

Figure 1. A schematic illustrating the organizational structure of each report section.

                                                                                          2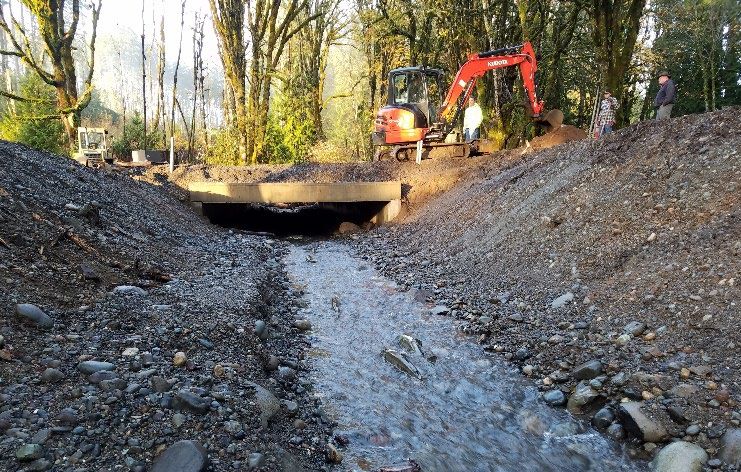
SECTION 1 - ECOSYSTEM AND RESOURCE IMPACTS
                    Section 1 - Ecosystem and Resource Impacts

                    This section provides a summary of key observed and projected changes in climate
                    (Section 1.1) and the impacts of those changes on Washington ecosystems and natural
                    resources of relevance to WDFW (Sections 1.2 - 1.6). Bold statements within each
                    subsection highlight key drivers and impacts, while the bullets below each statement
                    provide additional detail through examples. Where possible, specific examples of
                    impacts on Priority Habitats and Species (PHS) and game species are provided.

 Box 1. Observed and Projected Greenhouse Gas Emissions
  The world has already warmed as a result of human activity. Since the industrial revolution, atmospheric
  concentrations of CO2 and global temperatures have increased significantly as a result of human activities.
  Atmospheric CO2 increased from about 290 ppm in 1880 to over 405 ppm today. Over the same period, global
  temperatures increased approximately 1.8°F.
  Human-caused warming resulting from continuing emissions of greenhouse gases is adding around 0.4°F to global
  average temperatures every decade. If this continues, global average warming is likely to reach 2.7°F between 2030
  and 2052, which is within the lifetime of most people on Earth.
  To make projections of future climate, scientists use ‘what if ’ scenarios of plausible future greenhouse gas emissions
  to drive computer model simulations of the earth’s climate. Greenhouse gas (GHG) scenarios affect how much and
  how fast the earth warms -- higher GHG concentrations will cause more rapid warming than lower GHG scenarios.

Box 1 Figure. Since the industrial revolution, atmospheric
concentrations of CO2 and global temperatures have increased
significantly as a result of human activities. Atmospheric
CO2 increased from about 290 ppm in 1880 to over 405 ppm
today, as shown by the green line. Over the same period, global
temperatures increased approximately 1°C (1.8°F) – the blue
line shows global annual temperature compared to the average
global temperature for the period 1951-1980. Data from: NASA
(data.giss.nasa.gov), NOAA (www.ncei.noaa.gov/access &
www.esrl.noaa.gov/gmd/ccgg/trends).

Reproduced from:
                                                                                                               3
Snover, A.K., C.L. Raymond, H.A. Roop, H. Morgan, 2019. No Time to Waste. The
Intergovernmental Panel on Climate Change’s Special Report on Global Warming
of 1.5°C and Implications for Washington State. Briefing paper prepared by the
Climate Impacts Group, University of Washington, Seattle.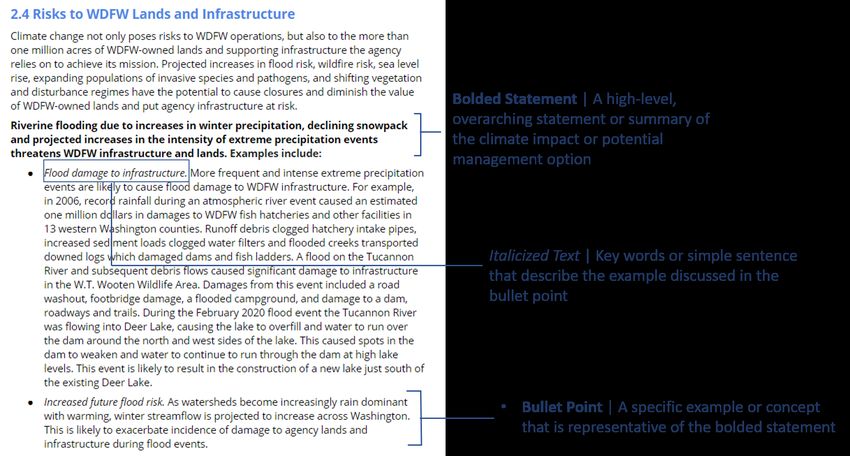
1.1 Physical Drivers of Impacts on Ecosystems and Natural Resources
Air and water temperatures are warming throughout the Pacific Northwest. The
magnitude of recent and projected future warming varies across different parts
of our region and across seasons.
     ●     Warming surface air temperature. Over the past century, average annual
           temperature in the Pacific Northwest has increased by about 1.3°F. All GHG
           scenarios project continued warming during this century, and most scenarios
           project future warming will be outside the range of historical variation by mid-
           century. 2 Across the Pacific Northwest, temperatures are projected to increase
           by 5°F under a low GHG scenario and 8.5°F under a high GHG scenario by late
           century (2071-2100). The magnitude of projected future warming varies by
           region and by time of year. Warming is generally expected to be slightly higher
           east of the Cascades compared to west of the crest, and greatest during the
           summer months. The amount of warming will also vary with land cover and
           topography. 3
     ●     Increasing water temperature in streams and lakes. Stream temperatures are
           projected to increase in response to warming air temperatures and decreases
           in summer streamflow. By the 2080’s under a higher GHG scenario, stream
           temperatures in eastern Washington show higher warming at lower elevations
           (5°F increase below 500m and 4.1°F increase between 500-1000m) compared to
           higher elevations (2.7°F increase above 1000m), on average. In western
           Washington, stream temperatures are projected to warm an average of about
           3°F by 2080 across all elevations. 4 The actual magnitude of future warming will
           be strongly influenced by local-scale factors.
     ●     Increasing ocean temperature and prevalence of marine heat waves. Globally, sea
           surface temperatures have warmed by about 1.3°F per century from 1900 to
           2016. 5 Under higher GHG scenarios, a global increase in average sea surface
           temperature of 4.9°F is projected by 2100.5 By the end of the century, under a
           high GHG scenario, marine heatwaves (occasional short-term influxes of warm
           surface water into a cold-water region like the North Pacific) could occur 50
           times more frequently globally and be ten times more intense than they were
           historically (1850-1900). 6

2
  Mote, Philip W, & Salathé, Eric P. (2010). Future climate in the Pacific Northwest. Climatic Change, 102(1), 29-50.
3
  USGCRP, 2017: Climate Science Special Report: Fourth National Climate Assessment, Volume I [Wuebbles, D.J., D.W. Fahey, K.A. Hibbard,
D.J. Dokken, B.C. Stewart, and T.K. Maycock (eds.)]. U.S. Global Change Research Program, Washington, DC, USA, 470 pp.
4
  Isaak, D., S. Wenger, E. Peterson, J. Ver Hoef, D. Nagel, C. Luce, S. Hostetler, J. Dunham, B. Roper, S. Wollrab, G. Chandler, D. Horan, S.
Parkes-Payne. 2017. The NorWeST summer stream temperature model and scenarios for the western U.S.: A crowd-sourced database
and new geospatial tools foster a user community and predict broad climate warming of rivers and streams. Water Resources Research,
53: 9181-9205.
5
  USGCRP, 2017: Climate Science Special Report: Fourth National Climate Assessment, Volume I [Wuebbles, D.J., D.W. Fahey, K.A. Hibbard,
D.J. Dokken, B.C. Stewart, and T.K. Maycock (eds.)]. U.S. Global Change Research Program, Washington, DC, USA, 470 pp.
6
  IPCC, 2019: IPCC Special Report on the Ocean and Cryosphere in a Changing Climate [H.-O. Pörtner, D.C. Roberts, V. Masson-Delmotte,
P. Zhai, M. Tignor, E. Poloczanska, K. Mintenbeck, A. Alegría, M. Nicolai, A. Okem, J. Petzold, B. Rama, N.M. Weyer (eds.)].

                                                                                                                                           4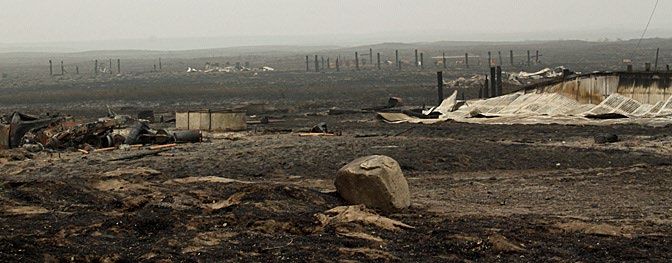
The form, amount and seasonality of precipitation is changing, but with greater
variability compared to warming air and water temperatures. Precipitation
patterns are projected to increasingly depart from historical patterns in the
future under higher GHG scenarios.
     ●     Continued variability in annual precipitation. Changes in precipitation are
           generally projected to fall within Washington’s high range of historical year-to-
           year variability, with some years that are abnormally wet, and others that are
           abnormally dry. For the foreseeable future, Washington will continue to
           experience years and decades with conditions that temporarily mask or amplify
           the projected changes in water resources, even as long-term trends continue.2
     ●     Seasonal changes in precipitation. Though no significant observed trends in
           annual precipitation are apparent in our region due to high year-to-year
           variability, precipitation is projected to depart from historical norms in some
           seasons. Winter precipitation is projected to increase by up to 10%, with larger
           increases expected in eastern Washington compared to western Washington.
           Conversely, summer precipitation is projected to decrease by 10 to 15%
           statewide.3
     ●     Increasing frequency and severity of dry summers. Projected increases in summer
           temperature and decreases in summer precipitation will result in larger climatic
           water deficits (the annual evaporative demand that exceeds available water) in
           the coming decades. Years with widespread dry conditions are projected to
           become 3 times more common by 2050, however, year-to-year and decadal
           patterns of climate variability will continue into the future and some years will
           be wetter than average. 7 Summer droughts will continue to end every year in
           our region with the onset of fall rains (i.e., multi-year droughts that occur in
           more arid climates are not projected for the Pacific Northwest).3
     ●     More rain, less snow. Though many Washington watersheds have historically
           received a significant portion of their winter precipitation as snow, rain will
           become the dominant form of precipitation in most watersheds by the end of
           the 21st century. The one exception to this is the North Cascades, where snow
           accumulation is projected to predominate at higher elevations through the end
           of the century. 8
     ●     Increasing frequency of atmospheric rivers and extreme precipitation events.
           Atmospheric rivers bring heavy snow and rain to the Pacific Northwest, often
           causing widespread flooding and landslides. The frequency of days with
           atmospheric river conditions is projected to increase by over 275% by the end

7
 https://statesatrisk.org/washington/all
8
 Salathé, Eric P, Leung, L Ruby, Qian, Yun, & Zhang, Yongxin. (2010). Regional climate model projections for the State of Washington.
Climatic Change, 102(1-2), 51-75.

                                                                                                                                        5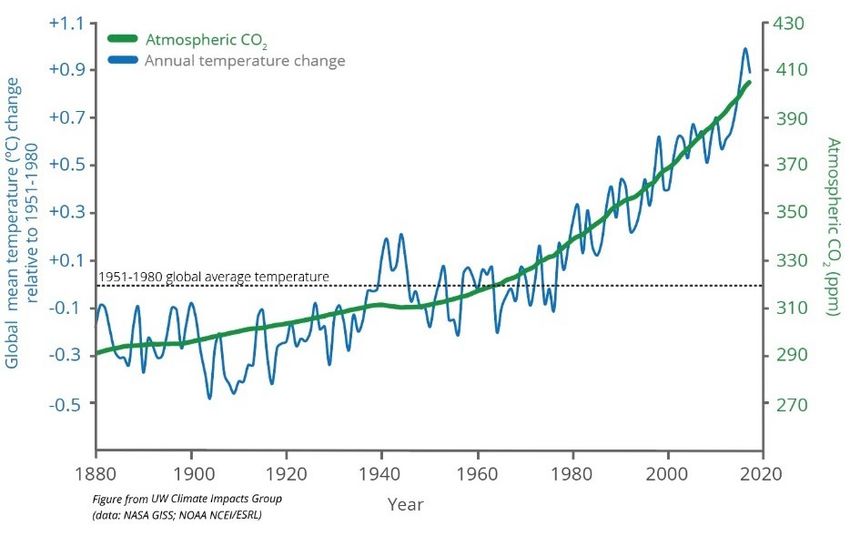
of the century. During days with atmospheric river conditions, precipitation is
           projected to increase by 15% to 39%. 9
Regional warming is causing declines in winter snowpack in many watersheds
and accelerating glacial recession across the region. Future projections show
increasing rates of loss as the climate warms.
     ●     Declining snowpack. Pacific Northwest snowpack is strongly influenced by annual
           and interdecadal variability of circulation patterns over the north Pacific Ocean
           as well as long-term trends driven by anthropogenic global warming. With all
           sources of variability taken into account, spring snowpack in the Cascade Range
           has declined by 48% from 1950 to 1997. Most of that decline was driven by
           regional climatic variability, however, anthropogenic global warming has been
           linked to a relatively steady annual loss rate of 2%. The loss due to the warming
           trend amounts to a 16% decline between 1930 and 2007. By mid-century,
           warming is expected to reduce winter snowpack over much of the Cascades
           and Olympics to a degree that exceeds historical variability except at very high
           elevation sites that will remain sufficiently cold for snow to accumulate. 10
           Average spring snowpack (April 1 snow water equivalent) in Washington is
           projected to decline by 56% (10-model average for a low GHG scenario) to 70%
           (10-model average for a high GHG scenario) by the 2080s (2070-2099, relative to
           1916-2006). 11 The largest changes are projected for mid-elevation basins that
           historically have seen significant snow accumulation but have moderate winter
           temperatures.10
     ●     Receding glaciers. Most Northwest glaciers are in decline. For example, glacier
           area in the North Cascades declined by 56% from 1900 to 2009.11 One study
           found that only 3 of the 12 North Cascades glaciers with annual measurements
           are expected to persist in the face of projected warming. 12
Projected future warming is expected to reduce snowpack, affecting the timing
and amount of snowmelt, and altering hydrologic regimes across the region.
Changes in the amount and seasonality of precipitation are expected to
exacerbate these hydrologic impacts.
     ●     Shifts in spring peak flow. The spring peak in streamflow is projected to occur
           earlier in mid-elevation basins due to earlier snowmelt. For example, peak
           streamflow is projected to occur four to nine weeks earlier by the 2080s (2070-
           2099, relative to 1917-2006) in four Puget Sound watersheds (Sultan, Cedar,

9
   Warner, M.D., et al., 2015. Changes in winter atmospheric rivers along the North American west coast in CMIP climate models J.
Hydrometeeor, 16, 118-128: doi: http://dx.doi.org/10.1175/JHMHDH14H0080.1
10
   Vano, J. A., Nijssen, B., and Lettenmaier, D. P. (2015), Seasonal hydrologic responses to climate change in the Pacific Northwest, Water
Resour. Res., 51, 1959– 1976
11
   Roop, H.A., G.S. Mauger, H. Morgan, A.K. Snover, and M. Krosby, 2020. “Shifting Snowlines and Shorelines: The Intergovernmental
Panel on Climate Change’s Special Report on the Ocean and Cryosphere and Implications for Washington State.” Briefing paper prepared
by the Climate Impacts Group, University of Washington, Seattle. DOI: doi.org/10.6069/KTVN-WY66. Updated 01/2020.
12
   Pelto, M.S. 2011. Methods for assessing and forecasting the survival of North Cascade, Washington glaciers, Quaternary International,
Volume 235, Issues 1–2 (70-76)

                                                                                                                                         6
Green, Tolt) and the Yakima basin. Most of the projected changes in the timing
of peak streamflow are the result of increasing temperatures that shift
precipitation from snow to rain. 13
● Increasing annual streamflow. Total annual streamflow is driven primarily by
total annual precipitation. Annual streamflow is projected to increase by 4.0%
to 6.2% on average for Washington State by the 2080s (2070-2099, relative to
1970-1999).13 These changes are likely to be dwarfed by natural year-to-year
variability in streamflow totals through the end of the century.13
● Reduced summer streamflow. Low summer streamflow conditions are projected
to become more severe in about 80% of watersheds across Washington State
due primarily to reduced snowpack (the effects of other influences like summer
precipitation, evapotranspiration, and groundwater have less of an effect on
summer streamflow, though they can be locally important). Rain-dominant and
mixed rain and snow basins show the greatest and most consistent decreases
in minimum flows, while changes for snow-dominated basins are smaller.
Changes are more pronounced west of the Cascade Range mountains because
there is “less water to lose” east of the Cascades – historical conditions are
already very arid in interior Washington. Statewide, summer (Apr-Sep)
streamflow is projected to decrease by 34% (10-model average based on a
lower GHG scenario) to 44% (10-model average based on a higher GHG
scenario) on average by the 2080s (2070-2099, relative to 1970-1999).13
● Increasing winter streamflow. Winter streamflow is projected to increase by 25%
to 34% on average for Washington State by the 2080s (2070-2099, relative to
1970-1999). Projected changes range from modest decreases to large increases
in winter flows depending on location and the relative influence of rain and
snowmelt on streamflow in the watershed. The highest increases in river flows
are generally expected to occur in rain-dominated and transitional (i.e., mixed
rain and snow) watersheds. Some snow-dominant watersheds will see flood
increases, while others will experience decreases depending mainly on
elevation (i.e., streams in higher elevation basins that will remain cold in the
future and retain their winter snowpack will not experience increases in winter
streamflow).13
Rising sea level will increase coastal flooding, inundation, and bluff erosion
across coastal Washington.
● Sea level rise (SLR). Globally, between 1902 and 2015, mean sea level rose 6.3
inches.6 The likely amount of projected relative sea level rise by 2050 and 2100
is shown in the below table for three locations along Washington’s coastline.
13
Elsner, Marketa M, Cuo, Lan, Voisin, Nathalie, Deems, Jeffrey S, Hamlet, Alan F, Vano, Julie A, . . . Lettenmaier, Dennis P. (2010).
Implications of 21st century climate change for the hydrology of Washington State. Climatic Change, 102(1-2), 225-260.
7The sea level rise projections in this table represent the 17-83% probability
range, often referred to as the ‘likely range’. 14
● Variability in sea level rise. Vertical land movement (i.e., uplift or subsidence) can
exacerbate or mediate SLR, creating variability in the magnitude of projected
change along the coast.14 Vertical land movement explains the majority of the
variability in the projected SLR magnitudes for the three different Washington
locations shown in the table above.
Table 1. The likely amount of relative sea level rise by 2050
and 2100 for three locations along Washington’s coastline for
low (RCP 4.5) and high (RCP 8.5) greenhouse gas scenarios
(relative to 1991–2009 sea level). The sea level rise projections
represent the 17-83% probability range, known as the ‘likely
range.’ For example, the likely range of sea level rise in
Aberdeen by 2050 under a high greenhouse gas scenario is
0.2-0.7 feet. This means there is an 83% chance that sea level
will increase 0.2 feet or more and a 17% chance that sea level
will increase 0.7 feet or more by 2050. Projections are
available for 171 locations in coastal Washington. Miller et al.,
2018 (http://bit.ly/waslr).
● Increasing frequency of coastal flooding. Though future storm surge is not
projected to get bigger, sea level rise will exacerbate coastal river flooding by
allowing storm surges to travel further inland. Higher sea level can also increase
the extent and depth of flooding by making it harder for flood waters in rivers
and streams to drain to the ocean or Puget Sound. Initial research suggests that
the amount of area flooded in the Skagit valley would increase by up to 74% by
14
Miller, I.M., Morgan, H., Mauger, G., Newton, T., Weldon, R., Schmidt, D., Welch, M., Grossman, E. 2018. Projected Sea Level Rise for
Washington State – A 2018 Assessment. A collaboration of Washington Sea Grant, University of Washington Climate Impacts Group,
Oregon State University, University of Washington, and US Geological Survey. Prepared for the Washington Coastal Resilience Project.
8the 2080s when accounting for the combined effects of sea level rise and larger
floods. 15
Increasing atmospheric concentrations of carbon dioxide result in increased
formation of carbonic acid in oceans, driving ocean acidification. Future
emissions of carbon dioxide from continued burning of fossil fuels will continue
to accelerate this trend.
● Increasing ocean acidification. Over the last 250 years, the upper-ocean has
experienced a 26% increase in acidity (from a pH of about 8.2 to 8.1; note pH is
on a log10 scale), a rate of change that is 10 times faster than any time in the
past 300 million years. Future projections of ocean acidification are for a nearly
170% decrease (to a pH of 7.75) relative to pre-industrial levels by the end of
the century under a high GHG scenario. 16
● Local variation in ocean acidification. Ocean acidity varies locally and seasonally
based on other factors such as the amount of organic carbon (which increases
acidity during decomposition) introduced to surface waters from freshwater
inputs (e.g., the Columbia River) and from the frequency and intensity of
upwelling on the outer coast (which brings deeper, more acidic waters to the
surface. 17
● Reduced availability of carbonate ions. Increased ocean acidity is reducing the
availability of carbonate ions (an essential component of the shells of shellfish
species when combined with calcium) in seawater.
Increasing air temperatures and drier summer conditions are resulting in larger
and more frequent wildfires. Future projections of additional warming and
drying will increase wildfire impacts in many areas.
● Increasing fire frequency and area. Increasing summer drought conditions driven
by warmer temperatures, lower summer precipitation and earlier spring
snowmelt are creating conditions favorable for wildfire. Across the western US,
large fires are almost 4 times more common now than they were in the 1970s,
burning seven times more acreage in an average year. 18 Increasing aridity of
the western US is partially driving this trend in wildfire activity, with about 55%
of the observed increase in fuel aridity since 1979 attributed to climate
change. 19
15
Hamman, J., Hamlet, A.F., Lee, S.Y., Fuller, R., and Grossman, E.F. 2016. Combined Effects of Projected Sea Level Rise, Storm Surge, and
Peak River Flows on Water Levels in the Skagit River Floodplain. Northwest Science 90(1):57-78.
16
IGBP, IOC, SCOR 2013. Ocean Acidification Summary for Policymakers – Third Symposium on the Ocean in a High-CO2 World.
International Geosphere-Biosphere Programme, Stockholm, Sweden.
17
Kapsenberg, Lydia, and Tyler Cyronak. "Ocean acidification refugia in variable environments." Global change biology 25.10 (2019):
3201-3214.
18
Westerling, A. L., Hidalgo, H. G., Cayan, D. R., & Swetnam, T. W. Warming and earlier spring increase western US forest wildfire activity.
Science 313, 940–943 (2006).
19
Abatzoglou, J and AP Williams 2016. Impact of anthropogenic climate change on wildfire across western US forests. PNAS. 113 (42).
9● Fire risk variability. Future changes in fire risk are expected to vary across the
state. In dry forested ecosystems, area burned by wildfire is projected to
increase by a factor of four by the 2040s (relative to 1980-2006)20, and wildfires
are expected to burn with greater severity due to the effects of fire exclusion
and associated fuel accumulation. In moist conifer forests west of the Cascade
Crest, where historically fire return intervals have been long, increases in
wildfire risk are also expected but less certain because the relationship between
wildfire and climate is weaker. Wildfire risk will remain low relative to dry fire-
adapted forests, yet severity will be high when fires do burn as is characteristic
of these systems. 21
1.2 Impacts on Marine and Near-Shore Habitats
Rising sea surface temperatures and marine heatwaves are driving changes in
the survival, abundance and distribution of native fish and marine invertebrates
as well as the prevalence of invasive species and disease.
● Altered upwelling and marine food webs. Warm surface waters are less nutrient
rich than cold upwelling waters. A large influx of warm water (referred to as a
marine heatwave) into the cold water upwelling system that occurs along the
north Pacific coast adversely affects phytoplankton and zooplankton
throughout the region. Plankton form the base of the marine food web, so a
reduction in plankton biomass cascades up the food web and results in poor
survival and recruitment of higher-level consumers like salmonids and other
game fish species as well as marine mammals and seabirds, many of which
appear on the PHS list. 22
● More frequent marine heat waves. In years such as 2015, when a large area of
warm surface water appeared off the north Pacific coast, widespread declines
in fish, marine mammals and seabirds occurred. This event was estimated to
have killed 62,000 common murres (Uria aalge) and at least 22 murre colonies
completely failed to produce offspring over several breeding seasons
afterwards. 23
● Increasing spread of invasive species. Invasive marine species like the European
green crab (Carcinus maenas) typically tolerate a broader range of climatic
conditions. Warming oceans may allow invasive species to expand and gain
additional competitive advantages over native species. 24
20
Littell, JS. et al. 2010. Climatic Change. Forest ecosystems, disturbance, and climatic change in Washington State, USA. 102:129-158.
21
Halofsky, JE, DL Peterson and BJ Harvey. 2020. Changing wildfire, changing forests: the effects of climate change on fire regimes and
vegetation in the Pacific Northwest, USA. Fire Ecology 16:4.
22
Xiu, P., Chai, F., Curchitser, E.N. et al. Future changes in coastal upwelling ecosystems with global warming: The case of the California
Current System. Sci Rep 8, 2866 (2018).
23
Piatt JF, Parrish JK, Renner HM, Schoen SK, Jones TT, Arimitsu ML, et al. (2020) Extreme mortality and reproductive failure of common
murres resulting from the northeast Pacific marine heatwave of 2014-2016. PLoS ONE 15(1).
24
Sorte, C.J.B., Williams, S.L. and Zerebecki, R.A. (2010), Ocean warming increases threat of invasive species in a marine fouling
community. Ecology, 91: 2198-2204.
10● Increased prevalence of disease. When fish and shellfish pathogens and parasites
gain a relative advantage over their hosts by warming ocean conditions and
other stressors (e.g., ocean acidification, hypoxia), climate change may increase
the prevalence of disease. 25
● Increasing frequency of harmful algal blooms. Warmer oceans are expected to
make harmful algal blooms (HABs) more likely to occur. By the end of the
century under a moderate GHG scenario, warmer waters in the Puget Sound
are expected to lead to an average of 13 more days per year with favorable
conditions for HABs. The season suitable for HABs is projected to begin up to
two months earlier and last up to one month longer than in the past (1970–
1999). Warm ocean conditions in the North Pacific (e.g., warm phases of the
Pacific Decadal Oscillation, El Niño events, and marine heatwaves) have been
strongly linked to elevated domoic acid levels in shellfish. 26
Warming oceans increase the respiration of marine bacteria, reducing oxygen
availability. Hypoxia (low oxygen) can lead to die-offs of fish and marine
invertebrates, particularly in shallow, constricted waters with less exchange to
the open ocean.
● Increasing frequency of hypoxia-induced disease. Hypoxia has been identified as a
key driver of sea star wasting syndrome. Since 2013, warming oceans have
been linked to an epidemic of sea star wasting disease that resulted in 80%-
100% mortality of sea star populations along 3000 km of coast from California
to Alaska. 27
● Changes in marine community composition. Hypoxia driven die-offs can alter
marine communities. For example, sea stars are key predators of sea urchins,
which feed on kelp. The loss of sea stars leads to expansion of sea urchin
populations and, in turn, declines in kelp forests. Kelp is a key structural
element in nearshore habitats; loss of kelp forests has been tied to local
collapses in the diversity and abundance of fish, seabirds and marine
mammals. 28
Oceans are acidifying as atmospheric carbon dioxide increases. This reduces the
availability of calcium carbonate in marine waters, impairing the growth,
survival and reproduction of many near-shore calcifying shellfish species.
Virtually every major biological function has been shown to respond to seawater
25
Burge CA, Eakin CM, Friedman CS, Froelich B, Hershberger PK, Hofmann EE, Petes LE, Prager KC, Weil E, Willis BL, Ford SE, and Harvell
CD. Climate Change Influences on Marine Infectious Diseases: Implications for Management and Society. Annual Review of Marine
Science 2014 6:1, 249-277
26
Moore, S.K., Mantua, N.J., Salathé, E.P. 2011. Past trends and future scenarios for environmental conditions favoring the accumulation
of paralytic shellfish toxins in Puget Sound shellfish. Harmful Algae 10:521-529.
27
Harvell, C. D., et al. "Disease epidemic and a marine heat wave are associated with the continental-scale collapse of a pivotal predator
(Pycnopodia helianthoides)." Science advances 5.1 (2019): eaau7042.
28
Rogers-Bennett, L., and C. A. Catton. "Marine heat wave and multiple stressors tip bull kelp forest to sea urchin barrens." Scientific
reports 9.1 (2019): 1-9.
11acidification, including rates of photosynthesis, respiration, growth,
calcification, reproduction and recruitment.
● Shellfish declines due to ocean acidification. Marine invertebrates that form
calcium carbonate shells (including all recreationally and commercially
harvested clams, mussels, oysters, shrimp and crabs) are projected to
experience population declines. Larval life stages are particularly vulnerable. 29
● Altered marine food webs. Zooplankton and phytoplankton larval development
and survival are also sensitive to ocean acidification. Future acidification could
drive widespread declines in plankton, which form the base of the marine food
web, resulting in cascading effects to higher-level consumers like fish, shellfish,
seabirds and marine mammals. Pteropods and copepods - zooplankton that
are an important food resource for young salmon, seabirds and whales - are
experiencing ocean acidification-related declines. 30
● Declines in corals. Corals are also sensitive to ocean acidification; their decline
results in loss of coral habitats that support many species including rockfish
and sharks. 31
Continued sea level rise along much of Washington’s coast will increase the
frequency or magnitude of extreme coastal water level events. Although the
magnitude of storm surges are not expected to increase, higher sea level means
that the same storm events would result in higher water levels and potentially
more damage. This is increasing the risk of coastal flooding and erosion, which
negatively impact near-short habitat.
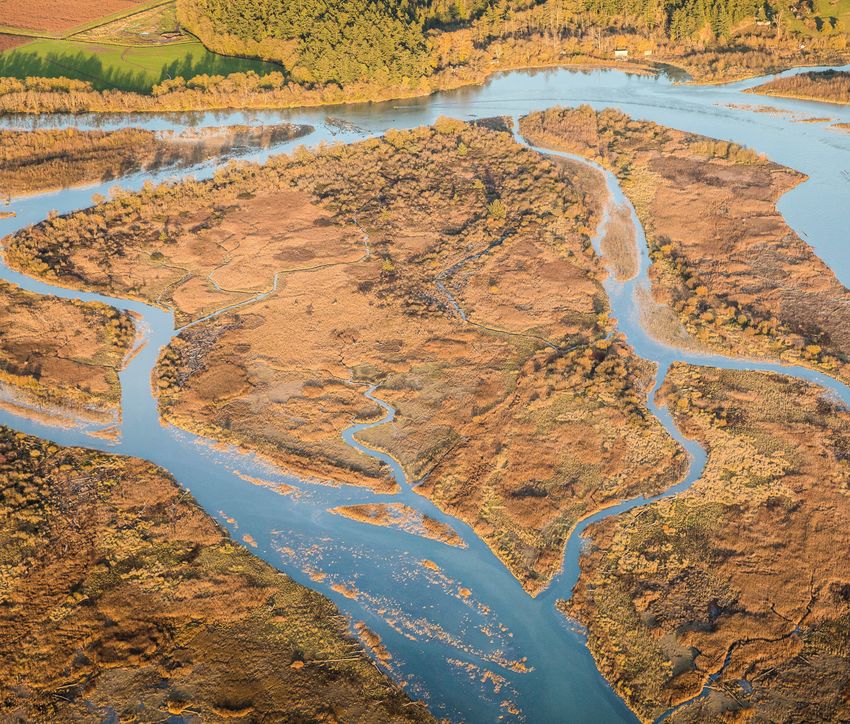
● Loss of coastal wetlands. Globally, nearly half of coastal wetlands have been
destroyed over the past 100 years due to land use changes, sea level rise and
extreme weather events. Sea level rise will increase rates of saltwater inundation
in coastal wetlands and lakes, leading to increasing prevalence of saltwater-
tolerant species in nearshore vegetation communities, relative to saltwater-
intolerant species. 32
● Loss of coastal tidal flats and beaches. A 44% projected loss of tidal flats across the
Pacific Northwest coastline due to sea level rise will negatively impact many
species of shorebirds that rely upon them, particularly during their winter
migration. In some cases, coastal habitats can move inland with sea level rise, but
in many inland areas, development will block these shifts, driving future declines
in near-shore habitats. Losses of estuarine beaches will negatively impact critical
29
Wittmann, Astrid C., and Hans-O. Pörtner. "Sensitivities of extant animal taxa to ocean acidification." Nature Climate Change 3.11
(2013): 995-1001.
30
Orr, James C., et al. "Anthropogenic ocean acidification over the twenty-first century and its impact on calcifying organisms." Nature
437.7059 (2005): 681-686.
31
Hoegh-Guldberg, Ove, et al. "Coral reefs under rapid climate change and ocean acidification." science 318.5857 (2007): 1737-1742.
32
Li, Xiuzhen, et al. "Coastal wetland loss, consequences, and challenges for restoration." Anthropocene Coasts 1.1 (2018): 1-15.
12spawning habitat for forage fish including surf smelt (Hypomesus pretiosus) and
sand lance, which play a key role in the marine food web. 33
● Altered shoreline and tidal river dynamics. Shoreline armoring, a common response
to sea level rise, is expanding, negatively impacting shoreline dynamics and near-
shore fish habitat. Sea level rise also alters stream flow dynamics in tidally
influenced reaches, threatening fish habitat and fish passage. 34
● Loss of freshwater marshes and increasing pollutants. Coastal freshwater marshes
play a crucial role in regulating nutrients and filtering pollutants. The loss of
coastal freshwater marshes due to sea level rise will increase nutrient and
pollutant inputs from inland to marine systems. 35
1.3 Impacts on Freshwater, Wetland and Riparian Habitats
Warming water temperatures are reducing habitat quality and connectivity for
native coldwater fish species while improving conditions for non-native fish and
pathogens.
● Impaired habitat quality. Thermal stress from elevated water temperature increases
mortality of native cold-water fishes, including PHS-listed species of trout and
salmon as well as white sturgeon (Acipenser transmontanus), eulachon (Thaleichthys
pacificus) and lamprey (Entosphenus tridentatus). 36 Native trout habitat in the
western US is projected to decline in extent by 33% to 77% by the end of the
century (relative to 1985-2004) under a higher GHG scenario. 37 Studies suggest that
one third of the current habitat for threatened and endangered Pacific Northwest
salmon species will no longer be suitable by the end of this century as key
temperature thresholds are exceeded. 38 Warmer water temperature also reduces
habitat quality by increasing primary productivity in aquatic systems, leading to
increased prevalence of algal blooms and related anoxic conditions. 39
● Increasing thermal barriers. Water temperatures that exceed the thermal tolerances
of cold-water fish act as a thermal barrier to movement, reducing habitat
connectivity in aquatic networks, and impairing fish migrations and access to
spawning areas. 40
33
Glick, Patty, Jonathan Clough, and Brad Nunley. "Sea-level rise and coastal habitats in the Pacific northwest." (2007).
34
Smith, Collin D., et al. "Modeling the potential effects of sea-level rise on the spawning habitat of Salish Sea forage fish." (2010).
35
Nelson, Joanna L., and Erika S. Zavaleta. "Salt marsh as a coastal filter for the oceans: changes in function with experimental increases
in nitrogen loading and sea-level rise." PLoS One 7.8 (2012).
36
Sharma, S., Vander Zanden, M. J., Magnuson, J. J., & Lyons, J. (2011). Comparing climate change and species invasions as drivers of
coldwater fish population extirpations. Plos One, 6(8).
37
Kaushal, Sujay S, Likens, Gene E, Jaworski, Norbert A, Pace, Michael L, Sides, Ashley M, Seekell, David, . . . Wingate, Rebecca L. (2010).
Rising stream and river temperatures in the United States. Frontiers in Ecology and the Environment., 8(9), 461-466.
38
Littell, J.S., M. McGuire Elsner, L.C. Whitely Binder, and A.K. Snover (eds). 2009. The Washington Climate Change Impacts Assessment:
Evaluating Washington's Future in a Changing Climate, (PDF 14.1 MB) Climate Impacts Group, University of Washington, Seattle,
Washington.
39
Paul, V. J. (2008). Global warming and cyanobacterial harmful algal blooms. Cyanobacterial harmful algal blooms: state of the science
and research needs, 239-257.
40
Whitney, James E, Al-Chokhachy, Robert, Bunnell, David B, Caldwell, Colleen A, Cooke, Steven J, Eliason, Erika J, . . . Paukert, Craig P.
(2016). Physiological Basis of Climate Change Impacts on North American Inland Fishes. Fisheries., 41(7), 332-345.
13● Increasing prevalence of invasive species and pathogens. Increasing water
temperatures facilitate the range expansion of non-native warm-water fish species
(e.g., bass, walleye and pike) and other aquatic species (e.g., zebra mussel,
Dreissena polymorpha) that are competitors with and predators of native species. 41
Fish pathogens can also become more virulent in warmer water, and the thermal
stress associated with warmer water can increase fish species’ susceptibility to
pathogens. Dense concentrations of fish seeking thermal relief in cold-water pools
or being raised in hatchery environments are at risk of disease transmission. 42
Altered hydrology is affecting habitat quality and connectivity, and the
phenology of native aquatic and riparian species.
● Declining summer streamflow. Reduced snowpack (particularly in mid-elevation
basins) and increasingly common summer drought conditions are expected to
reduce summer streamflows in about 80% of watersheds across Washington State.
Low summer flow conditions can reduce egg and juvenile fish survival and act as a
movement barrier to migrating fish. 43
● Increasing flood impacts. Heavy rainfall events are projected to become more
intense by mid-century, increasing flood risk, scouring stream beds and reducing
salmon egg-to-fry survival, particularly in rain-dominated and mixed rain and snow
watersheds. Extreme flooding events can destroy riparian vegetation, cause
erosion and increase suspended sediment loads, reducing water quality and
impairing fish habitat. 44 45 As more winter precipitation falls as rain rather than
snow, higher winter stream flows can scour streambeds, damaging salmon
spawning nests and washing away incubating eggs. 46
● Altered life-cycles. Altered timing of peak flow (shifting earlier in mixed rain and
snow and snow-dominated basins) and low flow in streams affects the timing of
migratory and anadromous game fish species like salmonids, sturgeon, eulachon
and lamprey. This altered timing could create mismatches with when prey are
available to fish at various life stages. 47 Earlier peak streamflows can also flush
young salmon from rivers to estuaries before they are physically mature enough
for transition, increasing a variety of stressors including the risk of predation.
41
Britton, J R, Cucherousset, J, Davies, G D, Godard, M J, & Copp, G H. (2010). Non-native fishes and climate change: Predicting species
responses to warming temperatures in a temperate region. Freshwater Biology., 55(5), 1130-1141.
42
McCullough, D. A. (1999). A review and synthesis of effects of alterations to the water temperature regime on freshwater life stages of
salmonids, with special reference to Chinook salmon (pp. 1-291). US Environmental Protection Agency, Region 10.
43
Mantua, N., Tohver, I., & Hamlet, A. (2009). Impacts of climate change on key aspects of freshwater salmon habitat in Washington
State.
44
Mantua, Nathan, Tohver, Ingrid, & Hamlet, Alan. (2010). Climate change impacts on streamflow extremes and summertime stream
temperature and their possible consequences for freshwater salmon habitat in Washington State. Climatic Change, 102(1), 187-223.
45
Arora, Vivek K, & Boer, George J. (2001). Effects of simulated climate change on the hydrology of major river basins. Journal of
Geophysical Research., 106(D4), 3335-3348.
46
Goode, Jaime R., et al. "Potential effects of climate change on streambed scour and risks to salmonid survival in snow‐dominated
mountain basins." Hydrological Processes 27.5 (2013): 750-765.
47
Crozier, L. G., Lawson, P. W., Quinn, T. P., Hendry, A. P., Battin, J., Mantua, N. J., ... & Shaw, R. G. (2008). Evolutionary responses to
climate change for organisms with complex life histories: Columbia River salmon as a case in point. Evol Appl, 1(1), 252-270.
14Increasing natural disturbances in riparian areas are reducing habitat quality
and availability for riparian-associated species and impairing water quality for
aquatic species.
● Increasing riparian disturbances. Increased occurrence of wildfire, flooding, and
other natural disturbances is driving losses in riparian forests and other riparian
vegetation, negatively impacting this Priority Habitat and associated mammals like
beaver (Castor canadensis), mink (Neovison vison) and spotted skunk (Spilogale
gracilis) as well as birds (e.g., cavity nesting ducks), amphibians and arthropods, a
number of which appear on the PHS list. 48 49
● Impacts of riparian vegetation loss. The loss of riparian vegetation can cause
increases in stream temperatures as well as increased erosion and suspended
sediment loads, negatively impacting water quality for native species that require
clear, cool water. 50 51
Declining precipitation and higher temperatures in summer are expected to lead
to more frequent and severe summer droughts, reducing water availability in
soils, seeps, ponds and streams, impairing habitat for wetland-associated
species.
● Loss of montane wetlands. Montane wetlands that persist into the summer due to
water stored in the snowpack are particularly at risk in watersheds that will shift
from snow-dominated to rain-dominated. The loss of these montane wetlands
would reduce the area of habitat available for montane wetland-associated
species, including several PHS-listed amphibians like western toad (Anaxyrus
boreas) and Columbia spotted frog (Rana luteiventris), mammals such as moose
(Alces alces) and several PHS-listed arthropods. 52
● Loss of lowland wetlands. Lowland wetlands that are fed by precipitation rather than
groundwater (e.g., vernal pools) are also vulnerable to increasing summer drought
conditions. As a result, lowland wetland-associated species are also at risk of
habitat loss, including several PHS-listed species of birds such as sandhill crane
(Antigone canadensis), black-crowned night heron (Nycticorax nycticorax), and great
blue heron (Ardea herodias), amphibians such as tiger salamander (Ambystoma
48
Capon, Samantha J, Chambers, Lynda E, Mac Nally, Ralph, Naiman, Robert J, Davies, Peter, Marshall, Nadine, . . . Williams, Stephen E.
(2013). Riparian Ecosystems in the 21st Century: Hotspots for Climate Change Adaptation? Ecosystems, 16(3), 359-381.
49
Raymond, C. L., Peterson, D. L., & Rochefort, R. M. (2014). Climate change vulnerability and adaptation in the North Cascades region,
Washington. Gen. Tech. Rep. PNW-GTR-892. Portland, OR: US Department of Agriculture, Forest Service, Pacific Northwest Research
Station. 279 p. 892.
50
From logging increase stream temp citation: Johnson, Sherri L, & Jones, Julia A. (2000). Stream temperature responses to forest harvest
and debris flows in western Cascades, Oregon. Canadian Journal of Fisheries and Aquatic Sciences, 57(S2), 30-39.
51
Vegetation and erosion citation: Zhang, Xia, Yu, Guo Qiang, Li, Zhan Bin, & Li, Peng. (2014). Experimental Study on Slope Runoff,
Erosion and Sediment under Different Vegetation Types. Water Resources Management., 28(9), 2415-2433.
52
Lee, Se-Yeun, Ryan, Maureen E, Hamlet, Alan F, Palen, Wendy J, Lawler, Joshua J, Halabisky, Meghan, & Richardson, Curtis J. (2015).
Projecting the Hydrologic Impacts of Climate Change on Montane Wetlands. PloS One., 10(9), E0136385.
15tigrinum), and several species of arthropods. 53
● Altered floodplains. Floodplain wetlands are sensitive to changes in the timing of
peak flows, affecting which species and life stages can access and use floodplain
habitat for rearing. 54
The cumulative impacts of increased water temperature, altered hydrologic
cycles and increasing natural disturbances in riparian areas are altering the
abundance and distributions of freshwater aquatic, wetland and riparian-
associated species.
● Population-level impacts. Increased mortality, reduced reproductive success (e.g.,
from poor body condition due to reduced prey/forage availability), and habitat
fragmentation in aquatic networks are driving deleterious shifts in the age
composition, population size and genetic diversity of coldwater fish populations. 55
56 57
● Range contractions. Wetland and riparian-associated species are experiencing range
contractions in some watersheds due to increasing rates of natural disturbance in
riparian vegetation and drier conditions (e.g., from drought and reduced water
storage in snowpack) that limit the amount of water available to feed precipitation-
dependent wetlands. 58 In addition, impaired water quality and altered hydrology
combined with movement barriers (e.g., thermal barriers and low-flow barriers) are
driving range contractions in native cold-water fish species, including many PHS-
listed species and game fish species. 59 60
● Extirpation. Local extirpation of native cold-water fish species driven by a variety of
stressors is resulting in local declines in the diversity of fish species. 61 62
53
Pyke, C. (2005). Assessing Climate Change Impacts on Vernal Pool Ecosystems and Endemic Branchiopods. Ecosystems., 8(1), 95-105.
54
Tockner, K., & Stanford, J. A. (2002). Riverine flood plains: present state and future trends. Environmental conservation, 308-330.
55
Macdonald, J. (2000). Mortality during the migration of Fraser River sockeye salmon (Oncorhynchus nerka): A study of the effects of
ocean and river environmental conditions in 1997. Race Rocks Pilot Marine Protected Area : An Ecological Overview /, 12, 2315.
56
Rand, P S, Hinch, S G, Morrison, J, Foreman, M G G, MacNutt, M J, Macdonald, J S, . . . Higgs, D A. (2006). Effects of River Discharge,
Temperature, and Future Climates on Energetics and Mortality of Adult Migrating Fraser River Sockeye Salmon. Transactions of the
American Fisheries Society., 135(3), 655-667.
57
Pankhurst, Ned W, & Munday, Philip L. (2011). Effects of climate change on fish reproduction and early life history stages. Marine &
Freshwater Research., 62(9), 1015.
58
Martínez-Fernández, Vanesa, Van Oorschot, Mijke, De Smit, Jaco, González del Tánago, Marta, & Buijse, Anthonie D. (2018). Modelling
feedbacks between geomorphological and riparian vegetation responses under climate change in a Mediterranean context. Earth
Surface Processes and Landforms : The Journal of the British Geomorphological Research Group., 43(9), 1825-1835.
59
Santiago, José María, Muñoz-Mas, Rafael, Solana-Gutiérrez, Joaquín, García de Jalón, Diego, Alonso, Carlos, Martínez-Capel, Francisco, . .
. Ribalaygua, Jaime. (2017). Waning habitats due to climate change: The effects of changes in streamflow and temperature at the rear
edge of the distribution of a cold-water fish. Hydrology and Earth System Sciences., 21(8), 4073-4101.
60
Jacobson, P. C., Hansen, G. J., Olmanson, L. G., Wehrly, K. E., Hein, C. L., & Johnson, L. B. (2019). Loss of coldwater fish habitat in
glaciated lakes of the midwestern United States after a century of land use and climate change. Advances in Understanding Landscape
Influences on Freshwater Habitats and Biological Assemblages, eds RM Hughes, D. Infante, L. Wang, K. Chen, and B. F. de Terra
(Bethesda, MD: American Fisheries Society), 141-158.
61
Daufresne, M., & Boet, P. (2007). Climate change impacts on structure and diversity of fish communities in rivers. Global Change
Biology, 13(12), 2467-2478.
62
Kingsolver, J. (2009). The Well‐Temperatured Biologist. The American Naturalist., 174(6), 755-768.
161.4 Impacts on Forest Habitats
Higher temperatures and increasing summer drought conditions are affecting
tree phenology and driving increases in natural disturbances affecting forest
structure and composition.
● Shifts in forest types. Under a medium GHG scenario, the area of Washington forests
that is water-limited (i.e. forests on warm and dry sites where water is more
limiting to growth than energy, most often occurring east of the Cascade crest at
mid to low elevations) is projected to increase by 32% in the 2020s, with an
additional 12% increase in both the 2040s and 2080s, relative to 1970-1999.
Severely water-limited forests are projected to occur on the east side of the
Cascade Range and in the northeastern part of the state. Increasing drought stress
in water-limited forests is likely to lower forest productivity and result in forest loss
in some areas, while also increasing vulnerability to disturbance (e.g., fire, insects,
pathogens). 63
● Increasing wildfire frequency and area burned. More frequent and intense summer
drought conditions reduce fuel and soil moisture, increasing the annual area
burned by forest fires. One study estimates the area of Northwest forests burned
annually will increase by 76% to 310% by 2070-2099 under a high GHG scenario
relative to a 1971-2000 baseline. Increases in area burned are projected to vary
across the region, with most of the increase occurring in drier, east-side forests.
However, increasing summer drought conditions could result in more area burned
in western Washington forests that have not traditionally been considered fire-
prone.21
● Increasing prevalence of forest pathogens and insect outbreaks. Milder winter
temperatures and drought stress are driving increases in forest disease and insect
outbreaks, contributing to increased tree mortality. Over the past 30 years, tree
mortality caused by bark beetles in the western United States has exceeded
mortality caused by wildfire. 64 Insect outbreaks are likely to become more common
and widespread as drought stress weakens tree defenses and milder winters
reduce insect mortality. As a result, the area susceptible to mountain pine beetle
(Dendroctonus ponderosae) outbreak is projected to increase by 27% from 2001-
2030 compared to 1961-1990 across the western United States. However, by the
end of the century (2071-2100), temperatures are likely to exceed the beetle’s
thermal optimum, resulting in a decline of area susceptible by 49-58%. Ranges of
other bark beetles such as the pine engraver beetle (Ips pini) may also decrease by
63
Holden, Z., Swanson, A., Luce, C., Jolly, W., Maneta, M., Oyler, J., . . . Affleck, D. (2018). Decreasing fire season precipitation increased
recent western US forest wildfire activity. Proceedings of the National Academy of Sciences of the United States of America., 115(36).
64
Hicke, J. A., A. J. H. Meddens, and C. A. Kolden, 2016: Recent tree mortality in the western United States from bark beetles and forest
fires. Forest Science, 62 (2), 141–153.
17the end of the century. 65
● Altered phenology. For high elevation tree species, warming is expected to favor
earlier growth initiation (due to less time required to meet the warming
requirement). At lower elevations, warming is expected to favor delayed growth-
initiation (due to more time required to meet the chilling requirement). Other
phenological shifts affecting the timing of growth-initiation, budding and flowering
are broadly expected across many plant taxa, with cascading effects across trophic
levels throughout the forest food web. For example, huckleberry fruiting is
projected to shift 24-52 days earlier by the end of the century under a high GHG
scenario, shifting the seasonality of an important food resource for game species
like black bear (Ursus americanus). Phenological mismatches may become more
common in the future (e.g., as warming shifts the timing of plant flowering earlier
relative to their pollinators' emergence in the spring or as the timing of pollen
release and female flower receptivity become decoupled). 66
The cumulative impacts of warming, altered hydrology, and increasing natural
disturbances are driving range shifts in tree species, forest-associated animals
and invasive species, resulting in altered forest community composition.
● Declines in late-seral forests and associated species. Increasing frequency and severity
of natural disturbances (e.g., fire, forest disease, insect outbreaks) are reducing
habitat and driving range contractions for species that depend on late-seral forests
(a PHS priority habitat), including PHS-listed species such as the marbled murrelet
(Brachyramphus marmoratus), northern spotted owl (Strix occidentalis caurina),
pileated woodpecker (Dryocopus pileatus), American marten (Martes americana) and
Pacific fisher (Pekania pennanti). 67 68
● Increases in early-seral forests and associated species. The increasing prevalence of
forest disturbances is driving increases in habitat for early-seral species that thrive
in open-canopy forests and forest openings with abundant grasses, forbes and
shrubs. Animal species that benefit from increasing early seral and post-
disturbance forest landscapes include game animals like deer, elk and black bear
as well many bird species, including the PHS-listed black-backed (Picoides arcticus)
and white-headed woodpeckers (Leuconotopicus albolarvatus). 69
● Spread of invasive species. Higher temperatures, altered precipitation regimes and
65 Barbara J. Bentz, Jacques Régnière, Christopher J Fettig, E. Matthew Hansen, Jane L. Hayes, Jeffrey A. Hicke, Rick G. Kelsey, Jose F.
Negrón, Steven J. Seybold, Climate Change and Bark Beetles of the Western United States and Canada: Direct and Indirect Effects,
BioScience, Volume 60, Issue 8, September 2010, Pages 602–613.
66 Ford, Kevin R, Harrington, Constance A, Bansal, Sheel, Gould, Peter J, & St Clair, J Bradley. (2016). Will changes in phenology track
climate change? A study of growth initiation timing in coast Douglas-fir. Global Change Biology., 22(11), 3712-3723.
67 Thom, Dominik, Golivets, Marina, Edling, Laura, Meigs, Garrett W, Gourevitch, Jesse D, Sonter, Laura J, . . . Keeton, William S. (2019).
The climate sensitivity of carbon, timber, and species richness covaries with forest age in boreal–temperate North America. Global
Change Biology, 25(7), 2446-2458.
68 Halofsky, Joshua S, Conklin, David R, Donato, Daniel C, Halofsky, Jessica E, Kim, John B, & Carcaillet, Christopher. (2018). Climate
change, wildfire, and vegetation shifts in a high-inertia forest landscape: Western Washington, U.S.A. PloS One, 13(12).
69 Swanson, Mark E, Studevant, Nichole M, Campbell, John L, & Donato, Daniel C. (2014). Biological associates of early-seral pre-forest in
the Pacific Northwest. Forest Ecology and Management, 324, 160-171.
18You can also read