Planning for Climate Change Effects on Coastal Margins - A report prepared for the Ministry for the Environment as part of the New Zealand Climate ...
←
→
Page content transcription
If your browser does not render page correctly, please read the page content below
Planning for Climate Change
  Effects on Coastal Margins

       A report prepared for the
     Ministry for the Environment
             as part of the
New Zealand Climate Change Programme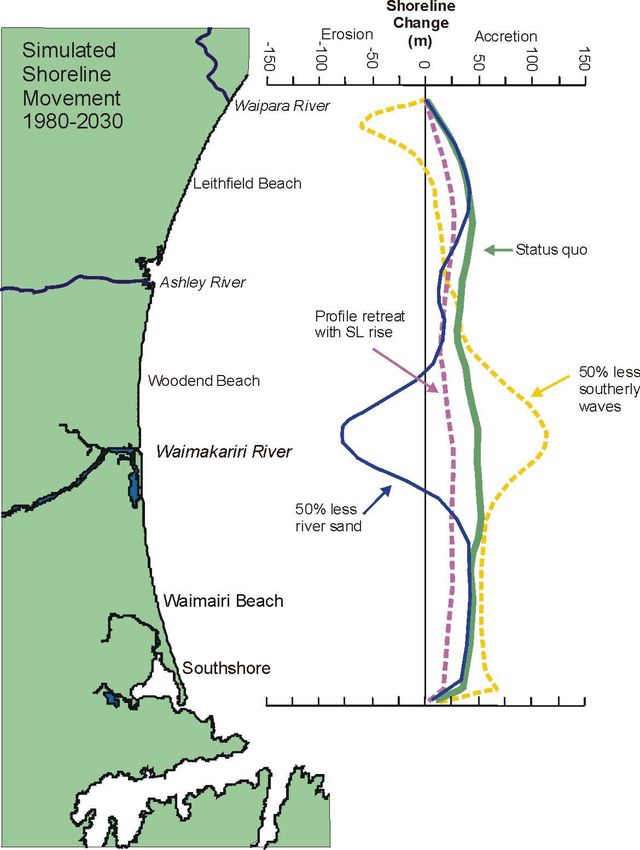
Disclaimer: The opinions expressed in this report are those of
the authors and do not necessarily represent the views of the
New Zealand Climate Change Programme. No liability is
accepted by the Ministry for the Environment for the factual
correctness of the report’s contents or any information derived
from data presented in this report.

                 RG Bell, TM Hume, DM Hicks
    National Institute of Water & Atmospheric Research Ltd
           PO Box 11-115, Hamilton, New Zealand

             Published in September 2001 by the
                Ministry for the Environment
           PO Box 10-362, Wellington, New Zealand

                     ISBN 0-478-24040-6
                          ME 410
Acknowledgements
Special thanks to all the contributors (Appendix B) who took the time to reply to yet
another email or chatted and supplied worthwhile comments to broaden the scope of
this report. In particular we thank Keith Smith, Derek Todd, Jim Dahm, Blair Dickie,
Jenny Ridgen, Jeremy Gibb, John Beaven, Apanui Skipper, Simon Thrush, Alf Norkko,
Malcolm Green and Ken Murray for in-depth discussions, material, reports and
diagrams. The authors are grateful for the comments and suggestions made by the
reviewers (Terry Healy, Brodie Young, Laurie McCallum, Mike Jacobson, Jim Dahm,
Denise Young, Keith Smith, Scott Stephens and Karin Bryan).

Thanks to Andy Reisinger (Ministry for the Environment) for facilitating the process,
and for his support. Kath MacLeod (NIWA) produced the superb graphics, and Keith
Smith supplied most of the photos. Partial funding by the Foundation for Research,
Science and Technology (Contract #C01X0015) is acknowledged.

                                     Planning for Climate Change Effects on Coastal Margins   iii
Planning for Climate Change Effects on Coastal Margins iv
Contents
Executive Summary

1   Scope of the Global Warming Problem for Coasts

2   New Zealand’s Coastal Scene

3   Setting the Scene: Climate Change and Coastal ‘Drivers’
    3.1   Some key definitions
    3.2   The role of the oceans in climate change
    3.3   ‘Drivers’ of coastal change

4   Climate Change Projections for Coastal Drivers
    4.1   IPCC assessment process
    4.2   IPCC climate projections
    4.3   Regional climate change projections
    4.4   Role of monitoring
    4.5   Sea-level rise around New Zealand
          What has caused this rise?
          Relative sea-level projections for New Zealand
    4.6   Dynamic sea-level variability
    4.7   Temperature rise
    4.8   Sediment supply

5   Climate Change Impacts on Coastal Margins
    5.1   Sea-level rise impacts
          Coastal flooding and inundation
          Shoreline migration by sediment movement
          Drainage and protection of lowland areas
          Salinisation of lowland rivers, surface waters and aquifers
    5.2   Impacts from changes in rainfall and hydrological/oceanographic patterns
    5.3   Impacts from changes in storm and cyclone patterns
    5.4   Impacts from temperature rise
    5.5   Overview

6   Responses to Climate Change
    6.1   Vulnerability and adaptive capacity
    6.2   Response options
          Planned retreat
          Adaptation (or accommodation)

                                        Planning for Climate Change Effects on Coastal Margins   v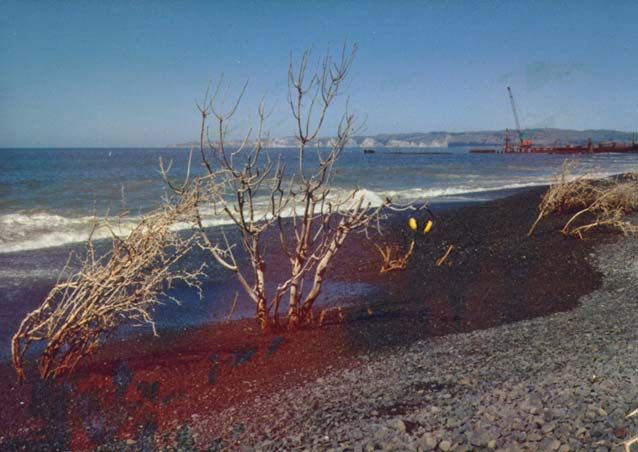
Protection (or defence)
    6.3   Effects on Maori
    6.4   Community awareness of climate change hazards
    6.5   Planning issues
          Planning framework under the Resource Management Act
          Planning for climate change hazards

7   Conclusions

Glossary and Abbreviations

Appendices
    Appendix A: Information Gaps and Monitoring Needs
    Appendix B: Contributors and Reviewers

References

                                    Planning for Climate Change Effects on Coastal Margins   vi
Executive Summary
This report addresses the impacts of climate change and global warming on coastal
margins. It complements the more general overview of climate change impacts on New
Zealand published by the Ministry for the Environment/New Zealand Climate Change
Programme in July 2001 (MfE, 2001). The report aims to assist resource managers and
planners to understand the underlying impacts and issues in climate change and sea-
level rise, and to provide guidance in planning and the development of mitigation or
adaptation strategies for coastal communities.

Effects of global warming, climate change and
sea-level rise
•    ‘Climate change’ is defined as any significant change or trend in climate – natural or
     human-induced, and includes global warming.
•    “There is new and stronger evidence that most of the global warming observed over the
     last 50 years is attributable to human activities” (IPCC, 2001a).
•    The sea level has risen 0.3 m since the mid 1800s and sea temperature by 0.4 to 0.5°C
     since 1870. This rise is expected to continue and accelerate.
•    Relative sea-level rise in New Zealand is most likely to be 0.14 to 0.18 m by 2050 and
     0.31 to 0.49 m by 2100.
•    Oceans are a vast heat ‘reservoir’, so it may take centuries for the oceans to cool and for
     sea-level rise to level out, even after curtailing greenhouse gas emissions.
•    Regional New Zealand climate projections for the 2080s by the National Institute of
     water and Atmospheric Research Ltd (NIWA) are for:
     – a rise in mean air temperature of 1.6 to 2.2°C (winter) and somewhat less in summer
       will increase sea temperatures in estuaries and coastal waters, affecting aquatic
       ecosystems
     – extreme storms are unlikely to be more frequent, but may be more intense, especially
       with regard to rainfall and wind strength
     – a more westerly wind stream over New Zealand (more El Niño-like)
     – sediment supply to the coast to be affected in a number of ways by climate change,
       such as changes in river flows (and sediment load) after heavy rainfall, winds, wave
       climate and currents.
     These projections are based on the assumption of continued increase in
     greenhouse gas emissions and use current global climate model results.
     Uncertainties are associated with both projected greenhouse gas emissions and
     model calculations.

                                        Planning for Climate Change Effects on Coastal Margins   vii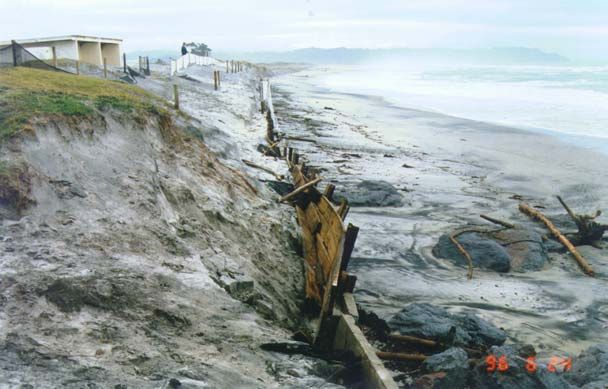
Pressures on our coastal areas
•   There are huge pressures to develop and occupy the coast (for subdivisions, marinas,
    roads and drainage). Beach-front property prices continue to escalate in most beach
    resorts.
•   At vulnerable coastal margins, coastal development and global warming are on an
    eventual collision course (if they have not collided already), which will result in further
    ‘coastal squeeze’ between the land and the sea.
•   Developed areas around the New Zealand coast are usually nestled in or near low-lying
    coastal margins, such as beaches, estuaries and harbours, and will therefore become
    increasingly vulnerable to the effects of global warming.

Expected impacts on coastal margins
•   Sea-level rise relative to the landmass is the main concern locally, rather than global sea-
    level rise per se. Local effects, such as subsidence and tectonic movements, can cause a
    departure, up or down, on the global average.
•   Parts of the coastline have historically been eroding or retreating, and climate change will
    exacerbate these trends.
•   Sea-level rise will eventually lead to permanent inundation of very low-lying margins,
    episodic sea flooding of higher margins, increased coastal erosion, salinisation of adjacent
    freshwater, drainage problems in adjacent low-lying areas, and further coastal squeeze
    where shorelines are held and constrained by structures such as seawalls and stopbanks.
•   Climate change will affect not just sea-level rise, but most physical drivers that shape
    coastal margins and ecosystems, such as winds, waves, storms, sediment supply and sea
    temperature.
•   Predicting shoreline response as a result of climate change is complex, and simpler
    conceptual models based solely on sea-level rise are of limited use. Beach response will
    also depend on factors such as sediment supply, wave climate, storm frequency and
    alongshore changes in sediment movement.
•   Wind and wave changes will alter sediment movement and coastal upwelling of cooler
    nutrient-rich ocean waters, which are important for coastal productivity, including
    fisheries.
•   Increase in storm rainfall intensities will lead to lowland river flooding and impacts on
    water quality from increased sediment loads to estuaries, although sediment availability
    will also depend on catchment land-use and construction practices.
•   Aquatic ecosystems will be affected by rising temperatures (air and water), potential loss
    of habitat from constraining stopbanks in some areas, and increases in sediment loads
    entering estuaries during storms in other areas.
•   The sea level around New Zealand is presently rising at a steady rate. This is projected to
    accelerate, which will exacerbate coastal erosion, flooding and (for some areas)
    permanent tidal inundation.

                                       Planning for Climate Change Effects on Coastal Margins   viii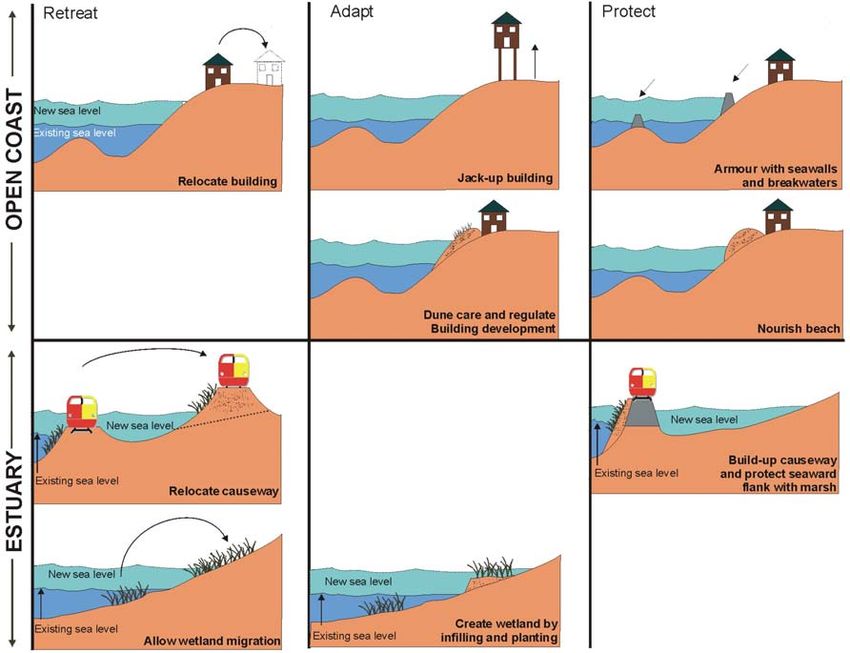
•   Impacts on coastal margins will differ between regions and even between localities within
    regions, depending on shoreline parameters (such as slope, erodibility, sediment type),
    sediment supply, and potential offshore changes in wave climate and sediment
    movement.

Assessment of vulnerability and adaptation
options
•   There is need for education about the unique consequences of global warming for coastal
    margins. A better informed public should engender a growing acceptance of these
    consequences and assist buy-in to prudent response options at the local level.
•   Diversity of coastal types requires local or regional investigations and solutions.
•   The vulnerability and adaptive capacity of ecosystems and human systems (communities,
    infrastructure, economy, insurance) need assessing before feasible and environmentally
    appropriate responses to sea-level rise and other climate change impacts are decided.
•   In largely undeveloped areas, pre-planned retreat by way of setback hazard zones is the
    only cost-effective long-term option.
•   For communities or infrastructure that are vulnerable, managed retreat and adaptation are
    the only reasonable long-term options, given that sea level is projected to continue rising
    for several centuries.
•   Continued or new protection options for high-density population beaches, such as beach
    re-nourishment or holding structures, may be the only palatable solution in the medium
    term (several decades) because of the large investment in real estate. However, situations
    that may require new protection measures are complex, particularly if those measures are
    likely to have significant adverse environmental effects. This is counter to the intent of
    the Resource Management Act 1991 (RMA) and the New Zealand Coastal Policy
    Statement.
•   A robust planning and policy framework is already in place to manage and mitigate
    natural coastal hazards, under the umbrella of the RMA. However, the framework needs
    some fine tuning to ensure that integrated management across coastal margins and long-
    term (over 100-year) planning occur, possibly through a revised New Zealand Coastal
    Policy Statement and Building Act 1991. It must also continue to be flexible at regional
    and local scales.
•   Topography and cadastral databases for coastal margins need to be upgraded before the
    scale of the sea-level rise impacts and feasible response options can be assessed on local,
    regional, and national scales.

                                        Planning for Climate Change Effects on Coastal Margins   ix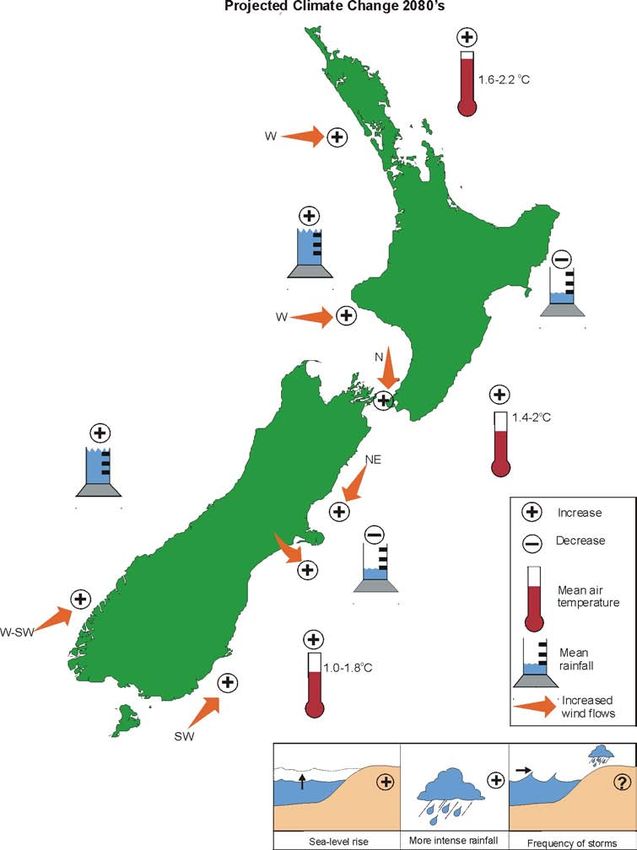
Conclusions
•   We have time to plan prudently.
•   We have a robust policy framework to deal with coastal hazards and, by inference, any
    climate change effects.
•   We have prior knowledge of climate change impacts, albeit uncertain in scale, timing and
    local detail.
•   Education, discussion and gradual adjustment to sustainable long-term response options
    are now vital keys to adapt to the effects of global warming on our coastal margins.

          The challenge is not to find the best policy today for the next 100 years, but
          to select a prudent strategy and to adjust it over time in the light of new
          information.
                                                                                IPCC, 1996

                                      Planning for Climate Change Effects on Coastal Margins   x
1 Scope of the Global Warming
Problem for Coasts
This report addresses planning for climate change effects on coastal margins. It
complements the more general overview of climate change impacts on New Zealand
recently published by the Ministry for the Environment (MfE, 2001). The aim of the
report is to convey information that will help address two fundamental questions:
• What changes will global warming make in our coastal locality?
• What can be done about these changes?
Socioeconomic pressures to develop and occupy coastal and estuarine margins1 are
growing faster than ever, as more New Zealanders clamour to be near the sea – to
live, holiday and play. Many of our major urban areas already encroach on harbours
or estuaries. Worldwide, over 20% (some 1.2 billion people) live near a coastline, but
this proportion is expected to rise rapidly (IPCC, 2001b). This social pressure for
coastal development is largely oblivious to the reality of global warming due to the
enhanced greenhouse effect from human activities, and to resulting long-term changes
to coastal hazards that will impinge on coastal margins.
New Zealanders have only a moderate knowledge about climate change issues. A
survey showed that 51% claimed they knew a “fair amount”, but the survey analysis
suggests that these were often fairly generous self-assessments (UMR, 2001). There
was even less concern about the impacts of global warming. From our own contacts
with the general public, it would appear that few are aware that sea level and sea
temperatures around New Zealand have already been rising for some time, with data
to confirm this rise going back to the mid 1800s. Projections are for the rise in sea
level to accelerate and continue for several centuries. Even a very small acceleration
in the rise of sea level during the 21st century could eventually lead to catastrophic
situations in some developed areas if mitigation or adaptive plans are not
progressively put in place. Coastal erosion, flooding by the sea or backed-up rivers,
drainage difficulties and damage to property in coastal margins are expected to
progressively worsen as global warming changes the balance of our climate. These
hazards pose little risk to undeveloped coastal margins other than loss of land.
Put simply, communities and coastal margins in many localities are on a slow, but
sure, collision course. Like the sunbathers on the beach ignoring the encroaching
high tide, we have shown little inclination to implement long-term mitigation and
adaptation strategies or ultimately plan our retreat from the coastline where this is
expected to become necessary. Most existing coastal erosion hazard problems result
from development being too close to the sea to accommodate the natural cycles of
cut-back and advance of the shoreline. There is little doubt that global warming
impacts will exacerbate these same problems in the long term through sea-level rise
and other climatic changes which impact on the coastal margin.
1
See the Glossary for a definition of ‘coastal margin’.
Planning for Climate Change Effects on Coastal Margins 11One of the physical functions of a coastal margin is to absorb the energy generated by
waves, any temporary rise in sea level (or storm surge) during storms, and the regular
twice-daily dose of tides. In other words, the coast as we see it today is the integrated
response of a very dynamic marine environment and a near-static terrestrial
environment. In many developed areas this function is compromised by construction
of dwellings, roads, seawalls and stopbanks (Figure 1). Such changes constrain the
ability of coastal margins to respond dynamically to existing coastal processes, let
alone future climate change. These constraints result in ‘coastal squeeze’ as an
outcome of the collision between naturally dynamic coasts and relatively static coastal
communities.
Figure 1: Timber
seawalls have been
placed to mitigate
coastal erosion at Cooks
Beach (Coromandel
Peninsula). The photo
captures the concept of
“coastal squeeze”, where
dwellings are quite close
to an eroding beach,
leaving little room for
natural cycles of cut-
back and advance of the
shoreline. [Photo
(1996): RK Smith]
Part of the essential message of this report is that climate changes likely to occur over
the next 50 to 100 years will aggravate this coastal squeeze in developed coastal
areas. Ultimately, it will probably be almost impossible to maintain communities and
infrastructure that have been placed too close to the sea to accommodate the projected
changes, while also protecting the coastal environmental values critical to our
economy and our quality of life, and that draw us to the coast in the first place.
The most serious physical impacts of gradual sea-level rise on coastal margins may
be:
• coastal inundation, causing landward movement of estuaries, wetlands and marshes
• coastal erosion and shoreline change through sediment movement
• increased vulnerability to coastal storm damage and flooding
• increasing difficulty draining coastal and river lowlands
• the possibility of increased sediment loads to estuaries, with projected increases in
rainfall intensity and run-off
• surface water, river water and groundwater in lowlands increasingly becoming saltier
from seawater intrusion.
The primary ecological impacts will stem from a rise in temperature (air and water),
inundation by a higher sea level, and a loss of habitat from increased siltation in some
Planning for Climate Change Effects on Coastal Margins 12estuaries and harbours, while in others there will be a loss of intertidal areas caused by
constraining shoreline protection structures or embankments.
Sea-level rise will obviously cause many of the impacts unique to coastal margins, but
other coastal ‘drivers’ or physical forcing agents affected by climate change – such as
river flows, winds, waves, storm intensity, and perhaps storm frequency – will create
their own impacts, besides exaggerating or mitigating the impacts of sea-level rise.
If the increasing rate at which people are moving to the seaside continues for some
time, then educating people about the consequences of global warming on coastal
margins is a key to planning and minimising the impacts on society. Underlying this
issue are two fundamental questions:
• What changes will global warming make in our coastal locality?
• What can be done about it?
This report addresses these two questions by presenting the latest projections on
climate change and how they are likely to affect coastal margins around New Zealand.
Sections on long-term planning and response options, human and cultural issues, and
information gaps are provided to assist the transformation of climate change
information into effective statutory or hazard mitigation plans and public education
initiatives. Much of the material is presented by way of case studies or schematic
diagrams.
Planning for Climate Change Effects on Coastal Margins 13• Sea level around New Zealand is rising. This rise is
projected to accelerate, causing more coastal
erosion, inundation and episodic flooding from
storms.
• There are huge pressures to develop and occupy
the coast (subdivisions, marinas, roads, drainage).
• Coastal development and global warming are on a
collision course at coastal margins, resulting in
‘coastal squeeze’.
• There is a need for education about the unique
consequences of global warming for coastal margins,
before buy-in will occur to precautionary responses.
• This report aims to assist resource managers and
planners to develop mitigation or adaptation
strategies for coastal communities.
Planning for Climate Change Effects on Coastal Margins 142 New Zealand’s Coastal Scene
New Zealand has about 18,000 km of coastline, indented by some 350 estuaries,
harbours, inlets, bays or fiords. Coastal margins are the transition between the ocean
and the land, and the place where seawater mixes with freshwater and interacts
occasionally with the fringing low-lying land during storms or extreme tides. Climate
change impacts will vary locally as a result of local and regional differences in both
the physical forcing functions (for example, waves, winds, currents, sea level) and
coastal types. A broad-scale distribution of New Zealand coastal types, distinguishing
‘bold’ (steep, rocky), headland-bay, low-cliffed, depositional (mobile sediments) and
beaches is shown in Figure 2. Estuaries and their associated low-lying margins
(coastal plains, wetlands, salt marshes) are particularly vulnerable to climate change.
Figure 2: Geomorphic
types around the New
Zealand open coast (after
McLean, 1978). Climate
change and sea-level rise
impacts would be least
on bold coasts and
greatest on depositional
coasts and beaches.
Planning for Climate Change Effects on Coastal Margins 15A quick glance at Figure 2 may suggest that New Zealand’s vulnerability to rising sea
levels is low, due to the extensive lengths of high rocky or cliffed coast. But there are
two types of coastline at risk. Some cliffed coasts are eroding at high rates, such as
the unconsolidated alluvial cliffs in the Canterbury Bight, which may worsen with
increased storminess and sea-level rise. However, the most vulnerable areas are
where our urban centres, ports and holiday resorts cluster around low-lying portions
of the coastline, such as harbours, estuaries, beaches, inlets and bays. They are there
because these types of coastal environments are attractive aesthetically, places for
recreation and access to the sea, or are functional as sheltered vessel moorings and
ports.
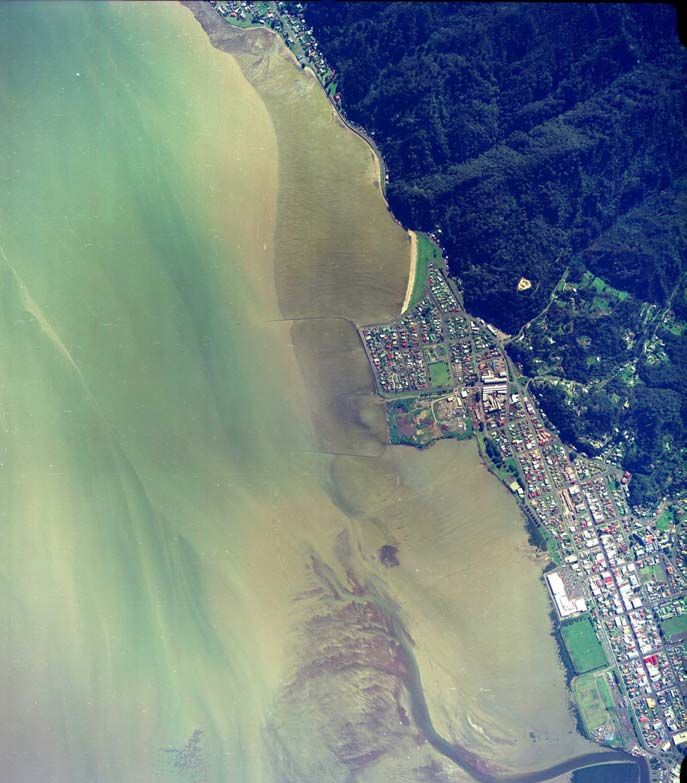
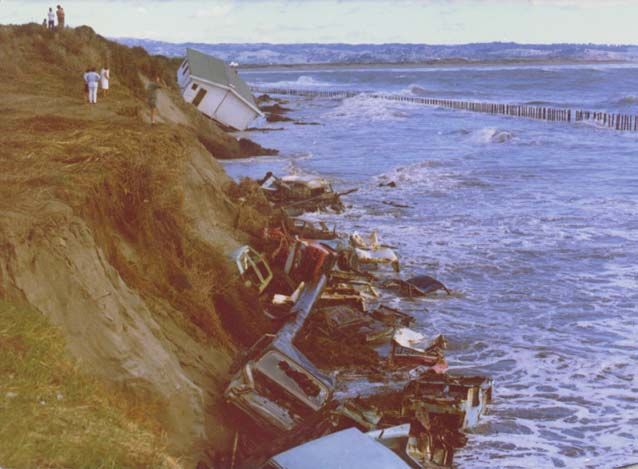
Coastal environments already vulnerable to erosion or flooding hazards are most at
risk from the impacts of global warming, but at least in these localities there is some
residual knowledge of the potential hazards. For instance, coastal erosion can result
in loss of dunes and beach area when seawalls are built (Cooks Beach, Figure 1), or
damage and loss of property (Ohiwa Spit, Figure 3). Many coastal communities in
low-lying coastal margins that have little history of erosion or coastal flooding may be
more vulnerable in the long term because of greater resistance to precautionary
response and adaptation plans. Territorial authorities have had a major struggle to get
coastal hazard set-back zones accepted in established communities (for example,
Papamoa Beach and even the more erosion-prone Waihi Beach), especially when
home-owners find they are located seaward of the proposed set-back boundary.
Figure 3: Catastrophic
erosion at Ohiwa Spit west
of Opotiki (Bay of Plenty)
in April 1976 showing the
futile efforts to defend the
shoreline. Over the last
two decades, the spit has
subsequently built out
seaward by around 200 m
to cover the railway-iron
protection seen offshore.
[Photo: RK Smith]
Maori have a special affinity for both the land (whenua) and the sea (moana), where
fish and seafoods (kaimoana) are prized. As a consequence, there will be cultural
impacts of global warming for Maori, especially with respect to any loss of land (and
associated marae, middens and urupa) from erosion or flooding, and loss of habitat for
kaimoana.
The spectrum of marine ecosystem habitat types around New Zealand ranges from
exposed and wild cliff-lined or rocky coasts, through to quiescent waters within a
mangrove stand or salt marsh at the upper reaches of an estuary. Coastal ecosystems
Planning for Climate Change Effects on Coastal Margins 16are threatened by sea-level rise because extensive areas of wetlands, salt marsh and
intertidal habitats lie at or just above sea level. But in some respects New Zealand is
fortunate. Being a steep landmass with relatively narrow coastal margins, we are not
vulnerable to the kinds of massive disruptions from global-warming impacts faced by
countries such as Bangladesh (where 16% of rice-growing land is lower than 1 m
above high tide), the Netherlands (increasingly more land below sea level) and some
of our Pacific Island neighbours who live on low-lying atolls.
Along New Zealand’s coastal margin the most serious impacts induced by climate
change will be sea-level rise (permanent or storm sea flooding) and changes in
climate and weather patterns, which may alter coastal sediment budgets (‘sand in the
bank’). Even minor shifts (positive or negative) in sediment delivered to the coast
from the adjacent catchments could create long-term shifts in coastline movement.
Historical rates of erosion and accretion around New Zealand’s open coastline are
shown in Figure 4. While this nearly 20-year-old database desperately needs
updating, it provides a picture of a patchy spatial distribution of shorelines that are
advancing and eroding. Sea-level rise and climate change is likely to lead to
markedly more eroding areas on the coast, particularly where sand or gravel supplies
to the coastline are reduced by changes to rainfall, river flow, windiness, and storm
frequency and intensity caused by global warming. There will very likely be areas
where sediment supply or availability increases above historical rates, particularly if
storm rainfall intensity increases, leading to advancing shorelines. Sea flooding and
rising sea and estuary temperatures will also have significant impacts on ecosystems.
Figure 4: Historic rates of open-coast erosion and accretion (ca. 1880–1980) around the New Zealand
coast from Gibb (1984). (This type of national overview urgently needs updating.)
Planning for Climate Change Effects on Coastal Margins 17The variability of New Zealand coastal types and different exposures to physical
forcing functions (such as east versus west coasts) means that mitigating or adapting
to the impacts of climate change for such a wide range of environments will entail
different local investigations and solutions.
A warming world has already caused changes. Sea level around New Zealand has
risen on average around 0.3 m since the mid 1800s (Bell et al., 2000), and coastal sea-
surface temperatures have risen by around 0.4 to 0.5°C since 1870 (Folland and
Salinger, 1995).
• Developed areas are mostly near desirable
beaches, estuaries and harbours, but by their very
low-lying, accessible nature are vulnerable to the
effects of global warming.
• Parts of the coastline have historically been
eroding or retreating, and climate change will
exacerbate these trends in some locations.
• Diversity of coastal and catchment types requires
local or regional investigations and solutions.
• The sea level has risen 0.3 m since the mid-1800s
and the sea temperature by 0.4 to 0.5°C since 1870.
Planning for Climate Change Effects on Coastal Margins 183 Setting the Scene: Climate
Change and Coastal ‘Drivers’
3.1 Some key definitions
Some working definitions for terms we use are important to avoid misunderstandings.
Other terms are listed in the Glossary.
Climate is the ‘average’ state of weather in a region over periods of seasons or longer.
Climate change refers to any significant change or trend in climate over time, either
the mean state of climate and/or its variability (for example, extremes of temperature
or rainfall, the retreat or advance of glaciers, the El Niño–Southern Oscillation). The
Intergovernmental Panel on Climate Change (IPCC), which was formed jointly by the
United Nations Environment Programme and the World Meteorological Organisation
to regularly assess global climate change, investigates climate change due to both
natural variability and as a result of human activity.
Global warming is often used synonymously with climate change due to human
activity, the former being an expression the public identify with more readily (UMR
Research Ltd, 2001), although climate change will incur more than just a rise in
temperature, which is implicit in the term global warming. At times there can be
uncertainty on whether climate change of a particular variable has occurred, because a
small long-term trend or change must be distinguished from regular natural variability
in any set of measurements.
Climate projection is a projection of the response of the climate system to emission
scenarios of greenhouse gases and aerosols and other radiative forcing, usually based
on simulations by a numerical climate model. Climate projections are distinguished
from climate predictions, to emphasise that projections depend on model assumptions
and the particular scenarios used, which in turn are based on assumptions concerning
future socioeconomic trends, emission rates and technological developments, that
may or may not be completely realised. Thus every climate projection must be seen
as a plausible future development that is consistent with a certain set of assumptions,
not a scientifically stated certainty.
Global sea-level rise refers to the average vertical rise across the world’s oceans.
Relative sea-level rise is the net rise relative to the landmass in a region, which is the
sum of the local subsidence (or uplift) of the coastal margin and the absolute sea-level
contribution in that region (which may in itself depart from the global average value
in different regions). Tide gauges around the open coast and inside harbours measure
relative sea level. Why the distinction? Because the long-term projections of sea-
level rise made every five years by the IPCC are global average absolute rates, but in
any particular region or locality it is the relative sea-level rise that determines the
long-term susceptibility to coastal flooding and erosion. Therefore, the projected
IPCC global rates need to be translated into relative rates for each region.
Planning for Climate Change Effects on Coastal Margins 19This is made somewhat easier in New Zealand because, by and large, our relative sea-
level rates at the major ports are similar to the global average. However, it is unlikely
that these relative sea-level rates apply everywhere around New Zealand all the time.
Along some New Zealand coasts, seismic events can cause rapid or unsteady changes
in relative sea level over localised areas. It is impossible to know when, where, and
by how much, but research and monitoring of land movements can usefully pinpoint
areas that are more vulnerable to either seismic uplift or subsidence. This irregular or
episodic shift in the local landmass is usually impossible to quantify in order to
combine with the trend of increasing global sea level to produce a reliable figure for
any given area.
3.2 The role of the oceans in climate change
The ocean is a key player in the global climate system, moderating atmospheric
temperature rises and absorbing CO2. Oceans are large reservoirs of heat, and they
change their temperature only slowly, but over time the cumulative effects of warmer
air temperatures are manifested by thermal expansion of warmer upper-layer seawater
and extra water volume from glacier and ice cap melt, causing the sea level to rise.
The sheer size of the ocean heat reservoir means, even given a curtailment of
greenhouse gas emissions, that several centuries may pass before rising sea level due
to thermal expansion slows down (IPCC, 2001a).
Over the past few decades, public awareness raising about the effects of climate
change on coastal margins has been entirely focused on the rise in sea level.
However, other changes in climate (temperature, rainfall, wind flows, ocean currents
and El Niño) and weather (storms, winds and waves) will also pose additional issues
for the coast, either directly or indirectly. For example, a change in rainfall patterns in
the Southern Alps will affect flows in the main Canterbury feeder rivers, how much is
abstracted for irrigation, and therefore how much sand and gravel is supplied to the
coast.
3.3 ‘Drivers’ of coastal change
It is important to distinguish the different physical ‘drivers’ or forcing agents (Figure
5) of physical and ecological change in coastal margins. Climate change will
eventually affect all these drivers, either directly, or through their interaction with
other drivers. For example, global ocean tides will be unaffected directly, but tidal
propagation characteristics in shallow estuaries and rivers may be altered by deeper or
shallower water depths (caused by changes in sediment supply) and/or a higher sea
level.
Planning for Climate Change Effects on Coastal Margins 20Figure 5: The key physical “drivers” or forcing
agents that govern change in coastal and
estuarine systems. Climate change will
eventually affect all these drivers either
directly or indirectly.
Sediment supply can be affected by a myriad of catchment and ocean factors
including:
• catchment geology and rainfall
• river flows
• frequency and magnitude of storms
• river controls (for example, dams, abstraction for irrigation)
• sand and gravel extraction for aggregate
• ocean wave climate
• prevailing winds
• alongshore currents
• the type of foreshore and its sedimentary composition.
The next section describes expected changes in some of these physical drivers as a
result of global warming, based on historical data and future regional climate
projections. Most is known about sea-level rise and temperature; we are less certain
about other drivers of coastal change because of complex interactions between drivers
and climate changes, and about specific regional variations compared to global or
hemispheric averages.
Planning for Climate Change Effects on Coastal Margins 21• Climate change is any significant change or trend in
climate, natural as well as human-induced, and
includes global warming.
• Regional sea-level rise relative to the landmass is
what will affect us locally, rather than the average
global sea-level rise.
• Oceans are a vast heat reservoir, so that it will take
centuries to cool and slow down sea-level rise, even if
greenhouse gas emissions are curtailed immediately.
• Climate change – not just sea-level rise – will affect
most physical drivers that shape coastal margins and
ecosystems.
Planning for Climate Change Effects on Coastal Margins 224 Climate Change Projections for
Coastal Drivers
4.1 IPCC assessment process
Every five years since 1990 the Intergovernmental Panel on Climate Change (IPCC),
established by the United Nations Environment Programme and the World
Meteorological Organisation, has produced an assessment report on the state of global
climate change. The main outputs of Working Group I of the IPCC are future climate
projections on temperatures, greenhouse gas levels and sea-level rise, along with
some general statements on the potential effects on El Niño cycles, extreme events,
snow/ice melt, etc. Working Group II assesses the impacts of the projected climate
changes on natural and human systems, and how humans can adapt to those changes.
Working Group III reports on technological and social mitigation options to reduce
future emissions of greenhouse gases, and their expected economic impact (for
example, the implementation of the Kyoto Protocol).
The IPCC has developed procedures for the preparation, review and approval of its
assessment reports aimed at guarding their objectivity and ensuring all relevant
information is considered. Report preparation and review involves large numbers of
scientific experts from most countries of the world. Two previous assessment reports
were produced in 1990 and 1995. The Third Assessment Report (TAR) for Working
Group I was released in Shanghai in January 2001 in the form of a Summary for
Policymakers, followed by a more detailed Technical Summary and the full
underlying report in June 2001 (IPCC, 2001a). The full report was compiled over 2½
years by 122 lead authors and 515 contributing authors, and subject to 420 reviewers.
The draft Summary for Policymakers was adopted line by line at the Shanghai
meeting by government officials and scientists from each country to reach a
consensus document, with the agreement of the lead authors of the underlying report.
The scientific process and questions that Working Group I of the IPCC worked
through and then published as its contribution to the Third Assessment Report are
summarised in Figure 6. Working Groups II and III went through a similar process to
produce their Summaries for Policymakers, Technical Summaries and full underlying
reports (IPCC, 2001b, 2001c).
Planning for Climate Change Effects on Coastal Margins 23Figure 6: Key questions
posed by Working
Group I of IPCC about
the global climate
system. IPCC (2001a) is
a status or assessment
report that addresses
these questions via the
approach outlined.
Two of the main conclusions of the Third Assessment Report are worth quoting, as
for the first time there is a relatively high degree of certainty expressed that human-
induced global warming has been demonstrated and is projected to continue. In the
previous 1995 Second Assessment Report, the IPCC concluded that “the balance of
evidence suggests that there is a discernible human influence on global climate”.
Since then the evidence has become much stronger, based on the recent record global
warmth in the late 1990s, the improved paleo-record (for example, ice cores, tree
rings) that provides a longer context, improved modelling and simulation of the past
climate, and improved statistical analysis. Thus the headline conclusions of the 2001
Third Assessment Report are:
There is new and stronger evidence that most of the warming observed over the last
50 years is attributable to human activities.
Global average temperature and sea level are projected to rise under all IPCC ‘Special
Report on Emission Scenarios’ or SRES scenarios.
[The SRES scenarios cover a gambit of possible socioeconomic factors including
energy use, population growth, technological advances and environmental concerns.]
Summary for Policymakers (IPCC, 2001a)
A recent report in June 2001 by the US National Academy of Sciences, commissioned
by the White House, has also come out in support of the main conclusions of the 2001
IPCC Third Assessment Report (National Academy of Sciences, 2001).
Because of lag effects, particularly in the ocean, it may take some time for the effects
of global warming, such as acceleration in sea-level rise, to filter through. However,
the IPCC prognosis is for long-lasting effects in sea-level rise well beyond the 21st
century. The take-home messages are that:
• general agreement has been reached that global warming and accompanying sea-level
rise is already a reality
• there will be lingering effects of a sea-level rise for several centuries, even if
greenhouse gas concentrations were to be stabilised within this century.
Planning for Climate Change Effects on Coastal Margins 244.2 IPCC climate projections
Based on a good match of climate-ocean models with historical data, these same
models are then used to generate forward projections at least 100 years ahead using a
range of greenhouse gas emission scenarios. The models provide a means to estimate
the response of key climate variables, such as global temperature and sea level, to
various scenarios of climate forcing, such as fossil-fuel emission rates, other
greenhouse gases such as methane, population growth, and economic growth.
Figure 7 shows the various envelopes for global temperature and sea-level rise
produced by the IPCC in its Third Assessment Report. The darker middle envelope
covers the average projections of several climate models for a range of emission
scenarios, which we have called the ‘most likely’ zone in this report. The lightest
outer zones for sea level cover the upper and lower range of uncertainty in individual
model projections for all the emission scenarios that were evaluated by the IPCC, and
include a component of land-ice melt uncertainty.
Figure 7: IPCC (2001a)
climate model projections
up to 2100 for: (UPPER) Projected global temperature rise (IPCC, 2001)
global mean air
temperature rise, and
6.0
(LOWER) global mean
sea-level rise, both relative
Temperature rise after 1990 (deg C)
to 1990 levels. The “most- 5.0
likely” zone shows the
range of the average of
seven ocean-climate 4.0
model simulations for each
of 35 socio-economic/ 3.0 "
emission scenarios. The kely
s t li
adjacent medium-shaded "mo
regions show the range of 2.0
all seven models for all
35 scenarios. The outer 1.0
light-shaded zones for sea
level show the range of all
models and scenarios 0.0
2000 2020 2040 2060 2080 2100
including uncertainty in
Year
land-ice changes,
Planning for Climate Change Effects on Coastal Margins 25permafrost changes (e.g.,
thawing) and sediment
deposition, but excludes
changes in the Antarctic Projected sea-level rise (IPCC, 2001)
ice sheet.
1.0
Sea-level rise after 1990 (m)
0.8
0.6
0.4
ly "
st like
"mo
0.2
0.0
2000 2020 2040 2060 2080 2100
Year
4.3 Regional climate change projections
IPCC reports contain projections for globally averaged climate change, but it is
strongly acknowledged that the range in regional variation of climate and ocean
response could be substantial. There may be large local and regional departures from
the global climate change predictions, which can either reduce or exaggerate the
impact of climate change in different parts of the world.
The process of translating IPCC global predictions to likely regional climate and
coastal responses is a difficult technical and socioeconomic exercise. It includes
making sure that the level of resources that regional and national agencies should put
towards this is commensurate with the likely effects on regional environments,
communities and economies. The translation process is achieved technically by
running more detailed climate prediction models at regional scales (called
downscaling), with input from global general circulation models (GCMs) linking the
atmosphere with the ocean. But the results must be interpreted in the context of an
understanding of New Zealand’s climate and historical trends evident in monitoring
data.
Figure 8 summarises in schematic form the climate projections for the 2080s in
different regions of New Zealand.2 A collaborative programme called CLIMPACTS
also produces climate projections throughout the 21st century for New Zealand,
focusing on likely climate effects on primary production sectors.3 Regional and local
climate projections are generally less certain than global average predictions because
of the extra layer of complexity that local terrain adds, and because of the limited
2
See also web site: http://katipo.niwa.cri.nz/ClimateFuture/Scenarios.htm
3
Web site: http://www.waikato.ac.nz/igci/climpacts_webpage/index.htm
Planning for Climate Change Effects on Coastal Margins 26spatial resolution of global climate models. As a result, global climate models may
produce different regional climate projections even if they agree in their global
average projections. Evaluation of the impact of climate change on any given region
must therefore again adopt a scenario approach, that is, evaluate a range of plausible
future changes.
In summary, New Zealand’s climate in the 2080s is likely to have the following
features if greenhouse gas emissions continue to increase (MfE, 2001).2
• Winds: overall there will be more winds from a westerly and southwesterly direction
across the country (more El Niño-like), with more north to north-east winds for
Wellington and Canterbury. This wind pattern arises because the temperate and
tropical regions will warm up faster than the Southern Ocean regions.
• Rainfall: there is likely to be more average rainfall on the west coasts and central high
country of both islands, but less rain in the east (Canterbury, Hawke’s Bay and Poverty
Bay). The changes in rainfall patterns are expected to be stronger during winter than
during summer.
• Temperature: there will be higher mean temperatures everywhere, with a higher
increase in winter (northern: +2.0 to 2.2°C; central: +1.8 to 2.1°C; southern: +1.6 to
1.8°C) than in summer (northern: +1.6 to 1.8°C; central: +1.4 to 1.6°C; southern: +1.0
to 1.3°C). These are on the lower side of the most likely projected global average
temperature rise of 1.8 to 3.8°C by 2080. Surface seawater temperatures in inshore
waters and estuaries will also rise, but not quite to the same extent as air temperatures,
due to the moderating and lag effect of a slower rise in ocean temperatures.
• Storms and extreme events: estimates of likely changes in regional climate extremes are
even less certain than projections of average conditions. The frequency of extreme
storms is unlikely to change significantly, but genesis areas and tracks for tropical
cyclones in the South Pacific may vary more between El Niño and La Niña years and
with warmer local oceanic temperatures in the ‘breeding’ grounds of the tropics
(Basher and Zheng, 1995). The more El Niño-like mean state of the tropical Pacific
may lead to changes in the location-specific frequency of tropical cyclones in the
Pacific. What is reasonably clear is that storms are likely to be accompanied by heavier
rainfall intensity in a warming world, because a warmer atmosphere can hold a higher
moisture content. The intensity of wind in extra-tropical cyclones could increase with
global warming, but there is little agreement between current climate models on
whether the intensity of mid-latitude storms will increase. Changes in storm intensity,
if they do occur, will affect sediment loads delivered to the coast from both offshore
and from rivers, and coastal flooding.
• Sea-level rise: projected sea-level rise around New Zealand is expected to match the
global projections of 0.25 to 0.36 m by 2080, except in areas where significant vertical
landmass movements exaggerate or mitigate the absolute rise in sea level.
Planning for Climate Change Effects on Coastal Margins 27Figure 8: Schematic of projected changes in regional climates around New Zealand by the
2080s, that have the potential to modify coastal “drivers” and cause impacts on coastal
margins. Derived by NIWA from statistical downscaling of global climate model runs (MfE,
2001). [Graphics: K MacLeod]
As a rule, the overall trends in climate variables on regional scales are considered to
be more robust (for example, an overall increase in temperatures and sea level for
New Zealand, or a broad shift in rainfall patterns towards less rain in the east and
more in the west), than any absolute projections (such as a statement like “there is
likely to be 20% more rainfall in region X”).
Planning for Climate Change Effects on Coastal Margins 284.4 Role of monitoring
The global-to-regional translation process that downscales climate projections must
be backed up by sufficient long-term regional monitoring of key climate and ocean
parameters. Such targeted monitoring has three essential uses:
• to calibrate or verify regional climate-ocean models
• to provide more in-depth knowledge and understanding of how regional climates and
oceans behave or are likely to respond to patterns of global climate change
• to compare with ongoing IPCC global projections and work back to check the
translation process from global to regional climate change.
CASE STUDY 1: Sea-level and Climate Monitoring
An example of climate change monitoring is the network of 11 open-coast sea-level
gauges (Figure 9) co-ordinated by NIWA, with support from some regional and district
councils, the University of Canterbury, Land Information NZ, Department of
Conservation and the Australian National Tidal Facility (Adelaide). These gauges were
all deliberately positioned around the open coast, spanning the entire coast, but their
recent installation (apart from Moturiki) means the records are too short at this stage to
make any assessment on New Zealand-wide relative sea-level rise. In time, they will
complement the much longer gauge records from the four main ports (back to 1900),
even though sea-level inside ports is modified by harbour entrances, river floods, port
dredging and possible instability of the gauge site.
NIWA also co-ordinates the archiving and analysis of a long-term climate database.
The data originate from meteorological sites managed by the NZ Meteorological
Service around New Zealand, territorial and regional councils, universities, government
departments, Crown research institutes, private companies and individuals (see web
site: http://katipo.niwa.cri.nz/www_cli.htm). These databases will provide a sound basis
for interpreting and verifying future regional climate and sea-level projections.
Mokohinau Is
Anawhata Moturiki Is
Figure 9: Open-coast sea-
level network of 11 gauges
co-ordinated by NIWA. Most
Kapiti Is
sites commenced monitoring Little Kaiteriteri
from 1997–98, but Moturiki Riversdale
has been recording since Charleston
1973. Kaikoura
Jackson Bay Sumner Head
Dog Is
Planning for Climate Change Effects on Coastal Margins 294.5 Sea-level rise around New Zealand
Over the past century global sea level has been rising at an average rate of 1.8 mm per
year. That does not sound much, but it is nearly 0.2 m since 1900, which has been
significant for low-lying coastal margins and gently sloping beaches. Analysis of
relative sea-level trends at New Zealand’s major ports since 1900 has produced
similar rates of 1.7 ± 0.4 mm per year (Bell et al., 2000; 2001b). Given the similarity
of global and relative rates of rise, this means that the local landmass is relatively
stable at the four main ports.
New Zealand’s most accurate long record is from the Port of Auckland. Annual
means of sea level from the port since 1899 are plotted in Figure 10, along with the
historical trend (1.4 mm per year). These historical data are then blended with the
projected IPCC (2001a) sea-level rise envelopes out to 2100 to provide the context.
By the end of this century (2100), it is likely that sea-level rise around New Zealand
will have more than doubled (over 0.4 m) compared with the 0.2 m rise experienced
last century (Figure 10).
Figure 10: The relative sea-
Sea-level rise
level trend for Auckland
Last 100 years + next 100 years since 1899 and the annual
variability in mean sea level
(Hannah, 1990; Bell et al.,
0.8 2001) is spliced with the
predicted IPCC (2001)
Sea-level relative to 1990 (m)
projections in “global” sea-
0.6 IPCC (2001) level rise up to 2100. The
projections middle “most likely” zone
spans the range of average
0.4
" estimates produced by a
ely
t lik range of climate-ocean
Port of Auckland os
0.2 "m models. The least likely
[1899-2000] estimates (high and low) are
Annual means & trend
the lightest-coloured zones.
0.0 Note: Sea level has been
plotted relative to the 1990
values (which for Auckland is
-0.2 1.840 m above gauge
1900 1920 1940 1960 1980 2000 2020 2040 2060 2080 2100
Year datum).
What has caused this rise?
This rise has been caused by a variety of factors, but mainly thermal expansion from
higher global air temperatures caused by ‘natural’ long-term cycles in climate and
radiation from the sun, compounded increasingly by greenhouse-related global
warming. As water heats up, it expands in volume (recall those boil-overs of the car
radiator?). Seawater will expand vertically because it is constrained horizontally by
landmasses. Minor contributions have come from melting of glaciers and small ice
caps (but so far not the large polar ice sheets). No apparent acceleration in sea-level
rise has been detected so far around New Zealand. There is also no evidence globally
for an acceleration of sea-level rise during the last century, nor would any necessarily
be expected from the observed climate change to date (IPCC, 2001a), because it is
Planning for Climate Change Effects on Coastal Margins 30masked by the larger annual and decadal variability in sea level, such as El Niño and
La Niña effects (see Figure 10). Detection of an acceleration of the rising trend in sea
level from tide gauges and satellite measurements may take another few decades to
confirm.
Relative sea-level projections for New Zealand
Translating long-term global-average projections from IPCC (2001a) to what is likely
to occur along the New Zealand coast is complicated by landmass instability and any
regional effects on the absolute rise in sea level caused by changes in ocean currents
and wind patterns. Any local landmass uplift will lead to a smaller magnitude of
relative sea-level rise at that locality, compared to the absolute sea-level rise, while
subsidence will lead to a higher relative sea-level rise. As a result, three main factors
need to be considered in assessing the relative rise in sea level.
(1) Gradual deformation
Different parts of the New Zealand landmass are undergoing slow vertical
deformation, or ‘creep’. The causes are glacial isostatic adjustment, tectonic uplift
due to the subduction of the Pacific Plate underneath the Australian Plate (Barnes and
Lewis, 1996), and gradual subsidence from historical sediment loading of plains and
coastal basins. Parts of New Zealand, mainly the lower South Island, are probably
still rising slightly as an after-effect of the removal of glacial ice-caps since the last
ice age. The rate of glacial isostatic uplift is uncertain (difficult to measure), and
likely to be heavily masked by tectonic and earthquake activity. One estimate using a
global crustal-deformation model developed by Peltier (2001) is 4 to 5 cm per century
(or –0.4 to –0.5 mm/yr) for New Zealand (negative because uplift reduces the relative
rise in sea level). However, because isostatic adjustment is difficult to distinguish,
and likely to be small compared to the expected overall rise in sea levels, it could be
disregarded until future, more accurate data suggest otherwise.
Maps summarising average tectonic uplift and subsidence are available for the North
and South Islands after the work by Pillans and Wellman respectively, which is
summarised by a diagram in Hicks (1990; Figure 8.2). Other coastal margins in
Canterbury and the South Taranaki Bight have experienced minor subsidence from
eons of sediment loading on the plains and adjacent coastal basins. For example,
estimates of subsidence along the Mid to North Canterbury coastline are +0.1 to +0.2
mm/year according to a 1979 study by Wellman, reproduced in Hicks (1990), but this
is again small compared with the current global sea-level rise of 1.8 mm/year.
In most places the average rates of gradual uplift or subsidence are small, and it is
also not clear whether any past uplift or subsidence occurred suddenly (seismically) or
slowly. There are major information gaps and uncertainties in the landmass stability
information pertaining specifically to coastal margins, which are outlined in Appendix
A.
Planning for Climate Change Effects on Coastal Margins 31(2) Seismic deformation
Earthquakes can result in sudden large local changes in land elevation. Berryman and
Beanland (1988) have summarised tectonic activity around New Zealand. Local
coastal response to sudden vertical movements accompanying the 1931 Hawke’s Bay
and 1987 Edgecumbe earthquakes are described in Case Study 5. Some localities
suddenly subsided by +0.7 m (effectively a sudden sea-level rise), while other coastal
areas have experienced sudden uplift, reclaiming land from the sea (for example, –1.8
m at Westshore, Napier). Such tectonic changes can over a short time frame have a
much larger local impact on relative sea level than the gradual sea-level rise expected
from global warming.
(3) Regional variations in absolute sea level
Regional differences in oceanic currents and the ocean response to climate change
around New Zealand and the southwest Pacific will produce regional differences in
absolute sea level that depart from the global average rise predicted by IPCC (2001a).
In particular, regional sea-level variability associated with the two- to five-year El
Niño–Southern Oscillation and the 20- to 30-year Interdecadal Pacific Oscillation
(both evident in Figure 11) may cause differences from the global average rise in sea
level. Not enough is known about the magnitude of these differences to provide
regional New Zealand projections, but satellite data, meshed with ongoing monitoring
of open-coast sea level (Case Study 1), will progressively shed more light on any
systematic regional departures from the global average rise.
Port of Auckland (1899-2000)
1950
1900
IPO - + - + - latest
1850
Annual MSL (mm)
AMSL
1800
1750
1700 +2
SOI La Niña
1650 0
El Niño
1600 -2
1900 1920 1940 1960 1980 2000
Year
Figure 11: Annual mean sea-level (AMSL) for the Port of Auckland since 1899 and the annual mean
Southern Oscillation Index (SOI). The transitions between phases of the Interdecadal Pacific Oscillation
(IPO) are marked by vertical dotted lines. During El Niño events (SOI is negative), sea level is lower than
normal, and vice versa for La Niña events. During the negative phase of the longer 20–30 year IPO
episodes, sea level rises more steeply compared with episodes when the IPO is positive. [Data sources:
Hannah (1990); Bell et al. (2001a); Ports of Auckland Ltd.; RNZN Hydrographic Office.]
Planning for Climate Change Effects on Coastal Margins 32You can also read