Cabo Verde 2020 Update to the first Nationally Determined Contribution (NDC) - UNFCCC
←
→
Page content transcription
If your browser does not render page correctly, please read the page content below
Cabo Verde 2020 Update to the first Nationally Determined Contribution (NDC)
Cabo Verde: 2020 Update to the first Nationally Determined Contribution (NDC)

Praia, February 2021

This NDC report has been produced with the support of the “international climate finance” from the Government
of Luxembourg.

This NDC update has been possible thanks to the collaboration of the following international institutions:
Foreword
Climate change and the threat they pose to the balance and future of the Planet are one of the biggest problems
facing humanity today. Indeed, global warming, caused mainly by large greenhouse gas (GHG) emissions,
thawing and retreating glaciers, rising sea levels, coastal erosion and increasing frequency and intensity of
meteorological events and extreme weather are part of the scientific evidence and tend to get worse.
Cabo Verde, like other Small Island Developing States (SIDS), contributes insignificantly to global warming.
However, due to the fragility of their ecosystems, it is among the countries that suffer most from the
consequences of this phenomenon: increased climatic aridity and the frequency of droughts, worsening saline
intrusion and deterioration of groundwater, soil degradation and loss of biodiversity, increase frequency of storms
and hurricanes, among others. Due to the smallness and weaknesses of its economy, it is also characterized by
the weak capacity to replace the damage caused by catastrophes resulting from extreme weather and climatic
events.
We are, therefore, at the forefront of those who call for the strengthening of Climate Action in the world and the
strong solidarity between countries, deserving special attention from SIDS. On behalf of the Government of Cabo
Verde, I reaffirm our country's will and commitment to do everything to assume our responsibilities under the
Paris Agreement. With this first update of our Nationally Determined Contribution (NDC), we commit to
decarbonizing our economy, strengthening the country's resilience and adapting the sectors of human activity
to the harmful effects of climate change. This commitment stems from the policies and strategies adopted for
the sustainable development of our islands and constitutes our country's contribution to global efforts to reduce
emissions and limit the increase in global average temperatures to 1.5 ° C above pre-industrial levels.
In practical terms, there are 14 specific contributions until 2030 (5 for Mitigation and 9 for Adaptation), which
will translate into a reduction in our emissions by at least 20%, that is, from 200,000 to 280,000 tCO2eq,
annually. For the implementation of these contributions, more than one hundred measures were identified, whose
lasting impact of adaptation will also be felt in food security, water security, energy security and the resilience of
the economic and social sectors. More than half of the electricity will come from local renewable sources, mobility
will be low carbon, through the promotion of electric vehicles, especially in public transport, most of the seawater
desalination facilities will start to work with wind and solar energy. We will adopt the best knowledge and practices
in the management of natural resources and in Agriculture, sharing our experience with other countries.
This NDC update is an ambitious and realistic commitment, confirming our firm determination to achieve a fair
transition to sustainable, carbon-neutral development.
This is in line with Cabo Verde's sustainable development objectives and with national and sectoral programs,
plans and strategies, on the one hand, and with the objectives of the Paris Agreement and other international
agendas, including, among others, development objectives sustainable.
The document, structured in 6 chapters, addresses the reasons for updating the NDC in the context of Climate
Ambition 2030, and presents Cabo Verde's concrete contributions to Mitigation and Adaptation and the
perspective of climate governance for this purpose. It ends with a chapter on priorities and needs, namely in
terms of international support, financing, capacity building and technology transfer.
I conclude by thanking the valuable work of so many specialists, public entities and civil society organizations,
international partners and friendly countries, whose contributions allowed us to update our Nationally Determined
Contribution (NDC), in the context of the Paris Agreement, in perfect alignment with the sustainable development
policies and strategies of our small island and archipelagic state.

                                                                                          Praia, February 15, 2021.

Gilberto Correia Carvalho Silva
Minister of Agriculture and Environment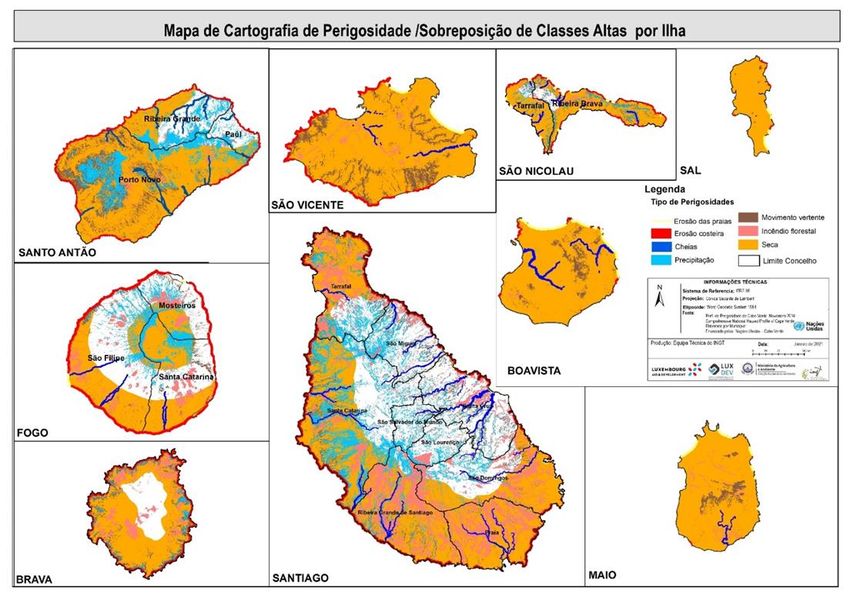
TABLE OF CONTENTS
SUMMARY OF NDC CONTRIBUTION (2030) AND LONG-TERM DECARBONISATION VISION (2050) .......... 5
NATIONAL CONTEXT............................................................................................................................................ 7
    CLIMATE VULNERABILITIES .......................................................................................................................................... 8
    BUILDING RESILIENCE ...............................................................................................................................................13
    GREENHOUSE GAS EMISSIONS PROJECTIONS ...................................................................................................................13
CLIMATE AMBITION 2020-2030 ..........................................................................................................................16
    KEY CONTRIBUTIONS OF CABO VERDE TO THE PARIS AGREEMENT ........................................................................................16
    INFORMATION NECESSARY FOR CLARITY, TRANSPARENCY AND UNDERSTANDING (ICTU) ............................................................18
MITIGATION CONTRIBUTIONS ........................................................................ ERRO! MARCADOR NÃO DEFINIDO.
    ENERGY ................................................................................................................................................................20
    TRANSPORT ...........................................................................................................................................................26
    RESPONSIBLE TOURISM AND CIRCULAR ECONOMY ............................................................................................................28
    AGRICULTURE, FORESTRY AND OTHER LAND-USE .............................................................................................................30
ADAPTATION CONTRIBUTIONS ...................................................................... ERRO! MARCADOR NÃO DEFINIDO.
    WATER.................................................................................................................................................................33
    AGRICULTURE ........................................................................................................................................................36
    OCEANS AND COASTAL ZONES ....................................................................................................................................38
    SPATIAL PLANNING ..................................................................................................................................................41
    DISASTER RISK REDUCTION.........................................................................................................................................43
    HEALTH ................................................................................................................................................................44
TRANSPARENCY AND GOVERNANCE ...............................................................................................................46
    CLIMATE DATA .......................................................................................................................................................46
    CLIMATE SERVICES ...................................................................................................................................................47
    CLIMATE GOVERNANCE .............................................................................................................................................47
       Strategic level ................................................................................................................................................47
       Operational level............................................................................................................................................48
       Descentralised level .......................................................................................................................................48
       Civic level .......................................................................................................................................................49
    CLIMATE EMPOWERMENT .........................................................................................................................................49
NEEDS AND INTERNATIONAL SUPPORT ...........................................................................................................52
    NDC FINANCE NEEDS ...............................................................................................................................................52
    NATIONAL CLIMATE FINANCE STRATEGY ........................................................................................................................52
    TECHNOLOGY DEVELOPMENT AND TRANSFER ..................................................................................................................53
    ENHANCED AMBITION INSTRUMENTS ............................................................................................................................54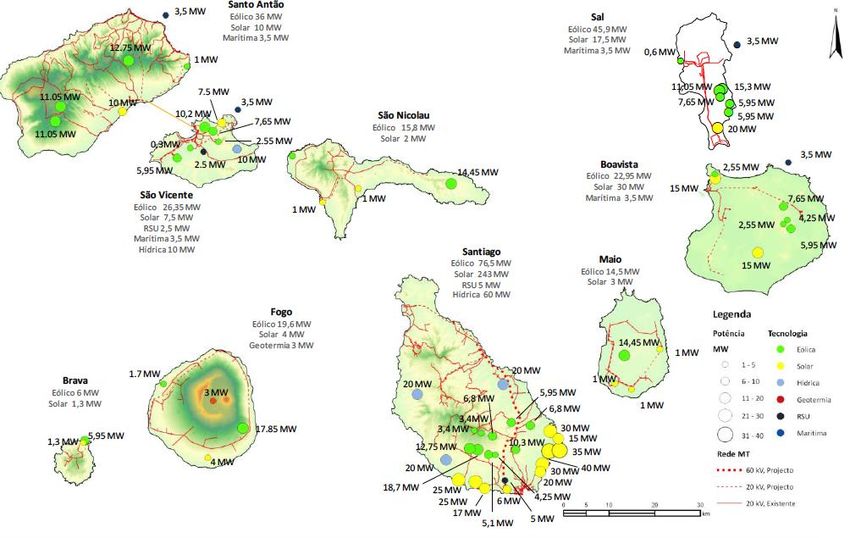
Cabo Verde: 2020 Update to the first Nationally Determined Contribution (NDC)

ACRONYMS
ACE        Action for Climate Empowerment
AFOLU      Agriculture, Forestry and Other Land Use
ANAS       Agência Nacional de Água e Saneamento
           National Water and Sanitation Agency
ANMCV      Associação Nacional dos Municípios de Cabo Verde
           National Association of Municipalities of Cabo Verde
BAU        Business-as-usual
BUR        Biennial Update Report
CIME       Comissão Interinstitucional para Mobilidade Elétrica em Cabo Verde
           Electricity Mobility Policy and Action Plan adopted in 2018
CNAS       Conselho Nacional de Água e Saneamento
           National Water and Sanitation Council
CND        Contribuição Nacionalmente Determinada
NDC        Nationally Determined Contribution
CQNUMC     Convenção-Quadro das Nações Unidas sobre Mudanças Climáticas
UNFCCC     United National Framework Convention on Climate Change
DGEM       Direção Geral da Economia Marítima
           General Directorate of Maritime Economy
DGSAP      Direção Geral da Agricultura Silvicultura e Pecuária
           General Directorate of Agriculture, Forestry and Livestock
DNA        Direção Nacional do Ambiente
           National Directorate of Environment
DNAPEC     Direção Nacional dos Assuntos Políticos, Económicos e Culturais
           National Directorate of Political, Economic and Cultural Affairs
DNICE      Direção Nacional de Indústria, Comércio e Energia
           National Directorate for Industry, Commerce, and Energy
DNP / MF   Direção Nacional do Planeamento/Ministerio das Finançass
           National Directorate of Planning/Ministry of Finance
DRR        Disaster Risk Reduction
RRD        Redução de risco de desastre
EE         Eficiência Energética
           Energy Efficiency
ENAP       Estratégia Nacional de Áreas Protegidas, 2016
           National strategy for protected areas
ENRRD      Estratégia Nacional para Redução de Risco de Desastres
           National Strategy for Disaster Risk Reduction
ENSAN      Estratégia Nacional de Segurança Alimentar e Nutricional (2015-2020)
           National Strategy for Food and Nutrition Security
EPANB      Estratégia e Plano de Ação Nacional sobre a Biodiversidade (2014-2030)
Cabo Verde: 2020 Update to the first Nationally Determined Contribution (NDC)

          National Biodiversity Strategy and Action Plan
EPR       Emergency Preparedness and Response
ESGAS     Estratégia Social e de Género para o Sector da Água e Saneamento
          Social and Gender Strategy for the Water and Sanitation Sector
ETF       Enhanced Transparency Framework
          Quadro de Transparência Reforçada
GCF       Fundo Verde para o Clima
          Green Climate Fund
GDP       Gross Domestic Product
Gg        Gigagram
GHG       Greenhouse Gas
GWh       Gigawatt-hours
ICF       International Climate Finance
ICIEG     Instituto Cabo-verdiano para a Igualdade e Equidade do Género
          National Institute for Gender Equality and Equity
INE       Instituto Nacional de Estatística
          National Institute of Statistics
INFRA     Infraestruturas de Cabo Verde
          Infrastructures of Cabo Verde
INGT      Instituto Nacional de Gestão do Território
          National Institute of Territory Management
INMG      Instituto Nacional de Meteorologia e Geofísica
          National Institute of Meteorology and Geophysics
IPCC      Painel Intergovernamental sobre Mudanças Climáticas
          Intergovernmental Panel on Climate Change
ITMOs     Internationally Transferred Mitigation Outcomes (art 6.2 PA)
LULUCF    Land Use, Land-Use Change and Forestry
LT-LEDS   Long-term low emissions development strategy 2050
MAA       Ministério da Agricultura e Ambiente
MAE       Ministry of Agriculture and Environment
NAMA      Nationally Appropriate Mitigation Actions
          Ações de Mitigação Nacionalmente Adequadas
NAPA      National Programme of Action for Adaptation to Climate Change 2008 – 2012
NAP       National Adaptation Plan
NbS       Nature-based-solutions
NDC       Nationally Determined Contributions
NFCS      National Framework for Climate Services
NGO       Non-Governmental Orgnaisation
          Organização não governamental
NIR       National Inventory Report
NMA       Non-market Approach (Art 6.8 PA)
PA        Paris Agreement
PAGIRE    Plano de ação Nacional Para a Gestão Integrada dos Recursos Hídricos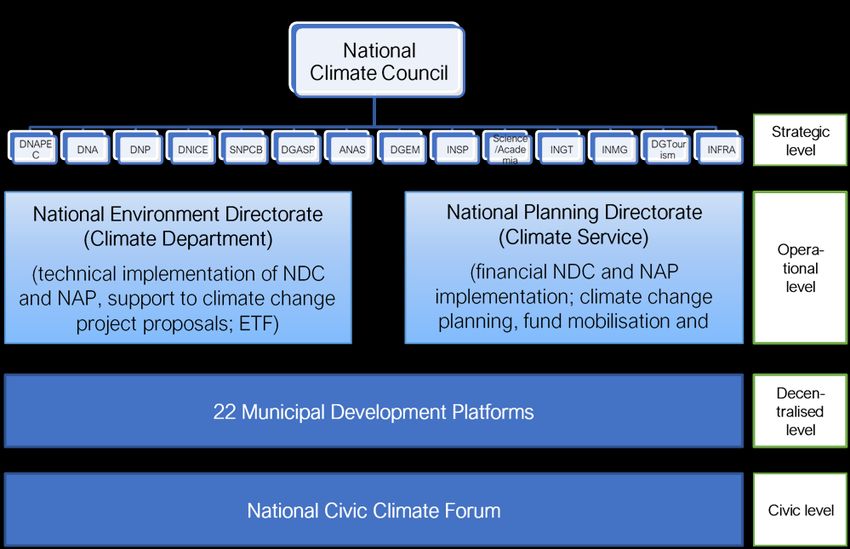
Cabo Verde: 2020 Update to the first Nationally Determined Contribution (NDC)

                      National Action Plan for Integrated Water Resources Management
PDAS                  Plano Director de Água e Saneamento
                      Water and Sanitation Master Plan
PDM                   Plano Diretor Municipal
                      Municipal Master Plan
PDSE                  Plano Diretor do Setor Elétrico
EMP                   Electricity Master Plan
PE-SNIA               Plano Estratégico do Sistema Nacional de Investigação Agrária (2017- 2024)
                      Strategic Plan of the National Agricultural Research System
PEDS                  Plano Estratégico de Desenvolvimento Sustentável (2017-2021)
                      Strategic Plan for Sustainable Development
PEMDS                 Plano Estratégico Municipal de Desenvolvimento Sustentável
                      Municipal Strategic Plans for Sustainable Development
PENGER                Plano Estratégico Nacional de Prevenção de Resíduos (2015-2030)
                      National Strategic Plan for Waste Prevention
PLANEER               Plano Estratégico de Extensão Rural (2017–2026)
                      Strategic Rural Extension Plan (2017–2026)
PLEAR_CAV             Plano Estratégico de Desenvolvimento das Estatísticas Agrícolas e Rurais
                      Strategic Plan for Agricultural and Rural Statistics (2015–2021)
PLENAS                Plano Estratégico Nacional de Água e Saneamento
                      National Strategic Plan for Water and Sanitation
PNEE                  Plano Nacional para a Eficiência Energética
                      National Action Plan for Energy Efficiency
PNIA-SAN              Plano Nacional de Investimento agrícola, segurança alimentar e nutricional, 2018
                      National Programme for Agricultural Investment, Food and Nutrition Security
PNIEA                 Plano Nacional de Investimento da Economia Azul
                      National Blue Economy Investment Plan
PNIG                  Plano Nacional de Igualdade de Género
                      Gender Action Plan
PNSE                  Programa Nacional para a Sustentabilidade Energética
                      National Programme for sustainable Energy
POOC                  Plano de Ordenamento da Orla Costeira e do Mar Adjacente
                      Coastal and Adjacent Seaside Management Plans
PROMEA                Programa de Promoção para Economia Azul
                      Blue Economy Promotion Program
QEUEA                 Quadro Estratégico Unificado para a Economia Azul
                      Unified Strategic Framework of the Blue Economy
RE                    Renewable Energy
                      Energias renováveis
SDG                   Sustainable Development Goals
ODS                   Objetivos de Desenvolvimento Sustentável
SIDS                  Small Island Developing States
PEIDS                 Pequenos Estados insulares em Desenvolvimento
SIE / SIA / SIAAS /   Sistema de informação sobre energia / ambiente/ água / silvicultura / riscos
SIF / SIR
Cabo Verde: 2020 Update to the first Nationally Determined Contribution (NDC)

           Information system on energy / environment / water / forestry / risks
SNICV      Sistema Nacional de Inventário de Gases de Efeito Estufa
           National Greenhouse Gas Inventory System
SNPCB      Serviço Nacional de Proteção Civil e Bombeiros
           National Civil Protection and Fire Service
SPAME      Serviço de Prospetiva, Acompanhamento Macroeconómica e Estatísticas
           Service for Prospective, Macroeconomic Monitoring and Statistics
Tep/toe    Tonelada equivalente de petróleo
           Tonne of oil equivalente
UNFCC      United Nations Framework Convention on Climate Change
           Convenção-Quadro das Nações Unidas sobre a Mudança do Clima
ZEEEM-SV   Zona Económica Especial de Economia Marítima em São Vicente
           Special Economic Zone of Maritime Economy in São Vicente
ZDER       Zone for the Development of Renewable Energies
Cabo Verde: 2020 Update to the first Nationally Determined Contribution (NDC)
SUMMARY OF NDC CONTRIBUTION (2030)
AND LONG-TERM DECARBONISATION
VISION (2050)
Deeply supportive of the goals and objectives of the Paris Agreement (PA), Cabo Verde puts forward an update
to its first Nationally Determined Contribution (NDC) from 2015. The update deepens and moves beyond the
initial set of actions and commitments with respect to scope, sector ambition, balancing of mitigation and
adaptation action, climate justice and gender equality, as well as transparency and governance.
With 14 contributions and more than hundred measures planned, Cabo Verde seeks to achieve a substantial
mitigation benefit – in the order of 180,000 tCO2eq. to 242,000 tCO2eq annually by 2030 – as well as a lasting
adaptation impact in terms of food, water and energy security for Cabo Verde and improved resilience across
communities.
Although Cabo Verde's population compares well with other countries in Africa in terms of access to energy,
water and education, the pandemic has shown that economic and health emergencies are exacerbated by the
triple crisis of resources scarcity, climate change and biodiversity loss, particularly for Cabo Verde's rural society.
The NDC firmly responds to the development objectives of Cabo Verde’s Ambição 2030 (Ambition Plan 2030).
Cabo Verde’s flagship contributions include:
• The 2030 commitment to reduce economy-wide greenhouse gas (GHG) emissions by 18% below
business-as-usual (BAU) and to increase this target to 24% on the condition of adequate international
support;
• The long-term commitment to achieve a decarbonised economy by 2050 and to boost electricity
generation from renewable energies, including by building a pumped storage and other energy storage
capacities;
• The 2030 commitment to shift progressively to low carbon public transport, including active modes and
international maritime transport;
• The 2030 commitment to reverse the trend of habitat degradation, substantially improve biodiversity,
water retention, strengthen soils and restore forests and coastal wetlands;
• The 2030 commitment to use renewable energy (RE) for water supply mobilisation and to secure a
sustainable and resilient water management system;
• The 2030 commitment to provide sewage systems to all households and provides safe wastewater
treatment, including the use of RE and the recovery of nutrients and energy from wastewater;
• The 2025 commitment to establish comprehensive and coherent planning tools – adaptation, spatial,
urban, disaster response – at the central as well as municipal levels;
• The 2030 commitment to design and develop its ocean-based economy in a low-carbon way – covering
transport, fishing, coastal infrastructure and coastal energy, tourism – enhancing nature-based solutions
(NbS), conserving and restoring natural habitats;
• The 2025 commitment a specific Roadmap ‘Responsible Tourism in the Circular Economy’ defining a
2030 target of reducing GHG emissions from the sector;
• The 2025 commitment to build a monitoring system for tracing climate change related risks to public
health and integrate climate change resilience targets into the national One Health policy framework;
5Cabo Verde: 2020 Update to the first Nationally Determined Contribution (NDC)
• The 2025 commitment to create a strong platform for the empowerment of the young, women and
society as-a-whole in climate change policymaking and the implementation of climate-change
responses fostering knowledge, skills and sustainable jobs.
To ensure robust implementation in line with the Enhanced Transparency Framework (ETF) established under
the Paris Agreement, Cabo Verde will enact dedicated legislation covering comprehensive monitoring, reporting
and evaluation of GHG data, mitigation action as well as adaptation action, and defining a cross-institutional
climate governance framework.
While mobilising substantial domestic funding, Cabo Verde will rely on international support – technological,
capacity-building and finance – to achieve its 2030 contributions. The Cabo Verde Government will adopt a
Climate Finance Strategy and Roadmap by 2022 to establish and prioritise how best to incentivise domestic
investments and how to direct funding from international public, private and philanthropic sources for use in
different project preparation and financing stages.
Cabo Verde supports the use of all of the enhanced ambition instruments under Art. 6 of the Paris Agreement,
focusing on energy and mobility under the provision on cooperative approaches (Art. 6.2 Paris Agreement) and
on targeting adaptation benefits for rural communities (food and water security and healthy soils) as well as
interventions on sustainable tourism and blue habitats (ecosystem services from coastal wetlands and marine
resources) under the non-market approaches provision (Art. 6.8 Paris Agreement).
Box 1: List of NDC measures and their estimated* international funding needs
for implementation 2020-2030
5 Mitigation Contributions 1 000 Mio Euro
#1: Reducing energy intensity and fostering energy efficiency
#2: Increasing renewable energy targets
# 3: Lowering the carbon intensity of mobility
# 4: Shifting towards responsible tourism and circular economy
# 5: Fostering the natural sink function of ecosystems
9 Adaptation Contributions 1 000 Mio Euro
#1: Improving water security and natural replenishment while reducing water carbon intensity
#2: Enhancing sewage, solid waste and wastewater treatment
#3: Increasing and sustaining land-based food security through regenerative agriculture
#4: Increasing and sustaining ocean-based food security through regenerative fishing
#5: Extending marine protected areas
#6: Defending marine resources and coastal zones
#7: Using spatial planning as an ally in climate change mitigation and adaptation
#8: Mitigating climate related disaster risks and vulnerabilities
#9: Confronting climate related health risks
Total estimated funding needs for NDC 2020-2030 2 000 Mio Euro
*to be confirmed and detailed in the upcoming NDC Implementation Road Map 2021
6Cabo Verde: 2020 Update to the first Nationally Determined Contribution (NDC)
NATIONAL CONTEXT
Located some 620 km off the west coast of Africa, Cabo Verde is an archipelago of ten islands of which nine are
inhabited. Despite the arid climate and mountainous terrain, Cabo Verde has been developing rapidly, in a large
part thanks to its flourishing tourism industry, graduating from a least developed to a middle-income country in
2007.
As a small island development state (SIDS), Cabo Verde, a very small emitter of GHG emissions at a per capita
rate of just under 1 tCO2eq, is disproportionately vulnerable to external economic shocks and extreme climatic
events that can instantly erase years, if not decades of development gains.
Cabo Verde is also facing significant capacity constraints, limited fiscal space and insufficient domestic finance
to respond adequately to challenges posed by climate change. This has been compounded by the economic
fallout of the COVID 19 global pandemic and exacerbating the already existing high debt to GDP ratio. Although
Cabo Verde has made remarkable progress in poverty reduction over the last decade, poverty remains
widespread (35% of the population as recently as 2015, INE 2019). The COVID 19 pandemic has caused the
biggest recession in Cabo Verde’s modern history affecting virtually all economic sectors, including notably
tourism, which is of strategic importance. Current macro-fiscal indicators are provided in Table 1 below.
Table 1: Main macro-fiscal indicators in Cabo Verde (% change each time compared to previous year)
Indicators Units 2019 2020P* 2021P
Base COVID Base COVID
Scenario Scenario
GDP Variation in % 5.7 5.5 - 6.8 5.5 4.5
Inflation 1.1 1.2 1.0 1.2 1.2
Number of tourists Variation in % 7.0 6.6 - 58.8 7.4 35
Unemployment rate In % of active population 11.3 11.4 19.2 10.7 17.2
Public Deficit In % GDP - 1.8 - 1.7 - 11.4 - 1.4 - 9.7
Public Debt In % GDP 124.2 118.5 145.8 113.3 148.1
Source: Fonte: SPAME/DNP (2020), * P = predictions
Pre-pandemic statistical data shows a country whose population doubled since Independence in 1975, to count
544,000 inhabitants in 2018, with an estimated increase to 620,000 inhabitants in 2030, a scenario that presents
opportunities and challenges. While requiring massive efforts at all levels of society, the coming years will be
dedicated to rebuilding the economy not just as it was, but more resilient, fairer and better.
Cabo Verde, an African model of democracy, stability and share of the population with access to education (93%
enrolment 2018), water (86%, 2018)1 and electricity (92.2%, 2019)2 and has made the Sustainable
Development Goals (SDGs) the backbone of its economic, social and cultural planning.
While national efforts are underway and will continue to be exerted toward emissions reduction and building
resilience, Cabo Verde’s national efforts alone will not be sufficient for achieving the goals of the NDC in mitigation
and adaptation and in securing the long-term sustainable development and decarbonisation of Cabo Verde.
1 Anuário Estatístico 2018, INE
2 Inquérito multi-objectivo contínuo (IMC 2019)
7Cabo Verde: 2020 Update to the first Nationally Determined Contribution (NDC)
Climate vulnerabilities
The pandemic has exposed the extreme fragility of economies and development gains in tourism-based import-
dependent SIDS, such as Cabo Verde.
An archipelago of ten volcanic islands with no permanent water courses, no natural forests, limited mineral
resources and scarce in areas suitable for agriculture (only 12% of its territory is arable land), Cabo Verde is
particularly exposed to increasingly extreme weather events, desertification of land and persistent droughts,
occasional but severe and highly damaging heavy rains (most recently in September 2020), and sea-level rise.
As a consequence, the archipelgo faces severe adaptation challenges associated with, among others, water
resource scarcity, food and energy security.
The access to affordable and sustainably-sourced energy and water, the protection of the islands’ delicate
unique biodiversity and soils, sustainable development and the deployment of socio-ecological resilience within
the planetary boundaries are a matter not just of policy choice but of survival.
In Cabo Verde, since 1990, temperature increase by 0.04%/year. Recent projections indicate a temperature
increase of about 1°C for the period 2011-2040 and of 3°C until the end of the century. Results also show a
reduction in annual average precipitation of about 2%, a temporal extension of the dry season, with an increased
likelihood of droughts, and a shortening of the rainy season, with a concentration of heavy, localised rains in a
short period of time, causing high water discharge and run-off and soil erosion.
Figure 1: Climate indicators for the period 2011-2040
Source: WMO, MAA, GCF, 20193
Already today, Cabo Verdeans have to adapt to ever-longer drought periods, storms, soil erosion, salt intrusion
and increased desertification. For the country’s high exposure to natural hazards, see Table 2 below.
3 Enhancing climate science of Green Climate Fund Activities in Cabo Verde, WMO, MAA, GCF, 2019 and Plano nacional para o Quadr o
de serviços de clima em Cabo Verde, MAA/WMO, Oct 2020.
8Cabo Verde: 2020 Update to the first Nationally Determined Contribution (NDC)
Table 2: Disaster Risk Profile of Cabo Verde
Source: World Bank -Global Facility for Disaster Risk Reduction and Recovery, 2019
The situation is made more difficult by the country’s relatively small size in terms of territorial boundaries,
demographics and the economy, as well as its geographic isolation. While Cabo Verde’s islands are in no way
self-sufficient – the vast majority of goods, including essential foods, are imported. People are exceedingly
vulnerable to shocks in supply chains caused by economic or digital disruptions, extreme weather events, or
most recently the COVID 19 pandemic.
As concerns specifically climate hazards (see figure 2 below), the most damaging to Cabo Verde are estimated
to be drougts, floods, land slides, forest fires, sea-level rise, coast and beach erosion and epidemics. To this add
the non-climate related hazards such as volcanic and seismic activities. From a territorial perspective, research
concludes that about 80% of the archipelago's territory has a high susceptibility to drought, especially the shallow
islands and São Vicente.
The defintition of vulnerable groups in the face of climate change as well as the connections between gender
and climate policy and planning are not yet sufficiently established or institutionalised in Cabo Verde. The highest
climate change vulnerability tend to lie with the cities, the shallow islands, the steep agricultural and forest areas,
the coast lines. Population and assets are concentrated in coastal cities. Considering Cabo Verde’s small and
dispersed geographic area, disasters can take country-wide proportions.
9Cabo Verde: 2020 Update to the first Nationally Determined Contribution (NDC)
Figure 2: Map of the susceptibility to selected climate hazards in a high risk scenario, per island, 2014/2021
Source: Methodological pilote study for the production of a climate hotspots map, INGT/DNA, 2021 and Comprehensive
Hazard Assessment and Mapping in Cabo Verde, UN Joint Office and Government of Cabo Verde, 2014. The documented
climate hazards are: beach and coast erosion (erasão das praias e erosão costeira, yellow and red resp.), floods (cheias,
dark blue), heavy rains (precipitação, light blue), land slides (movimento vertente, brown), forest fires (incendio florestal,
pink), droughts (seca, orange). In black, the names of the islands, and the names and administrative limits of the 22
municipalities.
Since Cabo Verde’s ratification of the UN Framework Convention on Climate Change (UNFCCC) in 1995, these
climate vulnerabilities have been studied and are being monitored. Although limited in ressources, the
Government has since spared no efforts to reduce the Nation’s overall vulnerabilities and exposure to disaster
and to cope with climate change, as can be seen by the following selection of milestone documents produced
under the auspices of the Ministry of Agriculture and Environment:
• First (1994 – 2004) and Second (2004-2014) National Action Plan for the Environment;
• First National Inventory Report on GHG (1995), 20 years after national Independence;
• First (2000), Second (2010) and Third (2017) National Communication (NC) to the UNFCCC;
• First National Programme of Action for Adaptation to Climate Change (NAPA) 2008 – 20124.
The Government has also undertaken efforts to reduce its carbon dependence and shift its energy generation
from fossil to renewable sources, as will be exposed in the following pages. This stems from the fact that the
country is endowed with a high potencial for exploiting renewable energies (see Figure 3 below). Disposing of a
comprehensive network of terrestrial and maritime protected areas and biosphere reserves, the country also
aims to mobilise its potencial for sequestring carbon naturally, in its ocean, forests, wetlands and soils.
4
based on the Sectoral Climate Vulnerabilities and Adaptation Studies undertaken in 2007.
10Cabo Verde: 2020 Update to the first Nationally Determined Contribution (NDC)
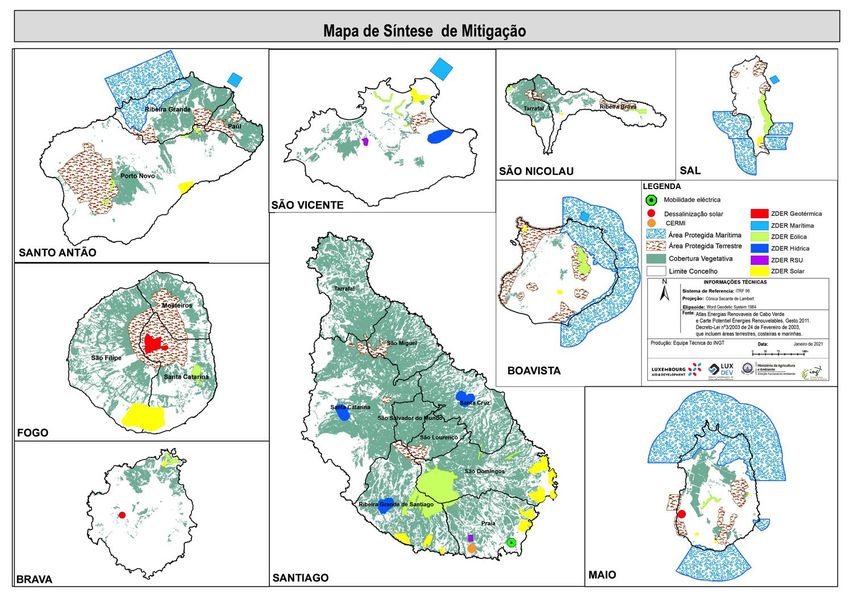
Figure 3: Map of areas potentially reducing GHG emissions through deployment of renewable energies and through natural
carbon sequestration in vegetative cover and protected areas, per islands, 2021.
Source: Methodological pilote study for the design of a climate hotspots map, INGT/DNA, 2021. ZDER = special zone for the
development of renewable energies (RE). The documented areas with GHG reduction potential are: Praia, São Vicente, Sal
and Boavista municipalities with the deployment of electric vehicles, the CERMI - Centre for Renewable Energies and
Industrial Maintenance, and the ZDER for solid urban waste (RSU); Brava and Maio with 2 solar desalination plants under
development; the terrestrial and maritime protected areas, the vegetative cover on all islands but Sal. All islands have ZDER
for either geothermal (red), ocean (light blue), wind (light green), hydro (Dark blue), solide waste (violet) or solar (yellow)
energies. In black, the names of the islands, and the names and administrative limits of the 22 municipalities. For more details
on the RE potential in MW per island see fig. 7.
11Cabo Verde: 2020 Update to the first Nationally Determined Contribution (NDC)
Box 2: Main climate related vulnerabilities of communities in Cabo Verde
Agriculture: Agricultural output, always precarious given soils and precipitation conditions, is exceedingly sensitive to a
warming climate and increasingly unpredictable rain patterns frequently in torrential way. The sector employs some 15% of
the population and is responsible for local food supply. While soils are naturally fertile due to their volcanic origin, fertility has
been decreasing over time due to water and wind erosion, salt intrusion, weak vegetative cover and continuous use without
proper replenishment of nutrients extracted by crops. Invasive species and plagues increase agriculture vulnerability. The
sector that resisted best to the pandemic was the agriculture. Local food production continued;
Food imports: For more than 80% of their needs, Cabo Verdeans are dependent on imports of essential food; any disruptions
for shipping, commodity supply, fluctuating international food commodity prices; and currency risks will have disproportionate
consequences for Cabo Verde’s food security and distribution and the capacity to meet basic needs;
Energy: Fossil fuel imports and logistics: While Cabo Verde is dependent on imports for virtually all its fossil fuel needs, the
energy mix still heavily relies on them from transport to desalination to generator use whether in agriculture or in the health
(hospital) system; disruptions to supply and prices – a likely prospect in a world more and more impacted by climate change
and vanishing resources – are felt immediately and across communities. Linking Cabo Verde’s islands with each other and
with other countries – a challenge at the best of times – is extremely vulnerable to disruptions from climate change,
pandemics, fossil fuel scarcity. Renewable generation is key, but these installations too have to be made climate-resilient
(larger ports for reception of ever larger wind generators, batteries waste, extreme winds or no wind, bruma seca, corrosion
of photovolataic panels);
Water: Cabo Verde increasingly suffers from water shortage. The country must operate ever more desalination plants to
meet its increasing water needs; yet those plants run heavy on energy use (10% of all the electricity consumed in the country);
Urbanisation and Infrastructure: Urban sprawl – often unplanned – has diminished habitats and essential ecosystem services.
Recurrent droughts and worsening conditions in agriculture and fisheries have driven rural population into cities and the
tourism employment or into exodus. It has also created massive challenges for the country’s essential infrastructure
(transportation, energy,water and sewage facilities, communications infrastructures in particular), which are further exposed
by climate hazards. Buidling in a more resilient, with lower land- and energy footprints, while keeping up with the housing
supply and prices, is the challenge;
Sea-level rise: The geomorphological characteristics of Cabo Verde’s islands define a set of landscapes, where lowlands in
the coast stand out; this makes coastal communities, economic operations and infrastructure particularly vulnerable to a
possible rise in sea level associated with extreme and adverse climate events, as are cases of storms with high winds, heavy
rains and tidal waves; the country is already witnessing loss of coastal territory due to these phenomena;
Public health: COVID 19 has put Cabo Verde’s public health system and finances under enormous stress. While the
relationship between climate change, biodiversity and infectious disease is complex, it is clear that the loss and degradation
of natural habitats undermines the web of life and increases the risk of disease spillover from wildlife to people. The country’s
record on combatting a range of infectious diseases such as cholera, Zika, dengue as well as yellow fever, and malaria is
exceptional. Nevertheless, Cabo Verde is less prepared than other countries to withstand future epidemic and pandemic
outbreaks, not least for its high exposure to international visitors, on whom the current economy depends;
Vulnerable groups can generally be defined as groups of individuals exposed to poverty, or low-income individuals. Climate
vulnerable groups considers groups and communities that have adversely been affected by climate hazards, and having
limited ability and income to recover by themselves. This would include women, the elderly and the youth or persons with
disabilities. Women are responsible for the day-to-day running of households and basic services, mainly in rural areas. They
suffer from the lack of (or limited) access to water, land and energy in rural areas and increasing fragility in supply chains.
Women and youth are underrepresented in decision making bodies, overrepresented in unemployment and emigration and
have lesser patrimonial or financial resources;
Digital threats: As an island state, Cabo Verde is hyper-dependent on swift, steady and 24/7 available digital and satellite
services feeding needs from education to transport to early-warning systems. Extreme weather events can have seriously
debilitating impacts on societal and security-related functions;
Financial resilience: Cabo Verde is both considerably indebted and highly dependent on non-domestic financing and foreign
direct investment. Increasing vulnerability to and costs of climate change escalate financial exposure and affects the financial
resilience of the country.
12Cabo Verde: 2020 Update to the first Nationally Determined Contribution (NDC)
Building resilience
Cabo Verde follows the IPCC definition, describing resilience as “the ability of a social or ecological system to
absorb disturbances while retaining the same basic structure and ways of functioning, the capacity for self-
organisation and the capacity to adapt to stress and change.”
Cabo Verde’s Disaster Risk Reduction Strategy (2018) defines “resilient communities as the populations and
human settlements informed about the risks, aware and able to anticipate, prevent, prepare, face and recover
from disasters; competent communities, capable of leading and taking risk reduction initiatives at local and
community level; societies capable of organising cooperation within neighbourhoods and communities, of
reinforcing self-help and of encouraging solidarity and mutual support, of cultivating disaster preparedness.”
Addressing these vulnerabilities is a key national interest of Cabo Verde and lead element of Cabo Verde’s
climate ambition. Building resilience is a task that touches on economic, social and environmental aspects all at
once. Cabo Verde needs a resilient infrastructure that reaches all of its people with energy, clean water, basic
health, emergency and education services. Cabo Verde needs affordable public services; that includes energy
and water bills. While social rebates for poor households are available, costs for water and energy for Cabo
Verde´s families are still high. Cabo Verde needs land and agriculture management that is responsive to and
copes with diminishing precipitation, occasional and severe flooding, and increased soil and biodiversity erosion.
Cabo Verde needs state-of-the-art emergency plans to manage shocks and crisis ranging from weather events
to new pandemics, cyber-attacks, infrastructure collapse, and supply chain interruptions. Finally, Cabo Verde
needs inclusive and gender-sensitive strategies to enhance the adaptative capacity of all of its communities and
economic sectors, including food production and tourism.
Building resilience is not a one-off challenge but requires continuous efforts on planning, screening risks and
performance, developing response measures, and working together across communities and institutions.
Greenhouse gas emissions projections5
Cabo Verde has one of the lowest GHG emissions per capita in the world (0.99 tCO2eq/inhabitant in 2010), the
burning of fossil fuels in electricity generation and combustion accounting for about 90% of total emissions. The
comparably low carbon footprint aside, Cabo Verde has consistently worked towards transforming its economy
from fossil to renewable energy (RE) sources. Under its first NDC, Cabo Verde spelled out a number of sector-
wide and sub-sector-wide targets (RE penetration rates into the electric grid; reduction of cross-sectoral energy-
demand; access to energy) while also committing to action-based targets (focusing on improvements of the
country’s nine electricity grids, hardware installation, planning tools, and other ‘soft’ measures such as
educational programs). While a number of contributions have yet to come to fruition – the first NDC had a time
horizon until 2030 – several key milestones have been reached, especially concerning the creation of renewable-
friendly regulatory and investment framework.
Regarding the evolution of GHG emissions and removals in Cabo Verde between 1995 and 2010 by sectors
listed, the energy sector has contributed most to total emissions, reaching approximately 550 Gg of CO2eq in
2005, the highest value of the series listed. In 2010, emissions had decreased by 1.2% compared to 2005. The
Agriculture, Forestry and Other Land Use (AFOLU) sector, more specifically forestry, in 2005 and 2010
contributed to the net removal of CO2, at the tune of -238 Gg CO2 in 2005 and in -237 Gg CO2 in 2010,
corresponding to a decrease of 0.25% in 2010 relative to 2005.
In 2005, the transport subsector accounted for 55% of total CO 2 emissions in the energy sector, followed by the
energy industries subsector with 33%. In 2010, the subsector energy industries accounted for 55% of total CO2
emissions in the energy sector and transport accounted for 41% of total CO2 emissions in this sector. The
5 Appropriate physical numbers in this section have been rounded to the unit, for ease of reading. The data considered does not take
the effects of the COVID pandemic into account.
13Cabo Verde: 2020 Update to the first Nationally Determined Contribution (NDC)
transport sub-sector decreased by 27% of total CO2 emissions compared to 2005, due mainly to the reduction
in the number of domestic flights in Cabo Verde.
This said, emissions are expected to rise, in line with growing demand for energy and assuming business-as-
usual (BAU) conditions (from energy mix as of 2019). The general energy demand in 2030 is calculated to reach
approximately 363,836 toe, from an annual of 222,928 toe in 2019 (the impact from COVID 19 not yet taken
into account).
Graphic 1: Total Energy demand: 2015, 2020, 2025, 2030 – Projected BAU Scenario (toe)
400 000
350 000
300 000
250 000
toe
200 000
150 000
100 000
50 000
0
2015 2020 2025 2030
LPG Kerosene Gasoline Gasoil JET A1 Fire-wood Gasoil + Fuel Electricity Wind + Solar Eletricity
Source: DNICE (2020)
Emissions in energy demand (outside electricity) are expected to reach 500 kt CO2eq in 2030. Among the various
subsectors, the transport sector presents the highest GHG emissions over the years, averaging approximately
373 kt CO2eq/ year between 2020 and 2030. By 2030 the transport sector is estimated to produce 440 kt CO2eq.
Emissions also increase in the energy transformation category (electricity generation) from 280,320 tCO2eq. in
2015 to 507,000 tCO2eq in 2030 (not yet adjusted for the COVID 19 pandemic).
In domestic energy, according to INE, in 2019, the most consumed fuel in urban areas is gas, around 81.2% of
households, mainly in urban areas (93.2%), followed by firewood with 16.1%, particularly in rural areas (43.4%).
The municipalities of Santiago, with the exception of Praia, register the highest consumption of firewood as a
source of energy for cooking. By islands, the largest demand for firewood is concentrated on the island of
Santiago, representing about 50% of the national demand. About 20% of households use wood as the main
energy source for cooking. The vast majority (85%) of the wood used is collected mainly by women and only
13% is purchased.
The projected emissions (BAU and NDC) across sectors are shown in Table 3 and 4 (none yet adjusted for the
COVID 19 pandemic).
14Cabo Verde: 2020 Update to the first Nationally Determined Contribution (NDC)
Table 3: CO2eq emissions and removals, historic data up to 2010 and projections from 2010 onwards, in Gg, by sector by
2030, considering BAU scenario.
Sectors 1995 2000 2005 2010 2015 2020 2025 2030
Energy 234 300 549 542 516 719 868 1007
IPPU 0.35 0.51 1.35 3.37 3.44 4.00 4.96 6.51
AFOLU (incl. removals) -96 -123 -130 -118 -118 -108 -105 -96
Waste 29 26 32 58 60 69 79 89
Total GHG Emissions/Removals
(Gg CO2eq) 166 203 453 485 461 684 847 1006
GHG Emissions (tCO2eq)/capita 0.43 0.47 0.97 0.99 0.88 1.23 1.44 1.62
Source: Third National Communication, MAA-INMG (2017) up to 2010 and DNICE projections (Energy 2020-2030).
Table 4: CO2eq emissions and removals, historic data up to 2010 and projections from 2010 onwards, in Gg, by sector by
2030, considering NDC scenario.
Sectors 1995 2000 2005 2010 2015 2020 2025 2030
Energy 234 300 549 542 516 671 757 765
IPPU 0.35 0.51 1.35 3.37 3.44 4.00 4.96 6.51
AFOLU (incl. removals) -96 -123 -130 -118 -118 -108 -105 -96
Waste 28 26 32 58 60 69 79 89
Total GHG Emissions/Removals
(Gg CO2eq) 167 203 453 485 461 636 736 764
GHG Emissions (tCO2eq)/capita 0.43 0.47 0.97 0.99 0.88 1.14 1.25 1.23
Source: Third National Communication, MAA-INMG (2017) up to 2010 and DNICE projections (Energy 2020-2030).
Graphic 2: CO2eq total and per capita emissions considering BAU and NDC scenario.
1200 1,80
1,60
1000
1,40
Emissions per capita (tCO2eq)
Total Emissions (Gg CO2eq)
800 1,20
1,00
600
0,80
400 0,60
0,40
200
0,20
0 0,00
2015 2020 2025 2030
GHG Total Emissions (Gg CO2eq) - BAU GHG Total Emissions (Gg CO2eq) - NDC
GHG Emission (tCO2eq)/capita - BAU GHG Emissions (tCO2eq)/capita - NDC
Source: DNICE (2020)
The emissions data used are those from Cabo Verde’s Third National Communication (NC) of 2017, meaning
the latest available official data on emissions dates back to 2010 and projection from DNICE for 2020, 2025 and
2030. They will be updated in Cabo Verde’s first biennial update report (BUR), to be released in 2022.
15Cabo Verde: 2020 Update to the first Nationally Determined Contribution (NDC)
CLIMATE AMBITION 2020-2030
Cabo Verde’s update of its first NDC has been developed in consultation with stakeholders and is aligned with
Cabo Verde’s development objectives, on the one hand, and the objectives of the Paris Agreement, on the other
hand. As a party to the Paris Agreement, Cabo Verde is committed to setting ambitious targets needed to enact
change and remains wholly supportive of the Paris Agreement and to all of the responsibilities and actions
outlined therein.
In submitting this NDC, Cabo Verde, as a small emitter of GHG, supports the call on all Parties to make their
submissions, to ensure that their NDCs are in keeping with their contributions to global emissions and to their
respective responsibilities under the Convention and to take actions that will result in the restriction of global
temperature increase to 1.5°C above pre-industrial levels.
The newly submitted contributions are fair and ambitious, considering the national circumstances, such as the
SDGs and poverty eradication, demographics, geography and insularity, climate, dependence on external
stimulators. They will go substantially beyond the commitments put forward in Cabo Verde’s initial NDC
submission, i.e., in terms of scope, sector ambition, coherence between adaptation and mitigation, horizontal
themes, including gender equality, and notably transparency.
The COVID 19 pandemic represents a moment of profound turmoil and disruption, causing a precarious
economic downturn due to the drop in tourism and trade, and aggravating the country’s economic vulnerabilities
to climate change. Despite the challenge, however, if anything, this crisis will strengthen the determination of
Cabo Verde and its people to take aggressive action to combat and adapt climate change.
Key contributions of Cabo Verde to the Paris Agreement
Cabo Verde’s new key contributions include:
Box 3: Increasing Cabo Verde’s 2030 climate ambitions
• By 2030, Cabo Verde commits to reduce economy-wide GHG emissions by 18% below the BAU
scenario. Conditional on adequate international support, this reduction target may go up to 24%
below the BAU scenario.
• The 2030 commitments are set with the long-term goal of achieving a decarbonised net-zero
emissions economy by 2050. The island of Brava will be the first pilote for maximum decarbonisation
by 2040.
• Key implementation targets focus on increased electricity generation from renewable sources,
improved energy efficiency across sectors, the shift from fossil fuel-engineered transport to electrified
transport and individual active mobility, enhanced resource rehabilitation and land mitigation
measures.
• By 2030, Cabo Verde seeks to install core resilience functions and metrics, namely concerning low-
carbon, affordable, gender-and disaster sensitive access to water, energy and essential public
services and resilient infrastructures and equipments.
• For this purpose, Cabo Verde will elaborate a new National Adaptation Plan as part of its global
climate change contribution, for submission to the UNFCCC by 2023, at the latest.
• To plan, manage and track progress, Cabo Verde will build a national climate governance system
centered on inclusive consultations, institutional coherence and scientific excellence.
16Cabo Verde: 2020 Update to the first Nationally Determined Contribution (NDC)
Box 4: Mitigation impacts
Cabo Verde’s mitigation measures are expected to
yield annual GHG emission reductions in the order of
180,000 tCO2eq to 242,000 tCO2eq (18% to 24% below BAU, incl. LULUCF) by 2030
The 2030 Climate Ambition contributions respond to the development objectives as included in Cabo Verde’s
Ambição 2030 (National Development Plan Ambition 2030), which in turn is designed to implement, in three
stages over the next 10 years, the SDGs and, subsequently to align with the NDC. The main pillars of the
development Ambition 2030 are improved well-being and resilience, reduced social and terrritorial inequalities
and environmental injustice, energy transition, circular, blue, digital economies, sustainable tourism, productive
agriculture.
Within the framework of Cabo Verde’s Ambition 2030, the country is committed to promoting an inclusive,
diversified, circular, resilient and low-carbon economy.
Figure 4: Main concepts for Cabo Verde approach on economic development
Blue Circular
Resilient
/Low Digital
carbon
For the elaboration of the present NDC, the current 5 years Strategic Plan for the Sustainable Development of
Cabo Verde (PEDS I 2017 – 2021) was used as a reference. For the achievement of the Ambiçao 2030, two
new 5 years PEDS will be designed, and aligned with the NDC.
It is important to realise that Cabo Verde’s mitigation and adaptation commitments do not stand in isolation from
each other and that they transcend the boundaries of climate change policymaking proper. The climate crisis is
as much a resources and livelihoods crisis – diminishing or threatening access to clean water and food – as it is
a social crisis.
Similarly, Cabo Verde’s mitigation commitments directly yield a range of significant adaptation and resilience
benefits, and vice versa. Energy sourced from renewables means enhanced energy security for Cabo Verde
across islands as well as self-relied access to clean water. These in turn provide climate resilience for families
and communities, urban and rural, incentivises the production of local farming productions; it also considerably
improves the livelihoods of those households living in poverty.
Conversely, many adaptation measures directly yield mitigation co-benefits. Cabo Verde’s forests, soils and
coastal wetlands are important carbon stocks, and all measures directed at protecting and enhancing these
ecosystems – meant to reduce erosion, improve or protect against flooding and salinisation – also maintain and
improve the country’s carbon sink capabilities. Efforts are ongoing to improve the understanding of – and
quantify, where possible –the specific mitigation co-benefits of Cabo Verde’s adaptation actions planned.
17Cabo Verde: 2020 Update to the first Nationally Determined Contribution (NDC)
Information necessary for clarity, transparency and
understanding (ICTU)
Time frame Cabo Verde’s updated NDC covers the timeframe 1 January 2021 through 31
December 2030.
Scope Climate change mitigation and adaptation.
Climate mitigation target: Economy-wide, net domestic reduction target.
Sectors and gases Sectors
covered • Energy
• Industrial processes
• Agriculture
• Waste
• Land Use, Land-Use Change and Forestry (LULUCF)
Gases
• Greenhouse gases included: CO2, CH4, N2O and HFCs
Target and reference • At least 18% below BAU by 2030 and 24% below BAU in a conditional
indicator scenario (single-year target).
• BAU scenario starts in 2013.
Methodologies and • Methodologies: All mitigation commitments will be accounted for on the
Metrics basis of the 2006 guidance of the Inter-Governmental Panel on Climate
Change 2016 (IPCC 2016), including the guidance on wetlands (IPCC
2013), applying relevant default data (tier 1) or better (tier 2 and tier 3),
once robust data is available.
• Metrics: Global Warming Potential on a 100 timescale in accordance with
IPCC’s 5th Assessment Report.
Consultations The preparation was led by the National Directorate for the Environment in
consultation with stakeholders.
Consultations were carried out between July 2020-January 2021 (mainly on-line
due to COVID).
Implementation The Government of Cabo Verde will adopt an NDC Implementation Roadmap to
set out institutional responsibilities, relevant governance frameworks, milestones,
and precise delivery targets for the specific contributions and actions outlined in
this NDC. The process will be part of Cabo Verde’s National Enhanced
Transparency Framework (ETF) foreseen in the Paris Agreement.
Fair and ambition The updated first NDC is considered fair and ambitious in the framework of the
global response. Despite its low emissions profile and its position as a highly
vulnerable SIDS, Cabo Verde commits to a substantial, economy-wide reduction
target. While ambitious in purpose, the NDC contributions are socially inclusive,
cross-cutting in nature, and tailored to benefit Cabo Verde’s most vulnerable
people in particular. The country ambition contributes towards achieving the
objectives of the Paris Agreement, including curbing the rise in global emissions
to 1.5 % above pre-industrial levels.
Other The information provided may be subject to revision following the release of Cabo
Verde’s first biennial update report (BUR), planned for 2022.
18You can also read


