RELATIONSHIP BETWEEN NATURAL DISASTERS AND POVERTY: A FIJI CASE STUDY
←
→
Page content transcription
If your browser does not render page correctly, please read the page content below
International Strategy for Disaster Reduction

RELATIONSHIP BETWEEN NATURAL
DISASTERS AND POVERTY:
A FIJI CASE STUDY
SOPAC Miscellaneous Report 678                                                           April 2009

                             A report prepared for the
           United Nations International Strategy for Disaster Reduction
       Secretariat’s 2009 Global Assessment Report on Disaster Reduction

*Prepared by Padma Narsey Lal, Reshika Singh and Paula Holland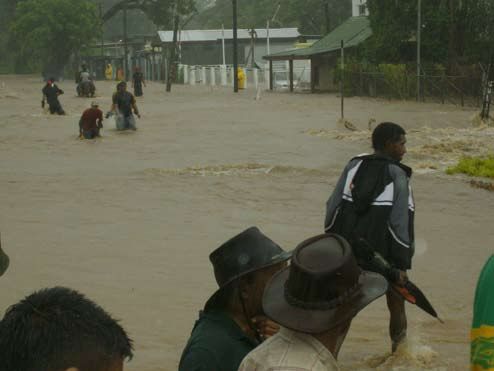
Financial support from the Global Facility for Disaster Reduction and Recovery (GFDRR) is gratefully
                                 acknowledged. GFDRR is a partnership between Australia, Canada, Denmark, European Commission, Italy,
                                 Japan, Luxembourg, Norway, Spain, Sweden, Switzerland, United Kingdom and the World Bank.
SOPAC Miscellaneous Report 678

                                 *Padma Lal is the Chief Technical Adviser at the IUCN, Fiji. Reshika Singh is a Natural Resource Economist with
                                 SOPAC. Paula Holland is the Manager; Natural Resource Governance with SOPAC.

                                 Picture on the front cover is courtesy of Nigel Dowdeswell.

       2
International Strategy for Disaster Reduction
RELATIONSHIP BETWEEN NATURAL
DISASTERS AND POVERTY:
A FIJI CASE STUDY
April 2009
SOPAC Miscellaneous Report 678
Prepared by Padma Narsey Lal, Reshika Singh and Paula Holland
SOPAC Miscellaneous Report 678
A report prepared for the
United Nations International Strategy for Disaster Reduction
Secretariat’s 2009 Global Assessment Report on Disaster Reduction
3Contents
ACKNOWLEDGEMENTS................................................................................................................ 7
ACRONYMS................................................................................................................................. 8
EXECUTIVE SUMMARY................................................................................................................. 9
PREFACE.................................................................................................................................... 15
1. INTRODUCTION: HAZARDS, DISASTERS AND POVERTY........................................................... 16
1.1 Basic concepts............................................................................................................................................. 16
1.2 The link between disaster risk and poverty...................................................................................................... 20
1.3 This study.................................................................................................................................................... 21
2. LINK BETWEEN DISASTERS AND POVERTY - METHOD............................................................ 22
2.1 Method used in the Fiji case study................................................................................................................. 23
3. DISASTER AND POVERTY LINKS IN FIJI................................................................................... 25
3.1 Partial analysis............................................................................................................................................. 25
3.2 Empirical analysis......................................................................................................................................... 41
3.3 Coverage and quality of disaster and poverty data...........................................................................................48
4. POLICY IMPLICATIONS FOR FIJI............................................................................................. 49
4.1 Poverty reduction and disaster risk reduction................................................................................................. 49
4.2 Disaster management.................................................................................................................................... 52
4.3 Disaster risk management............................................................................................................................. 54
4.4 Data............................................................................................................................................................. 55
5. IMPLICATIONS FOR OTHER PACIFIC ISLAND COUNTRIES........................................................ 56
5.1 Geographic characteristics........................................................................................................................... 56
5.2 Status of Pacific island countries’ economies................................................................................................. 59
5.3 Recent trends in increasing vulnerability........................................................................................................ 62
5.4 Disaster risk reduction and disaster management challenges.......................................................................... 64
6. CONCLUDING REMARKS.......................................................................................................... 66
REFERENCES............................................................................................................................... 67
ANNEX 1: GLOSSARY.................................................................................................................. 71
ANNEX 2: POVERTY ALLEVIATION AND DISASTER RISK MANAGEMENT PROJECTS IN FIJI........... 73
SOPAC Miscellaneous Report 678
4Tables
TABLE 1: TYPES OF HAZARD..................................................................................................................... 16
TABLE 2: TYPES OF ANALYSIS USED......................................................................................................... 22
TABLE 3: TYPES AND SOURCES OF DATA USED IN THE ANALYSIS OF THE RELATIONSHIP
BETWEEN DISASTER AND POVERTY IN FIJI, AND DATA CONSTRAINTS....................................... 23
TABLE 4: DIRECT IMPACTS OF MAJOR DISASTERS, FIJI, 1970–2007........................................................ 28
TABLE 5: NATIONAL DISASTER MANAGEMENT OFFICE’S ASSESSMENT OF SECTORAL IMPACTS
OF CYCLONE AMI AND RELATED FLOODING (F$)........................................................................ 32
TABLE 6: ESTIMATED ECONOMIC LOSSES FROM THE 2004 NAVUA FLOODS, FIJI (F$).............................. 32
TABLE 7: FIJI’S ECONOMY........................................................................................................................ 34
TABLE 8: INTERNATIONAL ASSISTANCE TO FIJI FOR CYCLONE AMI........................................................... 35
TABLE 9: GINI COEFFICIENTS FOR FIJI (PER PERSON INCOME), 1977 TO 2002-03.................................... 37
TABLE 10: SECTORS OF EMPLOYMENT OF THE HEADS OF POOR HOUSEHOLDS, FIJI, 1990-91................... 39
TABLE 11: BASIC HUMAN DEVELOPMENT INDICATORS FOR FIJI................................................................. 39
TABLE 12: KEY FIJI’S MILLENNIUM DEVELOPMENT GOAL TARGETS............................................................ 40
TABLE 13: GOVERNMENT EXPENDITURE, FIJI (F$ MILLION)........................................................................ 40
TABLE 14: KEY VARIABLES USED IN THE OLS REGRESSION ANALYSIS, AND THE RATIONALE
FOR THEIR USE.......................................................................................................................... 43
TABLE 15: RESULTS OF THE REGRESSION ANALYSIS, SUMMARISING EACH COEFFICIENT VALUE................ 44
TABLE 16: KEY THEMES OF THE PACIFIC DRR &DRM FRAMEWORK FOR ACTION 2005 - 2015.................... 55
TABLE 17: REPORTED DISASTERS IN THE PACIFIC ISLANDS, 1950–2004.................................................... 58
TABLE 18: KEY CHARACTERISTICS OF PACIFIC ISLAND COUNTRIES........................................................... 59
TABLE 19: MAIN ECONOMIC ACTIVITIES OF SELECTED PACIFIC ISLAND COUNTRIES.................................. 60
TABLE 20: IMPORTANCE OF SUBSISTENCE PRODUCTION TO HOUSEHOLD WELLBEING.............................. 61
TABLE 21: PACIFIC ISLAND COUNTRIES’ PERFORMANCE IN REGARDS TO KEY MILLENNIUM
DEVELOPMENT GOALS............................................................................................................... 62
TABLE 22: HDI VALUES FOR THE PACIFIC, 2007......................................................................................... 63
TABLE 23: HPI FOR PACIFIC ISLAND COUNTRIES........................................................................................ 63
Figures
FIGURE 1: FACTORS DETERMINING VULNERABILITY TO NATURAL DISASTERS.......................................... 18
FIGURE 2: RELATIVE IMPORTANCE OF DIFFERENT DISASTER EVENTS IN FIJI, 1970-2007.......................... 27
FIGURE 3: DISASTER EVENTS IN FIJI, 1970–2007..................................................................................... 28
FIGURE 4: PERCENTAGE OF LIVES LOST PER DISASTER EVENT, FIJI, 1970–2007...................................... 29
FIGURE 5: REPORTED NUMBER OF LIVES LOST FROM DISASTER EVENT, FIJI, 1970–2007......................... 29
FIGURE 6: REPORTED NUMBER OF PEOPLE AFFECTED BY DISASTER EVENT, FIJI, 1970–2007................... 30
FIGURE 7: TOTAL ESTIMATED COSTS BY DISASTER EVENT TYPE, FIJI (US$)............................................. 31
FIGURE 8: REPORTED ESTIMATED ANNUAL (NOMINAL) COST OF DISASTERS, FIJI, 1997–2007................ 31
SOPAC Miscellaneous Report 678
FIGURE 9: COMPOSITION OF FIJI’S GDP, 2006...........................................................................................33
FIGURE 10: PERCENTAGE CHANGE IN GDP AND AGRICULTURAL GDP, FIJI................................................... 35
FIGURE 11: REAL GDP PER PERSON, FIJI, 1990–2006................................................................................ 36
FIGURE 12: POPULATION OF FIJI, 1881–2007............................................................................................. 37
FIGURE 13: INCIDENCE OF POVERTY IN FIJI................................................................................................ 38
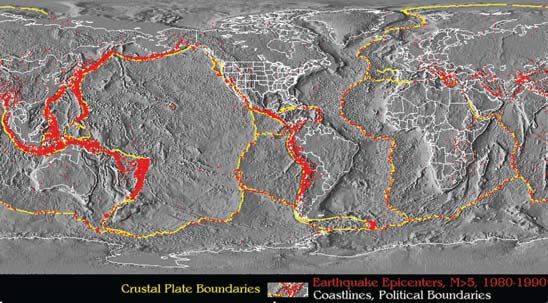
FIGURE 14: PACIFIC ‘RING OF FIRE’............................................................................................................ 57
FIGURE 15: RELATIVE IMPORTANCE OF DISASTER EVENTS......................................................................... 58
5Boxes
BOX 1: DIFFERENT MEASURES OF VULNERABILITYAND RISK................................................................... 18
BOX 2: DEFINITION OF POVERTY IN THE PACIFIC...................................................................................... 19
BOX 3: MEASURES OF POVERTY: THE HUMAN POVERTY INDEX AND HUMAN DEVELOPMENT INDEX.........20
BOX 4: ‘EXTENSIVE’ AND ‘INTENSIVE’ DISASTER RISK CATEGORIES......................................................... 27
BOX 5: A HUMAN FACE OF NATURAL DISASTERS.................................................................................... 30
BOX 6: TROPICAL CYCLONE KINA, 1993................................................................................................... 31
BOX 7: HOUSEHOLD LEVEL IMPACTS OF 2004 NAVUA FLOODS, FIJI........................................................ 33
BOX 8: SQUATTER SETTLEMENTS IN FIJI..................................................................................................38
BOX 9: ECONOMETRIC JARGON............................................................................................................... 41
BOX 10: CYCLONE AMI.............................................................................................................................. 46
BOX 11: WHAT IS DISASTER RISK MANAGEMENT?..................................................................................... 49
BOX 12: POVERTY REDUCTION AS A DEVELOPMENT GOAL OF DIFFERENT GOVERNMENTS IN FIJI.............. 50
BOX 13: BUILDING A CULTURE OF PREVENTION......................................................................................... 51
BOX 14: DISASTER RISK MANAGEMENT IN FIJI.......................................................................................... 53
BOX 15: SENSITIVITY OF RURAL ECONOMIES THAT RELY ON NARROW RESOURCES FOR THEIR
SUBSISTENCE LIVELIHOOD.......................................................................................................... 61
Maps
MAP 1: THE FIJI ISLANDS........................................................................................................................... 26
MAP 2: THE PACIFIC ISLAND COUNTRIES................................................................................................... 57
SOPAC Miscellaneous Report 678
6Acknowledgements
This study is a collaborative endeavour of the Pacific Islands Applied Geoscience Commission (SOPAC),
the United Nations International Strategy for Disaster Reduction Secretariat (UNISDR) and the United Nations
Development Programme – Pacific Centre (UNDP–PC), with financial support from the World Bank under Track
1 of the Global Facility for Disaster Reduction and Recovery (GFDRR).
Background material developed by UNISDR (Andrew Maskrey and associated experts) provided a useful
starting point for analysing the disaster risk and poverty links in this study. The technical support on disaster
risk provided by Ms Angelika Planitz of the UNISDR Pacific Sub-regional Office and the continued support and
encouragement of Mr Mosese Sikivou, Manager of SOPAC’s Community Risk Program, are highly appreciated.
UNDP-PC staff, especially Mr David Abbott and Mr Moortaza Jiwanji, provided comments on the earlier drafts.
Dr Mahendra Reddy of the Fiji Institute of Technology provided inputs during the earlier stages of the project.
Finally, the study could not have been completed without the support, data and historical information on
disasters (including floods and cyclones) provided by the National Disaster Management Office and Mr Ravind
Kumar of the Fiji Meteorological Services, and the poverty information provided by Ms Litia Mawi from the
Poverty Monitoring Unit of the Fiji Government.
Vinaka Vakalevu, Dhanyabad and Thank You.
SOPAC Miscellaneous Report 678
7Acronyms
BNPL basic needs poverty line
CPR crisis prevention and recovery
DM disaster management
DRM disaster risk management
DRR disaster risk reduction
ERT emergency response training
FAO Food and Agriculture Organization
FMS Fiji Meteorological Services
GDP gross domestic product
GFDRR Global Facility for Disaster Reduction and Recovery
HART Housing Assistance Relief Trust
HDI human development index
IDDR International Day for Disaster Reduction
NDC National Disaster Centre
HPI human poverty index
NDMA National Disaster Management Act
NDMC National Disaster Management Council
NDMO National Disaster Management Office
PIFRAC Pacific Islands Framework for Regional Action on Climate Change
RSMC regional specialised meteorological centre
RDRT regional disaster response training
SOPAC Pacific Islands Applied Geoscience Commission
UNDP United Nations Development Programme
UNDP–PC United Nations Development Programme – Pacific Centre
UNEP United Nations Environment Programme
UNESCO United Nations Educational, Scientific and Cultural Organisation
UNICEF United Nations Children’s Fund
UNISDR United Nations International Strategy for Disaster Reduction Secretariat
UNOCHA United Nations Office of Humanitarian Affairs
USAR urban search and rescue
SOPAC Miscellaneous Report 678
8Executive summary
Financial support from the Global Facility for Disaster Reduction and Recovery (GFDRR) is gratefuly
acknowledged. GFDRR is a partnership between Australia, Canada, Danmark, European Commission, Italy,
Japan, Luxembourg, Norway, Spain, Swieden, Swistzerland, United Kingdom and the World Bank.
The United Nations International Strategy for Disaster Reduction Secretariat (UNISDR) and the United Nations
Development Programme (UNDP) commissioned a global study to assess the relationship between poverty
and extensive disaster risk. Case studies in selected Asia Pacific regions include India, Nepal, Iran, Sri Lanka
and Fiji. The objectives of the Fiji study are to:
• develop and pilot a method to assess empirically the relationship between disaster and poverty in the
Pacific, using Fiji as the case study
• identify policy implications of the improved understanding of the relationship between poverty and natural
disasters, including recommendations for improved data collection and management
• draw out the relevance of the Fiji study for the Pacific and make policy suggestions to help other Pacific
Island countries and territories in their disaster risk management.
Relationship between natural disasters and poverty in Fiji
Natural disasters are a common occurrence around the world, including Fiji. Given its geographic location and
geophysical characteristics, Fiji regularly experiences natural disasters of geological and hydro-meteorological
origin. In the past 37 years, Fiji reported a total of 124 natural disasters, affecting almost all parts of the
country. Tropical cyclones accounted for 50 per cent of the events, followed by floods (33 per cent) and
earthquakes (8 per cent).
These natural disasters had a considerable impact on the lives and livelihoods of the people of Fiji. The total
direct cost associated with disaster events in Fiji between 1970 and 2007 was an estimated US$532 million.
Only 17 per cent of all the events accounted for 86 per cent of this total cost. These statistics reflect only
the 104 disaster events (51 per cent) for which the government reported cost estimates. Cyclones were the
highest contributor to the total costs reported during 1970 to 2007, reflecting their dominance in terms of
number and frequency.
Disasters are widely acknowledged to affect disproportionately the poorest in a community as they have
relatively higher sensitivity to disaster events compared with communities of higher development status.
Recurrent events increase the vulnerability of the poor to disasters, increasing poverty levels such that many
households often are unable to break out of the poverty cycle.
Fiji’s real gross domestic product (GDP) per person has increased over time, reaching F$3,722 in 2006.
This value, however, has not been equitably distributed across the community in Fiji. The Gini coefficient,
which is a measure of inequality in the GDP, decreased from 0.43 in 1977 to 0.34 in 2002-03. The limited
data suggests inequality across both the communities is decreasing, with the Indo-Fijian community showing
a greater decrease in inequality. There is, however, a need for caution in making any firm conclusion about
the changes in income distribution as Narsey (2008) found some discrepancy in particularly the 1990/91
SOPAC Miscellaneous Report 678
HIES data. Detailed poverty analysis by Narsey shows that poverty level has indeed increased since the
1970s. Moreover, the real value of the lowest income declined by around 15 per cent (Ministry of Finance
and National Planning 2004). This decrease in real wage rate has placed more people in Fiji below the basic
needs poverty line (BNPL).
9Number of people living in poverty levels in Fiji have increased substantially. In 1976, only 15 per cent of
households were reported to be living in poverty. This proportion had increased to 35 per cent (or one in three
households) by 2002-03. Slightly more Indo-Fijians than Fijians were living below the poverty line (37 per
cent compared with 34 per cent). The poverty level is expected to continue this upward trend, given political
and economic uncertainties in Fiji.
Increased disaster risks due to climate change are also expected to exacerbate poverty. The effects of disaster
on the poor will be different, however, across regions and between the two ethnic communities because the
poor are differently distributed across regions and ethnic groups.
Analytical method
To assess the relationship between disaster and poverty in Fiji, a combination of qualitative and quantitative
approaches was adopted:
• qualitative and quantitative analysis of the nature, number and frequency of hazard and disasters
• quantitative analysis of the structure of the economy, economic development trends based on official
Fiji Government statistics, and statistics reported by international financial institutions such as the World
Bank and the Asian Development Bank
• trend analyses as well as qualitative analysis of household wellbeing, based on official statistics
released by the Fiji Government, reports from the Asian Development Bank and the World Bank, official
international statistics on poverty and development released by the UNDP and academic reports released
on the subject
• quantitative econometric assessment of the two-way relationship between poverty and disaster, focusing
on the aggregate national level analysis.
The choice of a quantitative method to assess the relationship between disasters and poverty measures for Fiji
was influenced by the availability of robust time series and cross-sectional quantitative data for key parameters
that determine/influence both poverty and disaster effects, including vulnerability to disaster events at the
household, sector and national levels.
Results of the analysis of disaster and poverty in Fiji
Econometric analysis, combined with qualitative deductive analysis, confirms the existence of a complex two-
way relationship between disaster and economic and social wellbeing in Fiji. It confirms that disasters increase
poverty in the country and reduce national economic growth. It also confirms, conversely, that increases in
poverty make disaster outcomes much more severe. Ultimately, however, a complex set of factors influences
the depth and breadth of these relationships.
At the national level, with a relatively low GDP, low economic growth and high reliance on primary sector,
Fiji is highly sensitive to natural disasters. Low GDP and low economic growth also mean the country’s tax
revenue base is shallow, so the government does not have sufficient resources to invest in basic transport and
communication infrastructure to support private sector led economic growth. Fiji is also struggling to provide
good and accessible medical services and universal education. Moreover, with an economic development
status lower than that of many other countries, the government of Fiji is insufficiently equipped to invest in
risk reduction services and/or quickly respond to disasters and help the country recover and rehabilitate.
SOPAC Miscellaneous Report 678
Consequently, Fiji has conventionally relied on humanitarian and development support from development
partners in times of natural disasters and for recovery and rehabilitation.
At the household level, income and other social indicators indicate the household’s sensitivity to natural
disasters. People with low household incomes, particularly those living below the BNPL, often live in marginal
areas. Many do not have water security or safe sanitation, and they often have limited education. Disasters
are expected to increase people’s poverty status, particularly given they do not have the financial assets to
respond, recover and rehabilitate quickly, putting added pressure on their poverty status.
10Policy implications and key recommendations for disaster
risk reduction and disaster management in Fiji
Analysis of the relationship between disasters and poverty in Fiji suggests a multi-pronged approach to disaster
risk management and poverty alleviation is required. Attention needs to be given to reducing the sensitivity
of particularly poor households to disasters by improving the economic and social wellbeing of communities
and the country. That is, Fiji’s national economic development, as well as disaster risk management strategies,
must be sensitive to the needs and vulnerabilities of the poor living in hazardous areas. This focus on reducing
sensitivities, as well improving people’s ability to respond to and cope with disaster events, applies equally
when developing and implementing efforts to encourage both economic development and disaster risk
management.
Pro poor economic development
Recommendation 1: Adopt a pro poor development strategy that targets poor communities living in areas
prone to natural hazards.
To help reduce the sensitivities of the poor to disasters, and to inform targeted poverty reduction strategies and
improved preparedness and risk reduction measures:
• Identify the geographic distribution of the poor and the socioeconomic characteristics of particularly the
poor living in hazardous conditions (including in the urban squatter areas), and assess their sensitivities
to natural disasters.
• Adopt development strategies that aim to improve household income security and basic development
conditions (such as housing or access to water) that reduce sensitivities to disaster.
• Minimise residual disaster risk by controlling economic and infrastructure development to reduce exposure
to disasters. Governments and development agencies must integrate (in other words, ‘mainstream’)
disaster risk considerations in national development planning and budgeting processes at national,
provincial, district and village/settlement levels, and in designing development initiatives.
Mainstreaming of disaster risk to policy development
Disaster risk reduction benefits the poor more than disaster management does. For every dollar invested in
disaster risk reduction, between two and four dollars are returned in terms of avoided or reduced disaster
impacts.
Recommendation 2: Increase investment in disaster risk reduction as an effective measure to reduce the
disaster vulnerability of the poor and thereby improve overall economic development.
• Invest in social services that improve social conditions, such as universal education, access to water and
sanitation, thereby reducing the sensitivity of the poor and improving their capacity to respond to, cope
with and adapt to disaster impacts more effectively.
In the past, the Fiji Government has regularly invested in drainage and flood protection infrastructure, but
the level of investment has decreased in recent years, particularly following the 1987 political coup. The
SOPAC Miscellaneous Report 678
government has no dedicated strategy to ensure the development planning and budgeting processes at national,
provincial, district and village/settlement levels address hazard and risk considerations. Building codes, where
they exist, do not include considerations of increased risks from climate change related disasters, for example,
and where codes and guidelines are available for certain hazards, these are not enforced.
11Recommendation 3: Integrate disaster risk reduction considerations in all development initiatives.
• Integrate (in other words, ‘mainstream’) disaster risk considerations in national development planning
and budgeting processes at national, provincial, district and village/settlement levels, and in development
design.
• Revise infrastructure development planning and approval guidelines in all sectors to reflect requirements
for hazard and risk assessments.
• Revise development approval processes and guidelines to require hazard and risk assessments of
development initiatives, particularly in hazard prone areas.
• Strengthen the risk assessment and management skills of planners and development agencies that
approve development projects.
• Develop simple disaster risk management checklists to guide planners and development agencies in
their review of policies and plans/development projects.
Disaster management
Disaster management constitutes having emergency plans, equipment and trained and knowledgeable people
to help monitor hazards, operate end-to-end early warning systems and manage emergency responses. The
nature and frequency of awareness programs, the strength of the media in reaching every part of the country,
past experiences of the public and cultural beliefs also determine the extent of a community’s vulnerability.
A weak end-to-end early warning system increases the vulnerability of the poor, along with their ability to make
decisions and respond appropriately during an emergency. Although Fiji has sophisticated equipment at the
Fiji Meteorological Centre in Nadi, other parts of the country lag in having updated early warning systems. In
recent years, this discrepancy has severely affected efforts to distribute warnings in time to different parts of
the country.
Also constraining the early warning system are poor hazard monitoring capabilities due to limited institutional
capacity, difficulty in retaining qualified staff and limited monitoring stations in key locations in the hazard
prone areas. In addition, poor communication equipment, a lack of proper rescue equipment and insufficient
personnel training in disaster management have resulted in the inefficient operation of the Disaster Management
Team in some parts of the country.
Recommendation 4: Review the disaster monitoring and early warning system.
• Review monitoring capabilities for each hazard category, including the distribution of appropriate
monitoring stations and gaps in technical expertise in data analysis and forecasting. This review may also
cover gaps in the current network arrangements, with specialised international partners monitoring and
forecasting disaster events.
• Review the end-to-end warning system for each disaster category, to identify how to strengthen monitoring,
the generation of appropriate information and the communication of early warnings to communities. This
review should cover the required equipment and personnel training.
• Develop appropriate training and communication material to improve community awareness of disaster
events, community preparedness, and practical household response strategies for each type of disaster
event.
SOPAC Miscellaneous Report 678
Under the Natural Disaster Management Act (NDMA) 1998, the National Disaster Management Office (NDMO)
focuses on post-disaster response, recovery and rehabilitation. The NDMA institutes a number of bodies and
individuals responsible for aspects of disaster management, including the National Disaster Management
Council (NDMC), Fiji Red Cross, the Emergency Committee, the National Disaster Controller and the NDMO.
Disaster management efforts are constrained by organisational and as well as operational issues, including
(Rokovada 2006):
12• the absence of appropriate information to predict, assess or respond to disaster events (for example,
hazard maps, the scale of inundation, and disaster impacts)
• the institutional design of the decision making and coordination process
• the inadequate resources available to the NDMO
• the inadequate equipment at emergency operations centres at the divisional and district levels
• the fact that NDMO operations are not linked to/integrated with Fiji’s rural development/administrative
machinery may it difficult to directly engage with, and coordinate disaster response initiatives at divisional,
provincial, district and community levels.
Recommendation 5: Review the authority of the NDMO and its organisational arrangements in relation to the
Ministry of Provincial Development and other government agencies, and information systems available to the
office for strengthening capacity for disaster risk reduction and disaster management (DRR&DM).
• Clarify the appropriate authority of the NDMO in disaster management, including the coordination of
disaster assessments following disaster events, to underpin appropriate domestic humanitarian and
rehabilitation responses.
• Review the coordination of disaster responses from national and international humanitarian agencies, and
improve the coordination of disaster assistance from government and nongovernment agencies.
• Review the scope and depth of different geographic information systems (GISs) and databases available
in the country that could support disaster risk management.
All levels of government and all communities should simultaneously pursue DRR&DM. The Fiji Government
agreed, under a Pacific regional framework for action, to establish appropriate mechanisms for developing and
promoting DRR&DM, and to review regularly all DRR&DM arrangements. The government has not fully acted
on these commitments, although the National Disaster Management Plan of 1995 and the NDMA have been
under review for several years.
Recommendation 6: Urgently complete the review of the National Disaster Management Plan of 1995 and
the Natural Disaster Management Act 1998, and develop a national action plan for DRR&DM, reflecting the
regional framework of actions for disaster risk management and climate change.
• Urgently develop and implement a DRR&DM national action plan linked to national development plan
and budget processes, meeting the Fiji Government’s commitment to the Pacific Island Forum Leaders to
systematically implement the Pacific regional framework for DRR&DM (and the Pacific Island Framework
for Action on Climate Change).
• Develop appropriate DRR&DM policies and legislation that set appropriate institutional arrangements for
ensuring the coordination of DRR initiatives across all sectors and across all levels of government, as well
as appropriate DRR&DM strategies, decision making processes and initiatives.
• Develop a funding strategy for addressing a prioritised and appropriately sequenced set of actions, which
the national action plan will articulate, and which will reflect a programmatic approach explained in both
the Paris Principles of Aid Effectiveness and the Forums Principles of Aid Effectiveness.
• Strengthen the operating guidelines of the Budget and Aid Coordinating Committee and the Development
Sub-committee to include DDR&DM considerations in all development projects.
• Encourage development partners to help strengthen DDR efforts.
Disaster risk management: data
SOPAC Miscellaneous Report 678
To develop and implement targeted DRR&DM strategies, good quality data are critical. Fiji has limited quality
data on poverty, hazards, hazard prone areas and disaster impacts, including coverage of disaster events and
their effects on household welfare, sectoral activities and national economy.
13Recommendation 7: Improve the coverage and quality of data on poverty, hazards (including hazard maps) and
on the impacts of disasters on human livelihood and wellbeing at household, sectoral and national levels.
• Develop time series information on determinants of natural disasters to support the forecasting of disaster
events.
• Compile time series information on household income and expenditure, the human poverty index and
human development index, and their key determinants to inform both development policies.
• Develop a GIS based disaster information system, including maps of hazard and disaster prone areas, the
geographic distribution and socioeconomic characteristics of poor, disaster records and disaster impact
assessments, to help improve DRR&DM.
Implications of the Fiji study for the other Pacific island countries and territories
The results of the Fiji study are directly relevant to other Pacific island countries (PICs), although the
empirical relationship between disaster and poverty may be different in different countries. The types of hazard
experienced throughout the Pacific are similar to those found in Fiji, although disaster frequency and intensity
vary across countries. Sensitivity to natural disasters is relatively more acute for most PICs when compared to
Fiji because of their lower status of the economic and social development, as reflected by key development
and poverty indicators, and lower household economic conditions. The broad conclusions of the two-way
empirical analysis of Fiji could apply to most other PICs, and the challenges for reducing DDR&DM are also
very similar.
Other PICs, like Fiji, have at least acknowledged in principle the importance of taking a DRR&DM approach
that focuses on preventative measures to minimise risks, preparedness in the event of a hazardous event, and
effective and timely post-disaster response and rehabilitation. As noted, the Pacific Islands Forum Leaders
in 2005 signed the DRR&DM Framework for Action 2005–2015. They have also called for this regional
framework to be operationalised at the national level. The key recommendations identified for DDR&DM in Fiji
would thus equally apply to other PICs.
SOPAC Miscellaneous Report 678
14Preface
Disasters are widely acknowledged to affect disproportionately the poorest in a community, as they have
relatively higher sensitivity to disaster events compared with communities of higher development status.
Recurrent events increase the vulnerability of the poor to disasters, increasing poverty levels such that many
households often are unable to break out of the poverty cycle. Medium to longer term impacts of disasters
at the national level also challenge development progress towards reducing poverty, possibly (re)creating
conditions that place marginal urban and rural communities perpetually ‘at risk’ (UNISDR 2007).
The exact relationship between disasters and poverty is context specific and often poorly understood. The
Secretariat for the United Nations International Strategy for Disaster Reduction (UNISDR 2007a) noted there
is little empirical evidence of the long term impact of disasters on the lives and livelihoods of people and
on national development prospects. To address this gap, the UNISDR and the United Nations Development
Programme (UNDP) supported analysis of the relationship between poverty and disaster risks in selected Asia
Pacific countries, including India, Nepal, Sri Lanka, Iran and Fiji.
These studies are intended to help the UNISDR make a global comparative assessment of the link between
poverty and disaster, and report in the Global assessment report on disaster risk reduction (see that report’s
annex for the objectives of the Asian and Fiji studies). For the Pacific, this Fiji case study provides a better
understanding of the relationship between disasters and poverty, and offers a study method that other parts of
the Pacific could use. It also provides specific multi-pronged policy recommendations for decreasing disaster
risk and increasing resilience.
SOPAC Miscellaneous Report 678
151. Introduction: hazards,
disasters and poverty
No part of the global community, including the Pacific, is immune to the impacts of natural or human induced hazards1
and few are spared the effects of poverty. This section introduces key concepts of disaster and poverty used in this report
to analyse the relationship between disaster and poverty for the Pacific.
1.1 Basic concepts
1.1.1 Hazard
A natural hazard is a condition that may cause loss of life, injury or other health impacts; property damage; loss
of livelihoods and services; social and economic disruption; and/or environmental damage (UNISDR 2009).
It may be of natural origin and may arise from a variety of geological, meteorological, hydrological, oceanic,
biological or technological sources, sometimes in combination (table 1). Geographic location is an important
determinant of the types of natural hazard to which a country is exposed. The characteristics of natural hazards
vary considerably in terms of their speed of onset, duration, intensity and warning time. Approaches to reduce
the impacts of hazards thus need to be context specific and tailored to each hazard type.
Table 1: Types of hazard
Type Examples
Hydro-meteorological-caused by • Tropical cyclones, precipitation (rain), storm surges, wind,
natural processes or phenomena and other severe storms and lightning
associated with atmospheric, • Floods debris and mudflows, and landslides
climatic, oceanographic or • Drought and desertification
hydrological conditions • Wild fires, temperature extremes and sand or dust storms
Geological—caused by natural earth • Earthquakes and associated landslides, and rockslides
processes or phenomena • Tsunami
• Volcanic activity and emissions
• Surface collapse and geological fault activity
Diseases, including epidemics and • Water and vector borne diseases following flooding
pandemics—caused by an outbreak • Cholera and other epidemics
of bacterial, viral or other sources • Avian flu
Industrial and other disasters • Fires and oil spills
Source: adapted from Benson and Twigg 2007.
1.1.2 Disaster and disaster risk
Disaster is defined as a serious disruption of the functioning of a community or a society, involving widespread
human, material, economic and/or environmental losses and impacts that exceed the ability of the affected
SOPAC Miscellaneous Report 678
community or society to cope using its own resources (adapted from UNISDR 2009). Disaster events may be
sudden and unexpected, or slow moving in their onset. They share a common characteristic, however, in their
potential to cause widespread community disruption, displacement, economic loss, property damage, death
and injury, environmental degradation and profound emotional suffering (Peek 2008). The potential impact of
disasters is described by the term ‘disaster risk’.
1
Climate change is an example of a human induced hazard.
161.1.3 Disaster impacts
Globally, natural disasters have killed more than 1.5 million people in the past two decades and affected 255
million annually. Ninety-seven per cent of disaster related deaths reported globally occurred in developing
countries (World Bank 2000). Economic losses associated with natural disasters are now estimated to be 15
times higher than they were in the 1950s (adjusting for inflation), and disasters caused approximately US$67
billion in losses in each year from 1994 to 2003 (Peek 2008; World Bank 2006).
Whatever the origin of disasters, their impacts include loss of life, injury to persons, damage to property,
destruction of assets, loss of services, social and economic disruption and or environmental degradation.
Disasters often affect water supply and sanitation, adding pressure to already poor health conditions in many
communities. Cyclones and floods particularly result in an increased incidence of water and vector borne
diseases (Campbell-Lendrum and Woodruff 2007). Such effects also lower economic capacity (Freeman
1999), causing further medium term economic losses that usually are not captured by impact assessments
conducted in the immediate aftermath of disasters.
At the national level, the impacts of natural disasters are not merely a social and humanitarian issue. They
are economically significant, affecting national macroeconomic and the national fiscal environment (Benson
and Clay 2004). Disasters usually mean higher government expenditure and/or part reallocation of already
committed financial resources (usually from the capital budget), to meet the costs of disaster relief and the
costs of repair and rehabilitation of public property, and to provide support to victims. Disasters also mean a
fall in government revenue because they cause a reduced level of economic activity, including possible net
falls in imports and exports. Reduced economic activity implies reduced direct and indirect tax revenue, and
thus increased budgetary pressures, which may result in governments borrowing more, placing inflationary
pressures on the economy. International modeling results also suggest disasters can dampen investment and
reduce long term economic growth, through their negative effect on a country’s credit rating and an increase in
interest rates for external borrowing (Benson and Clay 2004; Cochran 1994). Ultimately, such effects manifest
themselves at the household level.
1.1.4 Sensitivity and disaster risk
Disaster impacts are determined not only by the nature of the hazard, but also by the society’s vulnerability.
Vulnerability is defined as the characteristics and circumstances of a community, system or asset that make
it susceptible to the damaging effects of a hazard (UNISDR 2009). These circumstances can be linked to the
structure and the status of the national economy, the condition of physical infrastructure (including access
to water and sanitation) and the socioeconomic characteristics of households (including income, health and
education). Vulnerability is thus the concept that explains why, with a given level of physical exposure, people
are more or less at risk (UNDP 2009).
Vulnerability has three component elements: the sensitivity of households and communities to hazards; the
ability to respond to disasters; and the ability to cope with the immediate effects of disasters. (The term
‘sensitivity’ is used in this report to emphasise individuals’ and communities’ conditions that particularly
have the potential to magnify the effect of disaster.) Vulnerability is high in many areas as a result of poor
infrastructure, which is often perceived as a key component of a country’s economic status. Freeman (1999)
demonstrated a direct link between vulnerability to natural disasters and poor infrastructure. Poor infrastructure
affects people’s ability to engage in income generating activities, as well as their ability to respond to disasters.
SOPAC Miscellaneous Report 678
Poor infrastructure standards, weak government regulations (such as the absence of building codes) and weak
regulatory enforcement also increase disaster risks.
Countries that heavily rely on the primary sector are also generally found to be more sensitive to the effects of
natural disasters (Benson 1997; Benson and Clay 2004), particularly disasters of hydro-meteorological origin.
At the same time, the process of development adopted and the development choices made in many countries
affect those countries’ vulnerability to disasters—for example, environmentally unsustainable development
practices, such logging in areas prone to landslides, increase disaster risks.
17Human vulnerability is exacerbated by weak end-to-end disaster warning systems and the ability of people
to manage disaster. Disaster management constitutes having emergency plans, equipment, and trained and
knowledgeable people to help monitor hazards, operate end-to-end early warning systems and manage
emergency responses. The nature and frequency of awareness programs, the strength of the media in reaching
every part of the country, past experiences of the public and cultural beliefs also determine the community’s
vulnerability.
At the household level, sensitivity to external shocks can be viewed in terms of livelihoods and food and
nutritional status. The former also depends on human development conditions, such as household income,
access to water and sanitation, maternal and child mortality, and education. The poorer the economic and
social wellbeing at the household level, the more sensitive the household is to the impact of hazards (primarily
because it has a low threshold for withstanding external shocks) and the less able it is to respond to, cope with
and adapt to disasters (because it does not have much, if any, capital reserve on which to draw).
The vulnerability of communities, economies and countries is thus a result of the interaction of hazards
exposure, the economic status of households, the sensitivity of the environment and economy to hazards, the
state of infrastructure, and the ability to respond to and cope with disaster events (figure 1).
Figure 1: Factors determining vulnerability to natural disasters
Sensitivity of natural environment, human capital,
Hazard/exposure physical infrastructure and economic subsystems,
and household wellbeing
Potential impact Coping capacity
Impacts realised, or vulnerability
Source: adapted from (Schroeter, D. and ATEAM Consortium 2004).
Unfortunately, no single measure adequately captures the vulnerability of people and economies to external
shocks (see Eriksen and Kelly 2007). Several different measures have thus been used to describe vulnerability
(box 1).
Box 1: Different measures of vulnerability and risk
The economic vulnerability index combines vulnerability due to risk exposure factors—such as
smallness, remoteness, reliance on agriculture and the structure of the economy—as well as a natural
SOPAC Miscellaneous Report 678
shock index, capturing factors such as homelessness and other human asset capacity (a measure
of undernourishment, mortality, adult literacy etc.), and instability in the natural environment and
markets. It is a measure of vulnerability associated with exposure risks, as well as a natural shock
index. Unfortunately, it is available only for the least developed countries. Although useful as an inter-
country comparative tool, the economic vulnerability index does not provide empirical evidence of the
relationship between disasters and livelihood (see www.un.org/special-rep/ohrlls/ldc/ldc%20criteria.
htm).
continued next page
18The environment vulnerability index identifies three aspects of vulnerability: risks to the environment
(natural and anthropogenic), the innate ability of the environment to cope with the risks (resilience) and
ecosystem integrity (the health or condition of the environment as a result of past impacts) (Kaly et al.
1999).
The disaster risk index measures the relative vulnerability of countries to three key natural hazards:
earthquake, tropical cyclone and flood. It reflects the average risk of death per country in large and
medium scale disasters associated with earthquakes, tropical cyclones and floods, based on data from
1980 to 2000. It also enables the identification of socioeconomic and environmental variables that
are correlated with risk of death and that may point to the causal processes of disaster risk. It indexes
countries for each hazard type according to their degree of physical exposure, their degree of relative
vulnerability and their degree of risk (UNDP 2009).
1.1.5 Poverty
Poverty is usually considered an important factor for determining household sensitivity and vulnerability to
hazards because household income level determines people’s coping and adaptation capacities. Poverty
exacerbates the negative effects of disasters on households, increasing the severity of existing poverty and/or
increasing the number of people suffering from it.
Before examining this relationship, it is important to explain what is meant by ‘poverty’. The most common
definition is based on household and per person incomes. A person is conventionally considered poor if his or
her income level falls below some minimum level necessary to meet needs such as housing, food, clothing,
education, health and so on. This minimum level is usually called the ‘poverty line’. The World Bank defined
the global poverty line to be in the range of US$1.25 and US$2 per day (in terms of 2005 purchasing power
parity). The 10 to 20 poorest countries of the world have an average poverty line of $1.25 a day, and about 1.4
billion people in the developing world lived in poverty (or on less than US$1.25 a day) in 2005.
An alternative measure used to describe poverty is the ability to meet basic needs. The basic needs poverty
line (BNPL) is the minimum income that an individual requires to meet his or her basic needs and is based
on the food poverty line and the non-food poverty line. The latter, at its basic level, ‘is the monetary cost
of the non-food essentials’ deemed necessary for a ‘standard’ household to achieve the minimum socially
acceptable standard of living in non-food items (Narsey 2008). It comprises housing and household expenses,
utilities, transport, education, medical expenses, clothing and entertainment.
What is necessary to satisfy basic needs varies across time and societies, however, so the definitions of
poverty and poverty lines also vary across time and place. Each country uses a poverty line appropriate to its
level of development, and societal norms and values. For the Pacific, poverty is thus defined in terms of not
only income level but also other social indicators, including education level and access to water and sanitation
(box 2).
Box 2: Definition of poverty in the Pacific
SOPAC Miscellaneous Report 678
‘An inadequate level of sustainable human development manifested by:
• a lack of access to basic services such as primary health care, education and potable water
• a lack of opportunities to participate fully in the socioeconomic life of the community
• a lack of adequate resources (including cash) to meet the basic needs of the household or the
customary obligations to the extended family, village community, and/or the church.’
Source: Abbott and Pollard 2004.
19As in the case of disaster vulnerability, no one measure adequately captures poverty of opportunities. Many
different measures have been used,2 including the human development index and the human poverty index
(box 3).
Box 3: Measures of poverty: the human poverty index and human development
index
Human development index (HDI)
The HDI provides a composite measure of three dimensions of human development: living a long
and healthy life (measured by life expectancy), having an education (measured by adult literacy and
enrolment at the primary, secondary and tertiary levels) and having a decent standard of living (measured
by purchasing power parity (PPP) income per person). A higher HDI implies higher levels of human
development.
Human poverty index (HPI)
The HPI is derived from average longevity, or life span (represented by the percentage of people expected
to die before age 40), knowledge (measured by the percentage of adults who are illiterate) and a decent
standard of living (represented by a composite of three variables: the percentages of people with access
to health services and safe water, and the percentage of malnourished children aged under 5). A lower
HPI implies the economy is doing well in terms of the basic social indicators. The HPI thus looks beyond
income deprivation and represents a multidimensional alternative to the $1 a day (PPP US$) poverty
measure.
Source: UNDP 2008.
1.2 The link between disaster risk and poverty
There is considerable anecdotal evidence of a link between disaster risk and poverty. Findings from worldwide
consultations with the poor (World Bank 2000), the UNDP’s (2004) report on mutual links between disaster
and development, and the UK Department for International Development’s (Department for International
Development 2004) explanation of the links between development and disasters in view of the long term
impacts on poverty trends have all pointed to a relationship between disasters and poverty.
It is widely acknowledged that the poor often live on marginal lands and in poorly constructed houses, and
often have poor access to water and sanitation—for example, 80 per cent of the poor in Latin America, 60 per
cent of the poor in Asia, and 50 per cent of the poor in Africa live on marginal lands characterised by poor
productivity (World Bank 1997). According to White et al. 2004, people living in such conditions generate
a range of immediate ‘unsafe conditions’. Such conditions make the poor more sensitive to disasters and
exacerbate their poor economic status. While those better-off may choose to live in higher risk areas, the
poor often have no other choice. Poor thus live in poorly constructed houses, have poor access to water and
sanitation, and often do not have food and nutritional security. Living in poverty thus increases their sensitivity
to disaster. Given limited income and limited financial savings (if any), the ability of the poor to respond to
and recover from disaster is limited at best. Further, the poor cannot easily adapt to disaster by investing in
options such as disaster-proof technology, relocating to less hazardous areas, replacing lost items or even
SOPAC Miscellaneous Report 678
taking out insurance (World Bank 1997).
2
Recently, two other indexes have been developed: the economic vulnerability index and the environmental vulnerability index. The
economic vulnerability index is available only for least developing countries. For the environmental vulnerability index, see Kaly, et al
(1999). See also Eriksen and Kaley 2007, for a review of indexes, including the vulnerability indexes.
20You can also read