Developing the Capacity of ESCWA Member Countries to Address the Water and Energy Nexus for Achieving Sustainable Development Goals - Water-Energy ...
←
→
Page content transcription
If your browser does not render page correctly, please read the page content below

Economic and Social Commission for Western Asia

                     Developing the Capacity of
                     ESCWA Member Countries to Address
                     the Water and Energy Nexus for Achieving
                     Sustainable Development Goals
                     Water-Energy Nexus Operational Toolkit
                     Resource Efficiency Module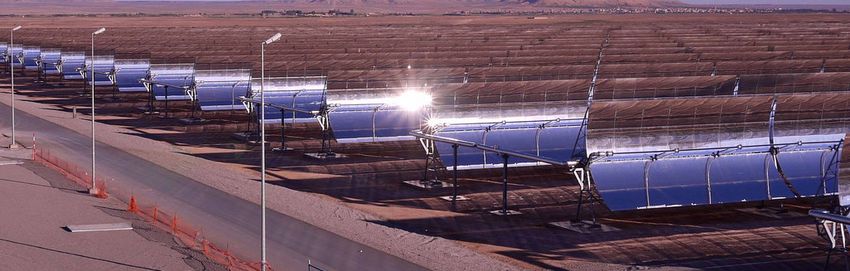
Economic and Social Commission for Western Asia

Developing the Capacity of
ESCWA Member Countries to Address
the Water and Energy Nexus for Achieving
Sustainable Development Goals

Water-Energy Nexus Operational Toolkit
Resource Efficiency Module

UNITED NATIONS
    Beirut
© 2017 United Nations
                                      All rights reserved worldwide

    Requests to reproduce excerpts or to photocopy should be addressed to the United Nations
    Economic and Social Commission for Western Asia (ESCWA), United Nations House, Riad El
    Solh Square, P.O. Box: 11-8575, Beirut, Lebanon.

    All other queries on rights and licenses, including subsidiary rights, should also be addressed
    to ESCWA.

    E-mail: publications-escwa@un.org;
    website: www.unescwa.org

    United Nations publication issued by ESCWA.

    The designations employed and the presentation of the material in this publication do not
    imply the expression of any opinion whatsoever on the part of the Secretariat of the United
    Nations concerning the legal status of any country, territory, city or area or of its authorities,
    or concerning the delimitation of its frontiers or boundaries.

    Mention of commercial names and products does not imply the endorsement of the United
    Nations.

    References have, wherever possible, been verified.

    Symbols of the United Nations documents are composed of capital letters combined with
    figures. Mention of such a symbol indicates a reference to a United Nations document.

    The opinions expressed in this technical material are those of the authors and do not
    necessarily reflect the views of the United Nations Secretariat.

    E/ESCWA/SDPD/2016/TOOLKIT.1

    16-00321

2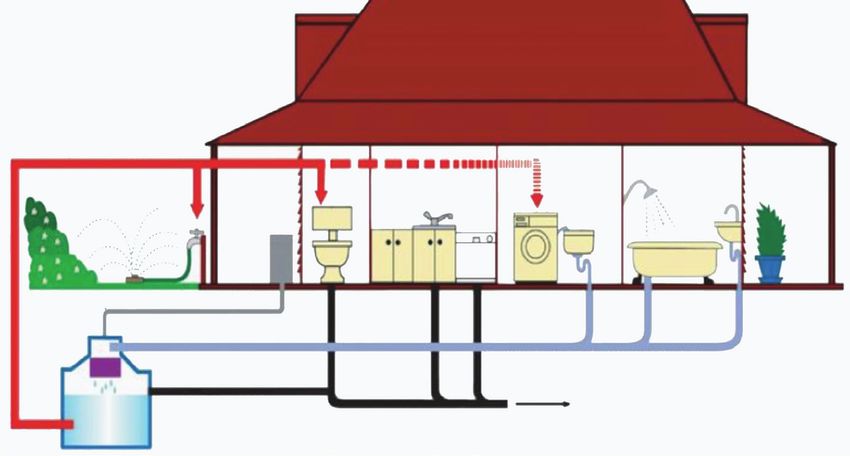
Acknowledgements

Water-Energy Nexus “Resource efficiency” operational toolkit module was prepared by Dr.
Hassan A. Arafat, Professor at the Department of Chemical and Environmental Engineering
at Masdar Institute of Science and Technology and Dr. Sanaa Pirani, independent consultant.
The module was reviewed by the Energy Section and the Water Resources Section in the
Sustainable Development Policies Division (SDPD) at the United Nations Economic and
Social Commission for Western Asia (ESCWA) in Beirut. The topics addressed by the module
were jointly identified by the members of the ESCWA Energy Committee and the ESCWA
Committee on Water Resources.

                                                                                              3
Contents
Introduction 11
Technologies to improve water efficiency 18
Technologies to improve energy efficiency 40
Key performance indicators for the water-energy nexus 57
Efficiency-improving technologies: Financial perspective 68
Conclusion and recommendations 71
Annexes 72
Bibliography 87
List of tables
Table 1. The top 33 water-stressed countries in the world by 2040 14
Table 2. End use of recycled water and minimum treatment 19
Table 3. Water coefficients in primary energy production 21
Table 4. Cooling system trade-offs 23
Table 5. Water withdrawn and consumed for power plant cooling (gallons of water required 24
per megawatt-hour of electricity produced)
Table 6. Water required and recovery assessment for various oil recovery technologies 28
Table 7. Limitations of various EOR processes 29
Table 8. Benefits and drawbacks of consolidation practices 30
Table 9. Potential water and energy-saving technologies available in the industrial, 32
commercial and institutional sectors
Table 10. Processes of an intelligent metering system 39
Table 11. Energy management opportunities in the water and wastewater industries 40
Table 12. Unit electricity consumption in kWh/cubic meter for wastewater treatment by plant 42
size and type of treatment
Table 13. Typically consumed energy for several plants’ capacity and different WWT 42
processes
Table 14. Energy intensity of recycled water treatment and end uses of the recycled water 43
Table 15. Energy efficiency strategies for municipal WWTPs 44
Table 16. Best practices in water and wastewater energy management 45
Table 17. Processing and disposal methods of solids 47
Table 18. Total annual energy consumption for a typical 1-MGD system, including electrical 48
and fuel requirements
Table 19. Summary of potential savings through use of best practices in wastewater 49
treatment plants
Table 20. Summary of energy recovery potential using established technologies 49
5Table 21. Comparison between various desalination technologies 52
Table 22. Strategies for energy savings through capital (CAPEX) and operational (OPEX) 55
expenditure reduction with higher productivity membranes
Table 23. Targets and indicators related to SDG 6 and water efficiency 59
Table 24. Energy efficiency indicators 62
Table 25. Possible indicators for tracking the energy-water nexus at country levels 66
worldwide
Table 26. Typical energy savings and payback periods for best practices in the water and 68
wastewater industry
Table 27. Energy consumption and water costs (average values) of large-scale commercial 70
desalination processes
Table A1. Advantages, disadvantages and applicability of different water treatment 72
technologies for the oil and gas industry
Table A2. General energy management best practice description: Electric motors − Variable 77
frequency drives applications
Table A3. Description of wastewater energy management best practices 78
List of Figures
Figure 1. The water-energy nexus illustrated 12
Figure 2. Population at mid-year residing in urban areas for ESCWA member countries 13
Figure 3. Unmet water demand in selected ESCWA member countries 15
Figure 4. Representative problem/opportunity spaces in water for energy 16
Figure 5. Representative problem/opportunity spaces in energy for and from water 17
Figure 6. Flow chart of embedded water in energy 20
Figure 7. Gaps in meeting water demands of thermal power plants under low flow conditions 20
Figure 8. Diagram of different cooling systems 22
Figure 9. Flow chart of oil and embedded water 26
Figure 10. Flow chart of natural gas and embedded water 27
Figure 11. End uses of water in various types of commercial and institutional facilities 31
Figure 12. Purity profiles used as part of pinch analysis 35
Figure 13. Schematic diagram of a greywater recycling system 36
Figure 14. Hierarchy for water efficiency strategies 37
Figure 15. Breakdown of typical wastewater system energy consumption 41
Figure 16. Commonly used processes and equipment in wastewater treatment 46
Figure 17. Life cycle costs of inefficient vs. efficient pump systems 51
Figure 18. The IEA energy indicators pyramid 65
6Abbreviations and explanatory notes
AD Anaerobic digester
AFED Arab Forum for Environment and Development
AMI Advanced metering infrastructure
bbl Oil barrel
BNR Biological nutrient removal
BOD Biochemical Oxygen Demand
BTU British thermal unit
BWRO Brackish water reverse osmosis
CAGR Compound annual growth rate
CAPEX Capital expenditure
CBNG Coalbed natural gas
CDMA Code division multiple access
CDP Carbon Disclosure Programme
CEO Chief Executive Officer
CHP Combined heat and power
COD Chemical oxygen demand
CP Centrifugal pump
CSS Cyclic steam stimulation
DAF Dissolved air flotation
DEWA Dubai Electricity and Water Authority
DO Dissolved oxygen
DR Demand response
dw Dwelling
EIA United States Energy Information Administration
EIP Water European Innovation Partnership on Water
EOR Enhanced oil recovery
ERD Energy recovery devices
ESCWA Economic and Social Commission for Western Asia
EWS-WWF Emirates Wildlife Society - World Wildlife Fund
FAO Food and Agriculture Organization of the United Nations
FE Final effluent
FGD Flue-gas desulfurization
FO Forward osmosis
7GCC Gulf Cooperation Council
GDP Gross domestic product
GHG Greenhouse gas
GJ Gigajoule
gpf Gallons per flush
gpm Gallons per minute
GSM Global System for Mobile Communications
GTF Global Tracking Framework
GWh Gigawatt hour
GWRC Global Water Research Coalition
HVAC Heating, ventilation and air conditioning
IEA International Energy Agency
IM Intelligent water metering
inhab Inhabitant
kgoe Kilogram of oil equivalent
kg/s Kilogram per second
ktoe Kiloton of oil equivalent
kWh Kilowatt hour
LC Local currency
LNG Liquefied natural gas
MED Multiple-effect distillation
MENA Middle East and North Africa
MF Microfiltration
MGD Millions of gallons per day
MJ Megajoule
MSF Multi-stage flash distillation
mWh Megawatt hour
N Nitrate
NF Nanofiltration
NORM Naturally occurring radioactive materials
OAPEC Organization of the Arab Petroleum Exporting Countries
OECD Organisation for Economic Co-operation and Development
OPEC Organization of the Petroleum Exporting Countries
OPEX Operational expenditure
P Phosphorus
8PPP Purchasing power parity
RE Renewable energy
RO Reverse osmosis
SAGD Steam-assisted gravity drainage
SAR Sodium adsorption ratio
SCPG Specific consumption of power generation
SDG Sustainable Development Goal
SE4All Sustainable Energy for All
SS Suspended solids
SWRO Seawater reverse osmosis
tCO2e Ton of CO2 equivalent
TDS Total dissolved solids
TFC Total final consumption
toe Ton of oil equivalent
tph Ton per hour
UF Ultrafiltration
UNEP United Nations Environment Programme
UV Ultraviolet
VFD Variable frequency drive
VSD Variable speed drive
WAG Water-alternating gas
WAS Waste-activated sludge
WWTP Wastewater treatment plant
W4EF Water for Energy Framework
$2000 US dollar at constant value for the year 2000
9Introduction
The United Nations Economic and Social Commission for Western Asia (ESCWA), as part of its
efforts to help member countries find an integrated approach to the Sustainable Development
Goals (SDGs), is implementing a United Nations Development Account project to develop the
capacity of member States to examine and address the water and energy nexus.
To achieve this, ESCWA is using two parallel and complementary tracks. The first targets high-
level officials into ministries of water and energy who will be trained on how to incorporate
the nexus in policies and strategies at national and regional levels by means of a regional
policy toolkit. This is comprised of seven modules based on priorities identified during an
intergovernmental consultative meeting in 2012.1 The seven priorities, which were endorsed by
the ESCWA Committees on Water Resources and on Energy, are the following:2
a. Knowledge and awareness-raising;
b. Increasing policy coherence;
c. Examining the water-energy security nexus;
d. Increasing efficiency;
e. Informing technology choices;
f. Promoting renewable energy;
g. Addressing climate change and natural disasters.
The second track targets water and energy service providers by means of three technical
interventions addressed through an operational toolkit made up of the following three stand-
alone modules:
a. Resource efficiency: To improve efficiency during the production and consumption of water
and energy resources and services;
b. Technology transfer: For water and energy considerations when pursuing the transfer of
new technologies regionally;
c. Renewable energy: To assess costs and benefits related to applying renewable energy
technologies in the region.
Each module will be discussed in one of three regional technical workshops, which will bring
together participants doing similar work in different sectors.
11Developing the Capacity of ESCWA Member Countries to Address the Water and Energy Nexus for Achieving Sustainable Development Goals
Background
The water-energy nexus, on the one hand, Figure 1. The water-energy nexus
refers to the relationship between the illustrated
water used for the production of energy, as
a renewable resource for hydroelectricity Water needed for power generation
production, and the energy/electricity and cooling processes
generation process itself. On the other
hand, it refers to the energy consumed in the
extraction, treatment, distribution and Prevalence of Demand
disposal of different types of water (for technology-centric of an increasing
lifestyles middle class
example, drinking water and wastewater)
(see figure 1). It must be clarified, however,
that this system is generally not a closed
circle. For instance, the water treated with Water Energy
the use of energy may not necessarily go on
to aid in the energy production process but
may rather be used as a source of potable
water in households. Nevertheless, water Growing Increased
populations urbanization
and the generation and use of energy are all
interconnected to a certain extent.
The water-energy nexus is a subject, which
Energy needed for water treatment,
has received much attention in the recent past, distribution and storage
as mankind expects to have infinite
development in a world with finite resources.
Source: Created by authors.
This has significant ramifications on our water
and energy resources and thus the water-energy nexus. Figure 1 shows some of the factors
(shown in green boxes) leading to increased water and energy demand. These factors are true
on a global scale. For example, population growth means growing demand for resources.
Over the next forty years, urban areas, particularly those in the developing world, are expected
to “absorb all of the population growth”.3 Furthermore, most of the population growth
expected in urban areas will be concentrated in the cities and towns of less developed regions.
Having such large populations in such small areas of our planet puts much strain on water and
energy resources. For instance, urban settlements are known to be the main source of point-
source pollution; if urban wastewater is combined with untreated industrial waste, it can be
even more hazardous.4 Such contaminated water requires more energy-intensive processes in
order to be treated, adding intricacies to the water-energy nexus. Additionally, urban lifestyle
leads to increased consumption of water-intensive foods5 with large urban populations relying
mostly on external entities for their resources.6 These changes affect the transportation and
distribution of water and energy resources, increasing the complexities facing the water-
energy nexus. In fact, in a 2015 report, urbanization was identified as a drive for such issues as
the “failure of critical infrastructure” and water crises.7 This urbanization is also linked with a
rising middle class, whose income growth is generally a strong drive for the demand for such
resources as water and energy.
These growing income levels also go hand in hand with greater access to and interaction with
technology, also in developing countries. In fact, Internet and mobile technology have rapidly
12Water-Energy Nexus Operational Toolkit Resource Efficiency Module
Figure 2. Population at mid-year residing in urban areas for ESCWA member countries
(percentage)
Annual Percentage of Population at Mid-Year Residing in Urban Areas, 1950-2050
100
90
80
70
Percentage (%)
60
50
40
30
20
10
0
1950
1954
1958
1962
1966
1970
1974
1978
1982
1986
1990
1994
1998
2002
2006
2010
2014
2018
2022
2026
2030
2034
2038
2042
2046
2050
Bahrain Iraq Kuwait
Libya Morrocco Palestine
Saudi Arabia Syrian Arab Republic United Arab Emirates
Egypt Jordan Lebanon
Mauritania Oman Qatar
Sudan Tunisia Yemen
Source: Created based on data from UNDESA, Population Division, 2014.
become a fixed part of daily life for many people in developing countries; and mobile phones
in particular have become almost ubiquitous in many countries.8 This increasing prevalence
of technology implies increasing demand for electricity, thus once again raising demand for
water resources.
All the above is definitely true for ESCWA member countries, which already face fast-growing
rates of urbanization, as can be seen in figure 2 that shows the change in the annual percentage
at mid-year of the population residing in urban areas of ESCWA member countries from 1950
to 2050. Mid-year population refers to the “arithmetic mean of the population on 1 January and
the population on 31 December of a year” and is used in the calculation of annual rates.9 The
percentage of population at mid-year residing in urban areas is, for all ESCWA member countries,
expected to reach an average value of 80 per cent by 2050 (currently, already 75 per cent of the
population in most countries is urban). In other words, by 2050, the urban population in the Middle
East and North Africa (MENA) region alone will reach approximately 560 million.10
13Developing the Capacity of ESCWA Member Countries to Address the Water and Energy Nexus for Achieving Sustainable Development Goals
Table 1. The top 33 water-stressed countries in the world by 2040
Rank Name Score (All Sectors)
1 Bahrain 5.00
1 Kuwait 5.00
1 Qatar 5.00
1 San Marino 5.00
1 Singapore 5.00
1 United Arab Emirates 5.00
1 Palestine 5.00
8 Israel 5.00
9 Saudi Arabia 4.99
10 Oman 4.97
11 Lebanon 4.97
12 Kyrgyzstan 4.93
13 Iran 4.91
14 Jordan 4.86
15 Libya 4.77
16 Yemen 4.74
17 Macedonia 4.70
18 Azerbaijan 4.69
19 Morocco 4.68
20 Kazakhstan 4.66
21 Iraq 4.66
22 Armenia 4.60
23 Pakistan 4.48
24 Chile 4.45
25 Syrian Arab Republic 4.44
26 Turkmenistan 4.30
27 Turkey 4.27
28 Greece 4.23
29 Uzbekistan 4.19
30 Algeria 4.17
31 Afghanistan 4.12
32 Spain 4.07
33 Tunisia 4.06
Note: “5.00” is the highest stress score possible.
Source: Created based on data from Maddocks, Young and Reig, 2015.
14Water-Energy Nexus Operational Toolkit Resource Efficiency Module
Similarly, water and energy demand in ESCWA member countries is quite high, in addition to
these countries having scarce water resources. The situation is only expected to deteriorate as
demand levels increase. For the MENA region, water shortages are projected to increase by 43
km3/year from 2001–2010 to 2041–2050, even under the most positive climate scenarios.11 Table
1 shows the forecasted list of top 33 water-stressed countries in 2040. Water stress is defined as
the “ratio of total annual water withdrawals to total available annual renewable supply”.12 Five of
the eight countries with the highest predicted stress level are ESCWA countries; and 15 of the 18
ESCWA member countries (highlighted in table 1) are included in the list.
Table 1 is further supported by Figure 3 , which shows both actual and forecasted levels of
unmet water demand in certain ESCWA member countries. The forecasted values have been
obtained as a result of an average climate projection model.13 In all countries, the percentage
of unmet demand is rising consistently. With respect to the MENA region as a whole, from
2001-2010 until 2041-2050, this increase in unmet demand is due to an increase in demand by
about 50 per cent while supply will only increase by 12 per cent (as per the average climate
change projection).14 In some cases, such as Oman, the rise in unmet demand is expected to
be drastic. As regards the connection between the water-energy nexus and climate change,
increased water use means increased energy demand, which leads to more greenhouse gas
emissions. The latter, in turn, contributes to elevated earth temperatures and consequently to
greater water use and the vicious cycle continues.
In terms of energy consumption, as an example, the countries of the Gulf Cooperation Council
(GCC) are expected to see an increase in energy consumption of more than 200 per cent from
2000 to 2020.15 Additionally, by 2040, total energy consumption in the Middle East and Africa is
expected to increase to 61.8 quadrillion Btu and 44.0 quadrillion Btu, respectively. These values
represent average annual percentage increases in energy consumption from 2012 to 2040 of
Figure 3. Unmet water demand in selected ESCWA member countries (percentage)
Percentage of Unmet Demand
120
100
Percentage (%)
80
60
40
20
0
Bahrain
Egypt
Iraq
Jordan
Kuwait
Lebanon
Libya
Morocco
Oman
Palestine
Qatar
Saudi Arabia
Syrian Arab
Republic
Tunisia
United Arab
Emirates
Yemen
2000-2009 2020-2030 2040-2050
Source: Created based on data from Immerzeel et al., 2011.
15Developing the Capacity of ESCWA Member Countries to Address the Water and Energy Nexus for Achieving Sustainable Development Goals
2.4 and 2.6 per cent for the Middle East and Africa, respectively. These values are significantly
higher than the forecasted average annual percentage increase in energy consumption for the
world for the same period, which is only 1.4 per cent.16 Therefore, this greater increase in energy
consumption for the MENA region, as compared to corresponding values for other regions of the
world, points out how important the improvement of energy efficiency is for the countries of the
ESCWA region.
Water and energy efficiency are therefore key to a water and energy-secure future for the countries
of the ESCWA region. The Middle East is already considered by some to be the least water-secure
region in the world17 and with such phenomena as global warming and climate change taking
place, the situation will definitely not improve on its own. Furthermore, when considering water
and energy, securing one depends on the other; and both water and energy efficiency must be
pursued simultaneously through a holistic water-energy nexus approach.
The water-energy nexus was presented in figure 1. However, it encompasses several subtopics,
some of which are shown in detail in figures 4 and 5. Figure 4 shows the problem/opportunity spaces
faced while using water for energy production while figure 5 shows the problem/opportunity spaces
in energy issues for and caused by water.These spaces have been grouped in terms of different
technological types (in the case of figure 4) and different process types (in the case of figure 5).The
strategies mentioned in figures 4 and 5 not only address technologies/processes that are already
being widely implemented by the global water and energy sectors, but also mention technologies
that are in their infant stages of commercial implementation.This toolkit focuses primarily on the
better established technologies as they have greater relevance to ESCWA member countries due to
their particular climatic conditions and the industries, which these countries tend to have.
Figure 4. Representative problem/opportunity spaces in water for energy
Waste Heat Recovery Alternative Fluids
Thermoelectric Generation, Supercritical CO2 RCBC, Drilling and Fracturing, Geothermal Shearing,
Printed Circuit Heat Exchangers Geothermal Working, Non-Steam Power Cycles
Advanced Materials
Thermoelectirc Materials, Heat-driven State
Changes, Scaling/Fouling Resistance,
Temperature and Pressure Tolerance,
Carbon Capture
Cooling Technologies Process Efficiency
Air Flow Designs, Water Recovery, Bioenergy Feedstocks, Process Water Reduction,
Blowdown Treatment, Hybrid Wet/Dry Systems, Wastewater Recycling, Advanced Carbon Capture
Alternative Cooling Systems
Source: Created based on data from Bauer et al., 2014.
16Water-Energy Nexus Operational Toolkit Resource Efficiency Module
Figure 5. Representative problem/opportunity spaces in energy for and from water
Applications
Thermoelectric Cooling,
Irrigation, Industrial Uses,
Drinking Water, Hydraulic
Fracturing, Energy Storage
Wastewater Treatment
Anaerobic membrane
Bioreadtors, Thermal Hydrolysis,
Annamox processes, UV LED disinfection
Non-Traditional Sources
Oil & Gas Produced Waters, Water from Carbon Sequestration,
Brakish Groundwaters, Municipal Wastewaters, Desalination Brines, Seawater
Desalination
Resource Recovery
Membrane Distilation,
Forward Osmosis, Fuel Cells, Algal Bioenergy,
Dewvaporation, Nano Biosolids, Inorganics,
Membranes, Capacitive Energy, Produced Waters,
Deionization, Hybrid Systems Gas Cleanup
Source: Created based on data from Bauer et al., 2014.
Objectives
The primary objective of this toolkit is to strengthen the capacity of ESCWA member countries
to achieve an integrated and sustainable management of water and energy resources, thereby
contributing to sustainable development. This toolkit focuses on improving the technical capacity
of government officials who manage or oversee the provision of water or energy services in
ESCWA member countries. It provides them with technological strategies by means of which they
can integrate water and energy nexus considerations into their operations, activities, and projects.
Though the nexus is governed through an institutional or policy response,18 its
implementation relies on technical interventions, which may render the process and resource
17Developing the Capacity of ESCWA Member Countries to Address the Water and Energy Nexus for Achieving Sustainable Development Goals
Ain Beni Mathar Integrated Thermo Solar Combined Cycle Power Plant, Morocco © Philippe Roos - https://www.flickr.com
use more efficient and effective.19 The successful implementation of these technologies is
only possible through access to comprehensive information about the technological options
available so that more informed decision-making can take place. It is this toolkit, which aims to
provide this information.
The current water-energy nexus operational toolkit aims to assist in building capacity for
exchange and collaboration across disciplines based on a common language and set of
assessment tools, techniques, and indicators for pursuing resource efficiency at the operational
level, for instance during investment planning, the operation and maintenance of water and
energy utilities, and irrigation schemes. It contains guidelines for the entities responsible for
water and energy services, and reviews and reinforces appropriate data collection procedures
to monitor energy and water production. All of these findings and analyses are based on
consumption statistics reflecting the water and energy cycles. Consequently, the toolkit
describes the key performance indicators used in the water and energy industries. After all, it
is such statistics obtained through the monitoring of consumption patterns and the resulting
analysis using established indicators, which enable long-term planning and a more efficient
management of national natural resources. For this planning to be effective, the collected data
and statistics must be sufficient to allow the strengthening of analytical capacity, thus facilitating
evidence-based policymaking and policy assessment in the interrelated fields of water and
energy. Consequently, this toolkit seeks to provide steps, which may be followed to ensure the
robustness of data monitoring and collection procedures.
Technologies to improve water efficiency
When considering water efficiency improvement strategies, the approach being implemented
can broadly be classified into two categories: One focuses on using technologies, which operate
more efficiently and the second focuses on water reuse so that a smaller footprint is achieved
even with regular process efficiencies. It must be noted here that there is a difference between
water treatment and water reuse. Water treatment ensures that the output water can be returned
to the environment. For water reuse, the treated water must be purified to such a level that it can
be used in industry, agriculture, and even as potable drinking water.20 Table 2 shows the different
sectors where water can be reused, along with the particular type of use in each sector. For each
reuse category, the water treatment needed is also shown. The more sensitive/critical the area of
reuse, the more elaborate the treatment required to obtain a product of greater purity.
18Water-Energy Nexus Operational Toolkit Resource Efficiency Module
Table 2. End use of recycled water and minimum treatment
Reuse Category Description Treatment
Urban Reuse Unrestricted Secondary, Filtration, Disinfection
Restricted Secondary, Disinfection
Agricultural Food Crops Secondary, Filtration, Disinfection
Reuse Processes Food Crops Secondary, Disinfection
Non-food Crops Secondary, Disinfection
Impoundments Unrestricted Secondary, Filtration, Disinfection
Restricted Secondary, Disinfection
Reuse Category Description Treatment
Environmental Create wetlands, enhance natural Secondary, Disinfection
Reuse wetlands, sustain stream flow
Industrial Reuse Once-Through Cooling Secondary
Recirculating Cooling Towers Secondary, Disinfection (coagulation &
filtration could be needed)
High-Quality Industrial Use Secondary, Filtration, Advanced
Wastewater Treatment, Disinfection
Groundwater Non-Potable Reuse, Spreading Primary
Recharge Non-Potable Reuse, Injection Secondary, Soil Aquifer Treatment
Indirect Potable Groundwater Recharge, Spreading Secondary, Filtration, Disinfection
Reuse Groundwater Recharge, Injection Secondary, Filtration, Advanced
Wastewater Treatment, Disinfection
Augmentation of Surface Water Supply Secondary, Filtration, Advance
Reservoir Wastewater Treatment, Disinfection
Source: Created based on data from Water in the West, 2013.
Water efficiency in electricity production processes
Figure 6 shows the flow diagram on how water is used in the electricity production process.
It is clear that water is needed as part of almost every step in the process, and this water
requirement is essential for all conventional fuels. To illustrate the extent of the relationship
between water use and electricity production, according to certain global statistics, 90
per cent of power generation is water-intensive and three quarters of all industrial water
withdrawals are used for power production. Additionally, 80 per cent of global energy
is produced by thermal power generation, which is responsible for 50 per cent of all
water withdrawals in the United States and several European countries.21 In fact, energy
production accounts for the second largest use of water (after agriculture) and is expected
to continue increasing over the next 15-20 years.22 As a result, there is much to gain from
improved water efficiency in the power sector. This is particularly true for the ESCWA
member countries where improved water efficiencies would mean greater abilities to meet
the water demand.
19Developing the Capacity of ESCWA Member Countries to Address the Water and Energy Nexus for Achieving Sustainable Development Goals
Figure 6. Flow chart of embedded water in energy
Discharge Water
Water Resource Energy Recycling
Resource
(e.g., lakes, rivers, Cogeneration,
aquifiers, sea) desalination
End Use
Extraction Raw Material Transport and Industrial
Refining Transmission Energy Commercial
Mining, drilling Coal, petrol, Generation Residential
(oil, natural gas) Natural gas, Pipelines, Public Utilities
Biomass uranium, biofuels waterways Transportation
Wastewater
Renewable Energy
Collection, treatment and
discharge or reuse Wind, solar,
hydroelectric, tidal
Transportation Fuels, Natural Gas
Source: Water in the West, 2013.
Figure 7. Gaps in meeting water demands of thermal power plants under low flow
conditions
Note: Green dots indicate a value of 0.5-1.0 for the ratio of cooling water consumption to Q90, while red dots indicate a ratio greater than 1.0.
Source: http://wef-conference.gwsp.org/fileadmin/documents_news/understanding_the_nexus.pdf
20Water-Energy Nexus Operational Toolkit Resource Efficiency Module
Figure 7 illustrates where the water demands of thermal power plants cannot be met under
low flow conditions. Low flow conditions are defined in terms of Q90, which is a “flow static
representing the daily flow, which is exceeded or equalled 90 per cent of the time” and can be
used to determine the resources available in periods of low flow or drought”.23 In the case of
figure 7, in particular, the gap has been determined by the ratio of cooling water consumption
to Q90. Green dots indicate a ratio of 0.5-1.0 while red dots indicate a ratio greater than 1.0,
demonstrating that the demand cannot be satisfied. Even a cursory glance at figure 7 is
enough to see the large number of red dots in the ESCWA region, depicting the challenges
faced by thermal power plants in the region, and the situation is only expected to worsen with
time unless newer optimization methods are used to improve water efficiency.
In the past, water was regarded as a low-cost resource to electricity production facilities and
was used inefficiently. However, due to the rising standards and costs of wastewater treatment
and the rising costs of water resources as they become scarcer in many regions, awareness
has increased and a proactive approach is increasingly followed where water efficiency is
concerned. Table 3 shows the amount of water needed in the energy production process
for conventional sources of energy. Crude oil production can consist of up to three different
phases: the primary recovery phase, involving the use of the natural pressure of the reservoir
or gravity to drive oil into the wellbore (the drilled hole of the well), along with artificial lift
techniques (for instance pumps) that assist in bringing the oil to the surface; the secondary
recovery phase, where oil or gas is injected into the ground to displace the oil and drive it
into the wellbore; and the tertiary phase, also known as enhanced oil recovery (EOR), using
further techniques in order to extract even more oil. Primary recovery accounts for extracting
about only 10 per cent of the resources of an oil field, secondary recovery for 20-40 per cent,
and EOR for 30-60 per cent.24 For bitumen, steam-assisted gravity drainage (SAGD) and cyclic
steam stimulation (CCS) are similarly used to achieve enhanced oil recovery. It is clear that, at
succeeding stages of oil recovery, water requirements tend to increase.
Table 3. Water coefficients in primary energy production
Energy Source Water coefficient (m3/TJ)
Crude oil Primary recovery 6
Secondary recovery 600
Bitumen Mining 26
In situ SAGD 8
In situ CSS 14
In situ multi-scheme 32
Heavy oil 14
Natural gas 6
liquids
Coal-to-liquids 53
Source: Created based on data from Xylem, 2014.
21Developing the Capacity of ESCWA Member Countries to Address the Water and Energy Nexus for Achieving Sustainable Development Goals
Water efficiency and cooling processes
Among the different applications for which water is used in a power plant, cooling entails the
greatest water consumption. According to a publication on raw water usage for various fossil
fuel plants, water used for cooling ranged from 79 to 99 per cent of total water usage; the
remaining water was used for such applications as ash handling, the humidifier, the condenser
and flue-gas desulfurization (FGD) at combustion-steam plants.25 As a result, to make the
electricity production process more water efficient, its cooling procedure must be improved.
There are various types of cooling, as mentioned in tables 4 and 5. Two of these cooling
systems are depicted in figure 8. The closed-loop cooling system is also known as the
recirculating system. The wet cooling tower is a type of recirculating cooling system
commonly used in power plants. Table 4 shows the impact of each of these cooling systems
in terms of various factors, such as water use and costs. Table 5 numerically describes the
water use impact mentioned in table 4 for different types of power plants. It is important to
note the difference between water withdrawal and water consumption. Water withdrawal
refers to the amount of water, which is taken by the power plant from its water source
(ocean, aquifer, and others), while consumption refers to the water, which is lost, usually
due to evaporation as part of the cooling process, from the water withdrawn. As a result, the
water discharged back to the water source is the difference between the water withdrawn
and the water consumed.26
As illustrated by table 4, the once-through cooling system is intense in terms of the water
it withdraws but is moderate in terms of the water it consumes and vice versa for the
recirculating system. However, if we look at the numerical values in table 5, it is clear that,
even when the recirculating system consumes much water, the intensity of consumption
is only a fraction of the intensity of the water withdrawn by the same plant when using a
once-through system. The dry-cooling system, which uses air instead of water as the cooling
Figure 8. Diagram of different cooling systems
Once-through cooling Closed-loop cooling
Steam Steam
Electricity
Energy Turbine Electricity Turbine
Process Steam Energy Steam
water Condenser Condenser
Evaporation
Warm Steam Warm Steam
cooling Cooling
Water condenses condenses
into water Water into water
Cooling Cold
Process Cooling
water Cold cooling Tower
Water
Water
Make-up Water Process
Water
River River River
Source: Kohli and Frenken, 2011.
22Water-Energy Nexus Operational Toolkit Resource Efficiency Module
medium, is clearly most efficient as far as water use is concerned but its capital cost is high,
decreasing overall plant efficiency and challenging its more widespread implementation. In
order to increase the water efficiency of electricity production process, a dry-cooling system
should be first choice, a recirculating system second choice, and a once-through cooling
system third choice. However, the system chosen for a particular plant must obviously
consider local regulations, economics, and ambient conditions.
Table 4. Cooling system tradeoffs
Cooling Description Water Water Capital Plant Ecological
Type Withdrawal Consumption Cost Efficiency Impact
Once- Takes water from Intense Moderate Low Most Intense
Through nearby sources, efficient
circulates it
through pipes
to absorb heat
from the steam
in systems called
condensers, and
discharges the
now warmer water
to the local source.
Wet Also known as Moderate Intense Moderate Efficient Moderate
Cooling wet-recirculating
Towers or closed-loop
systems. They
reuse cooling
water rather
than immediately
discharging it.
Usually, they use
cooling towers
to expose water
to ambient air.
Some of the
water evaporates
and the rest is
sent back to the
condenser in the
power plant.
Dry The ultimate heat None None High Less Low
Cooling rejection to the efficient
environment is
achieved with air-
cooled equipment
that discharges
heat directly to
the atmosphere by
heating the air.
Sources: Created based on data from Electric Power Research Institute (EPRI), 2002; Rodriguez et al., 2013; Union of Concerned Scientists, n.d.
23Developing the Capacity of ESCWA Member Countries to Address the Water and Energy Nexus for Achieving Sustainable Development Goals
Table 5. Water withdrawn and consumed for power plant cooling (in gallons of water
required per megawatt-hour of electricity produced)
Once-through Recirculating Dry-cooling
W C W C W C
Coal 20,000-50,000 100-317 500-1,200 480-1,100 N/A N/A
(conventional)
Natural gas 7,500-20,000 20-100 150-283 130-300 0-4 0-4
(combined
cycle)
Nuclear 25,000-60,000 100-400 800-2,600 600-800 N/A N/A
Note: W: withdrawal; C: consumption.
Sources: Created based on data from Macknick et al., 2012; Union of Concerned Scientists, n.d.
Increasing water efficiency through decreasing waste heat
Decreasing the waste heat generated by a power plant reduces its cooling requirements and
consequently its water requirements. This can be achieved by improving the efficiency of the
components of the power plant system and by reusing some of the heat that would otherwise
be dissipated, by having the power plants operate along with other systems, which can use
their waste heat as is the case in the following three examples:
Combined power and desalination plants: These plants are able to simultaneously produce
electricity and drinking water. They are also known as hybrid desalination plants. By
integrating thermal electricity production with desalination, such plants are able to improve
efficiency and lower the energy costs associated with the desalination process.27 Indeed, this is
important since desalination is already known to be more energy intensive than conventional
water treatment processes. Waste heat from the power plant is used as a source of heat for
the desalination process, which is typically multi-stage flash (MSF) distillation (a distillation
process where seawater is distilled by flashing it into steam in multiple stages).28 This system
is more efficient than a stand-alone power plant and a stand-alone MSF desalination plant.
Along with the substantial capital cost, a traditional disadvantage of such combined plants
is the challenge of unequal water and electricity demands, which also change according to
season. For example, during winter, electricity demand can decrease while water demand
may stay more or less the same. In such cases, the plant would end up operating at low
efficiencies. Nevertheless, for the ESCWA region, which is arid more or less all year round,
such combined plants can be a good solution.29 Some studies have claimed that it is the
most cost-effective way to meet both water and electricity requirements in desert regions.30
In the recent past, however, such hybrid plants are becoming less popular as more energy-
efficient desalination processes, such as reverse osmosis, become more prevalent. In addition,
decoupling electricity and water production allows for the introduction of renewable forms of
energy as well as nuclear energy into the overall energy mix for the region.31
Combined heat and power (CHP) plants: These plants are also known as cogeneration plants.
They take the heat that is produced in the electricity generation process and, instead of
dissipating it as waste heat, use the heat for district heating as hot water or steam. This
consequently causes a significant decrease in the cooling water requirements of the plant and
24Water-Energy Nexus Operational Toolkit Resource Efficiency Module
helps increase overall efficiency. CHP plants can be used with any type of fuel but efficiencies
vary from one fuel to another. As with the combined power and desalination plants, CHPs
efficiency can be as high as 90 per cent. One of the advantages of CHP plants is that they rely
on the combination of technologies, which are already widely used in commercial installations
globally. In order for CHP plants to achieve their highest potential efficiency, it is important
that they are located close to the site where there is demand for the heat and electricity
generated; this prevents heat losses, which take place during the transportation of the heat
and may otherwise lead to substantial decreases in overall efficiency. Consequently, CHP
plants tend to be suitable as decentralized sources of energy, though they entail greater capital
expenditure (relative to conventional power plants). However, in the long term, CHP plants
are more economical due to the energy savings they achieve, though their payback period
tends to be quite long. Last but not least, meeting heat and power demands simultaneously
by one single plant adds more complexity to the CHP plant process.32 Among ESCWA member
countries, Saudi Arabia already uses cogeneration plants: cogeneration units are already
present at the Ju’aymah, Shedgum, and ‘Uthmaniyah gas plants, and new CHP facilities are
being built at the Abqaiq, Hawiyah, and Ras Tanura facilities.33 As a result of these projects,
power capacity is expected to reach 6,500 MW in 2016.34
Increasing water efficiency using alternative water sources
This strategy for increasing water efficiency draws on the points mentioned above regarding
water reuse as well as the use of entirely new types of water, which shall help reduce
dependence on freshwater resources. For instance, non-freshwater sources such as saline
groundwater effluents,35 can be used as cooling water in thermal power plants. However, the
implementation of the use of such alternative water sources depends on the quality of the
water and its source location (for instance, the power plant must be situated on the coast if
seawater is to be used).
As concerns the reuse of water, treated wastewater also can be used as an alternative for
cooling water in thermal power plants. However, before this is possible, the pollutants in the
wastewater must be satisfactorily removed so that it does not damage the cooling system in
any way (for instance, through corrosion). Such procedures must be carried out in accordance
with local regulations, oftentimes leading to increased costs. And since many countries require
that water being discharged by power plants be pretreated until at least secondary treatment
standards, treating the same water to reusable levels for cooling purposes would not lead to
a significant cost reduction. Since wastewater is available in large quantities in most places,
especially large urban areas, treated wastewater as a source of cooling water is a reliable
water source. Treated wastewater is therefore currently used for cooling purposes in more
than fifty power plants in the United States, including the largest nuclear plant in the country,
Palo Verde in Arizona, which solely uses wastewater to fulfil its cooling requirements.36 This
potential for the use of treated wastewater also exists in ESCWA member countries. For
example, the Pearl gas-to-liquids (GTL) plant in Qatar, the largest source of GTL products in
the world, has a water recycling plant, which is the largest of its kind. It treats water, which
is then reused for cooling purposes and in steam production. This prevents any liquids from
being discharged from the plant.37
Case study: The oil and gas industry
The oil and gas industry is a very important part of the economy of many Arab countries.
Seven ESCWA member countries are members of the Organization of the Petroleum Exporting
25Developing the Capacity of ESCWA Member Countries to Address the Water and Energy Nexus for Achieving Sustainable Development Goals
Figure 9. Flow chart of oil and embedded water
End Use
Transport Transport Industrial
Oil Drilling Oil Refining Commercial
(e.g., rall, tanker, (e.g., rall, tanker, Residential
truck, pipeline) truck, pipeline) Public Utilities
Transportation
Water Produced Water Evaporation
Input Water Input
Wastewater Wastewater
Discharge - Discharge -
Direct and Direct and
Indirect Indirect
Transport
Water Water
Source A (e.g., rall, tanker, Source B
truck, pipeline)
Source: Water in the West, 2013.
Countries (OPEC) and account for the bulk of OPEC’s proven crude oil reserves.38 Even in terms
of exports, in 2014, the crude oil and natural gas exports of Arab countries accounted for more
than 40 per cent of the world’s crude oil exports and around 20 per cent of global natural
gas exports.39,40 As a result, though the oil and gas exporting countries of the ESCWA region
are making efforts to diversify their economies, as of 2012, crude petroleum and natural gas
represented 48.0 per cent while petrochemicals represented 2.9 per cent of the gross domestic
product (GDP) of the GCC.41 In addition, in the recent past, as oil prices have fallen significantly,
the economies of the oil-producing countries of the ESCWA region have been hit substantially.
Nevertheless, as mentioned by Amin H. Nasser, President and Chief Executive Officer (CEO)
of Saudi Aramco, at the recent 2016 Annual Technical Conference and Exhibition of the Society
of Petroleum Engineers in Dubai, “oil’s central position, especially in heavy transport and
petrochemicals feedstock, will remain solid and central for years to come”.42 In fact, the oil and gas
sector in the Gulf region continues to expand along with an increase in petrochemical projects.43
This expansion in energy investment is expected to reach up to $900 billion by 2021 according to
an Arab Petroleum Investments Corporation report.44 The importance of the oil and gas industry to
the ESCWA region is thus evident. Mr. Nasser also mentioned that the industry must learn how to
better deal with difficult times from the financial perspective while simultaneously continuing to
improve efficiencies.45 This toolkit seeks to facilitate the improvement of efficiencies.
Water is used in upstream oil and gas exploration and production for such purposes as
injection water for wells and the recovery of crude oil and gas.46 Indeed, water-based fluids can
be required in the wellbore drilling and stimulation stages. During the drilling of the actual well,
water-based fluid is used for various procedures, including “lubricating the drill bit, circulating
the drill cuttings out of the hole, containing formation fluids and facilitating the operation of
sophisticated formation evaluation tools”.47 The downstream segment of the oil and gas industry
includes processes related to refining and petrochemical production, and water is used mainly
to supply boilers and cooling circuits and for some oil refining processes.48 As an example of
26Water-Energy Nexus Operational Toolkit Resource Efficiency Module
Figure 10. Flow chart of natural gas and embedded water
End Use
Transport Industrial
Natural Gas Drilling Natural Gas Commercial
and Extraction Processing (e.g., pipeline, Residential
LNG ships) Public Utilities
Transportation
Water Produced
Input Water
Wastewater
Discharge -
Direct and
Indirect
Water Wastewater
Source Treatment
Source: Water in the West, 2013.
water use for drilling (which is one of the main application areas of water in the oil production
process along with oil refining), in the United States, drilling vertical wells has been reported
to use an average of 77,000 gallons of water with an additional 310,000 gallons to hydraulically
fracture the well while drilling horizontal wells was reported to use an average of 130,000
gallons with an additional 2,700,000 gallons for hydraulic fracturing.49
Natural gas tends to be liquefied to decrease its volume, thereby facilitating its transport
and storage as liquefied natural gas (LNG). As part of the liquefaction process, water is
mainly consumed for process cooling at the liquefaction plants and for revaporization
heating at LNG receiving terminals (where LNG is turned back into gas). These processes
may result in significant water discharge streams.50 Water is also required by the amine
system, which removes carbon dioxide and hydrogen sulphide from the feed gas. For this
purpose, a portion of the water requirements of the LNG plant must be met by water, which
meets specific criteria in terms of cleanliness and chemical composition.51 Though water
consumption rates for such processes can vary considerable,52 an industry benchmark of
30,000 m3 of water per hour has been specified for systems open-rack vaporizers, which use
seawater to heat and vaporize the LNG.53 This has relevance for the Arab countries where,
due to arid conditions, sea water is mainly used to meet water requirements. Since the
water requirements in the LNG plant/processes primarily feed cooling and heating systems,
especially concerning refrigeration cycles and sometimes power cycles,54 measures taken to
improve water efficiencies are assumed to be similar to those of other oil and gas processes
where water requirements due to cooling are also substantial.
Figures 9 and 10 show the flow of processes during oil and natural gas production,
respectively, and include information about the involvement of water at the different stages of
the processes, supporting what has been mentioned above. While figure 6 illustrates the water
intensity of electricity production, figures 9 and 10 prove that electricity production using oil or
natural gas as a fuel is also water intensive.
27Developing the Capacity of ESCWA Member Countries to Address the Water and Energy Nexus for Achieving Sustainable Development Goals
Hydraulic fracturing, also known as fracking, is another process through which oil and gas
resources are obtained. A high-pressure water mixture is directed at shale rock in order to
release the oil or gas, which the latter contains. Having been employed increasingly in the
recent past, fracking has attracted quite a bit of controversy due to the water use, which it
entails. Fracking has increased the competition for water in some of the most water-stressed
areas in the United States.55 Though it is certainly more water intensive than using energy
resources, such as coal and the primary recovery of oil, fracking need not always be the
most water-intensive option; the amount of water required for the fracking process can vary
significantly from one type of shale to another and from one well to another.56 Among Arab
countries, Tunisia, Egypt, Saudi Arabia, and Jordan have plans to extract shale gas, while
others, such as Oman and Algeria, have already begun fracking operations.57,58,59
Water efficiency in the oil and gas industry can be improved by better water and wastewater
management. Using trucks to transport water between different locations, such as extraction
sites and wastewater wells, can be inefficient from the cost, safety, and environmental
perspectives. Such processes may be improved by using pipelines, onsite treatment, and
reusing wastewater and produced water. Whether or not produced water is reused, injected
or discharged depends on various factors, such as geology, location, field maturity, location,
available technologies, the relevant economics, and even environmental and social factors.
Along the same lines, the particular technology used for water treatment depends on
several factors. Table A1 in the annex provides a comprehensive reference of advantages,
disadvantages, and applicability of different water treatment technologies in the oil
and gas industry.
Once a plant starts reusing produced water, operations are facilitated through, for example,
the implementation of remote monitoring and control systems that enable the automated
management of water resources in real time.60 What is more, recycling water can help
overcome the challenge of uncertainties in water supplies. More water-efficient systems
enhance water security and thus the overall resilience of oil and gas sector operations. They
are becoming more prevalent in the oil and gas sector as policies on water use are become
more stringent. As an example, advanced ultraviolet (UV) and ozone technologies are being
implemented to prevent wastewater from fouling. Similarly, waterless fracking, which uses
gases instead of water, is also being experimented with.61
Table 6. Water required and recovery assessment for various oil recovery technologies
Recovery Technology Injection water (gallons water per gallons crude oil)
Primary recovery 0.2
Secondary water flooding 8.6
EOR steam injection 5.4
EOR CO2 injection 13
EOR caustic injection 3.9
EOR forward combustion/air injection 1.9
EOR micellar polymer injection 343.1
Source: Created based on data from Xylem, 201
28Water-Energy Nexus Operational Toolkit Resource Efficiency Module
EOR: The primary, secondary, and tertiary recovery of oil has already been discussed.
Table 6 goes into more detail by providing information on the quantities of water required
by different types of EOR (tertiary recovery) processes. Clearly, primary recovery is least
energy intensive. Even though tertiary recovery is known to be water-intensive, it can be,
in some cases, less water-intensive than secondary recovery depending on the type of
recovery selected.
EOR is broadly classified into three types: thermal recovery, gas injection, and chemical
injection. As shown in table 6, steam injection and forward combustion/air injection
are considered to be types of thermal recovery, CO2 injection is considered to be a type
of gas injection, and caustic injection and micellar polymer injection are considered to
be examples of chemical injection. All these methods of EOR mentioned in table 6 are
considered to have high values for the incremental recovery they provide. This is not
Table 7. Limitations of various EOR processes
EOR process Limitations
Miscible gas injection • Very sensitive to heterogeneity
• Poor vertical sweep owing to large density difference
from water
• Reservoir pressure must be greater than minimum
miscibility pressure
• Excess gas production
WAG injection • Operationally more complex
• Oil may be trapped in pores by water if too much water
injected
Polymer flooding • Well injectivity owing to higher viscosity of injected water
• Loss of polymer by adsorption
• Costly due to large volumes of chemicals required
• May not be feasible in hot reservoirs or with saline water
Alkaline surfactant polymer flooding • Complex to design, requiring analysis of oil, water and
rock chemistry as well as geological heterogeneity
• Costly due to large volumes of chemicals required
• May not be feasible in hot reservoirs, carbonate
reservoirs or with saline water
Low-salinity water injection • Mechanism not fully understood
• Possible dilution of injected low-salinity water by in situ
brine
Polymer gel treatments at injection • Only works where high-permeability thief zone is isolated
wells from other oil-bearing zones
• May not be feasible in hot reservoirs, carbonate
reservoirs or with saline water
• Potential production of H2S by sulphate-reducing bacteria
in reservoir
Deep reservoir flow diversion • Only works for water injection
• May not be feasible in hot reservoirs, carbonate
reservoirs or with saline water
Source: Created with data from Muggeridge et al., 2013.
29You can also read


