Reviews of Scientific Evidence and Policies on Nutrition and Physical Activity
←
→
Page content transcription
If your browser does not render page correctly, please read the page content below
Reviews of Scientific
        Evidence and Policies on
         Nutrition and Physical
                 Activity
       Objective B1: A comprehensive review of the
      scientific evidence about the source of calories
      consumed and types and frequency of physical
                  activity among Europeans

Written by ICF Consulting Services Ltd
March 2018
EUROPEAN COMMISSION
Directorate-General for Health and Food Safety
Directorate C — Public health, country knowledge, crisis management
Unit C.4— Health Determinants and international relations
E-mail: SANTE-CONSULT-C4@ec.europa.eu
European Commission
B-1049 Brussels
EUROPEAN COMMISSION

          Reviews of Scientific
        Evidence and Policies on
         Nutrition and Physical
                 Activity
       Objective B1: A comprehensive review of the
      scientific evidence about the source of calories
      consumed and types and frequency of physical
                  activity among Europeans

                    Directorate-General for Health and Food Safety
         Directorate C— Public health, country knowledge, crisis management

March, 2018                                                                   EN
Reviews of Scientific Evidence and Policies on Nutrition and Physical Activity

                         Europe Direct is a service to help you find answers
                           to your questions about the European Union.
                                        Freephone number (*):

                                    00 800 6 7 8 9 10 11
(*)    The information given is free, as are most calls (though some operators, phone boxes or hotels
may charge you).

LEGAL NOTICE
This document has been prepared for the European Commission however, it reflects the views only of the
authors, and the Commission cannot be held responsible for any use, which may be made of the information
contained therein.
More information on the European Union is available on the Internet (http://www.europa.eu).
Luxembourg: Publications Office of the European Union, 2018

ISBN 978-92-79-97425-0            DOI 10.2875/586086                 EW-06-18-318-EN-N

© European Union, 2018

Reproduction is authorised provided the source is acknowledged.
Reviews of Scientific Evidence and Policies on Nutrition and Physical Activity

Contents
Contents .......................................................................................................... v
Preface..................................................................Error! Bookmark not defined.
    About this project ................................................... Error! Bookmark not defined.
    About this series ..................................................... Error! Bookmark not defined.
    Approach and purpose ............................................. Error! Bookmark not defined.
Glossary ........................................................................................................... 3
Objective B1: A comprehensive review of the scientific evidence about the source of
calories consumed and types and frequency of physical activity among Europeans ... 6
1 Introduction ................................................................................................ 6
    1.1     Scope of this review ................................................................................... 6
    1.2     Research questions .................................................................................... 6
2     Methodology ............................................................................................... 8
    2.1     Peer reviewed method ................................................................................ 8
    2.2     Grey literature method ............................................................................... 8
3     Findings and discussion ................................................................................ 9
    3.1     Introduction to Research Questions 1 and 2 .................................................. 9
    3.2     Research Question 1: What and how much do Europeans eat and drink, what
    kinds   of food groups are more relevant and what trends are noticeable?...................11
    3.3     Research Question 2: When and where do Europeans eat and drink? ..............31
    3.4     Introduction to Research Questions 3 and 4 .................................................38
    3.5     Research Question 3: How much physical activity do Europeans engage in? .....42
    3.6     Research Question 4: What types of exercise are Europeans engaging in? .......57
4 Conclusion .................................................................................................64
Annex 1  Peer-reviewed literature review methodology .......................................66
    A1.1        Research questions for this review ..........................................................66
    A1.2        Peer reviewed Literature ........................................................................66
Annex 2         Peer reviewed literature: search terms ................................................71
Annex 3         Peer reviewed literature bibliography ..................................................73
Annex 4         Grey literature review methodology ....................................................77
    A4.1     Detailed search and review methodology .................................................77
    A4.2     Stage 1: Conducting searches and documenting results .............................77
    A4.3     Stage 2: Screen Search Results for Relevance ..........................................79
    A4.4     Stage 3: Screen results against inclusion/exclusion criteria, quality and
    relevance ..........................................................................................................79
    A4.5     Stage 4: Extraction of full texts and final screening process .......................81
    A4.6     Stage 5: External expert reviews and input ..............................................81
    A4.7     Number of included and excluded references ............................................81
Annex 5         Grey literature bibliography................................................................. 1
Reviews of Scientific Evidence and Policies on Nutrition and Physical Activity
Preface
About this project
Overweight, obesity and their related diseases represent a leading cause of morbidity
and mortality, and pose a major challenge for the sustainability of healthcare systems of
EU Member States. The growing prevalence of overweight and obesity among all age
groups across Europe constitutes a serious concern for policy makers. Tackling this issue
requires a comprehensive response that reflects the multifactorial and complex nature of
obesity and overweight. One particularly important area of focus has been on the
development of preventative strategies, which include nutritional and physical activity
interventions.
The European Commission Directorate General for Health and Food Safety (DG SANTE)
recognises the significant challenges policy makers face in developing effective and
efficient policy interventions relating to diet and physical activity. One such challenge
includes the complexity and breadth of the evidence base. By providing independent,
accurate summaries of recent and relevant information and statistics on determinants of
diet and physical activity and their impact on health, this project aims to support policy
makers to continue to develop policy instruments, which enable people to make healthier
lifestyle choices. In particular, this project aims to support the development of healthier
behaviours in vulnerable and/or at-risk subpopulations (including children, pregnant and
lactating women, and older adults) and low socio-economic status groups (including low
income and education).
About this series
This evidence review is one of eight reviews relating to different determinants of diet and
physical activity.
Seven of the reviews are of the scientific evidence and policies in the following areas:
Knowledge, attitudes and behaviours contributing to positive energy balance
(objective area A1);
Dietary and physical activity patterns in Europe (objective area B1);
Consumption of fruit juices, artificially and sugar-sweetened beverages and its
impact on weight status and health (objective area B2);
Consumption of high-fructose syrup and its impact on weight status and health
(objective area B3);
Relationship between weight status and physical activity with school and work
performance outcomes (objective area C);
Early warning indicators of obesity and physical inactivity trends (objective area
D);
Nutrition and physical activity guidelines for specific population groups (objective
area E).
Building on these seven reviews, the final review (objective area A2) examines
specifically the evidence for effective and efficient policies and interventions in terms of
promoting, supporting and improving nutritional and physical activity behaviours at both
individual and population level.
All reviews, and their summaries, are available on the DG SANTE webpage here.
Approach and purpose
The reviews have been designed to provide policymakers with summaries of recent and
relevant evidence in these key areas of interest. Given the broad scope of each of the
reviews, it should be stressed that they are not intended to be rigorous systematic
reviews of all literature published in this field. Rather, they are intended as pragmatic
1
Reviews of Scientific Evidence and Policies on Nutrition and Physical Activity

reviews combining a comprehensive search methodology with expert academic input,
facilitated through workshops, to provide a practical and accurate summary of key issues
and tackling broad lines of enquiry, with the greater aim of supporting the development
and improvement of policies in this area. Each of the project's eight methodologies and
analyses was reviewed by DG SANTE and academic experts in these topics.
While the methods to conduct this comprehensive literature review are systematic, it is
not a systematic review. This review does not systematically analyse literature to identify
all relevant published data and/or appraise its quality. Methods to conduct the literature
review consisted of five steps: (1) refining the research questions, (2) developing a
search approach and databases, (3) conducting literature searches, (4) screening articles
for inclusion; and (5) abstracting and synthesising relevant data.
To minimise bias, the literature search approach included identification of a priori search
parameters (also considered first level inclusion and exclusion criteria), agreed with DG
SANTE, to guide searches and inform screening and selection processes for data
inclusion. Due to the immense number of literature search results at step 3, the
application of quite limiting exclusion criteria at step 4 was deemed necessary. This may
however have resulted in not screening all potentially relevant literature. All relevant
articles that were found appropriate for inclusion were reviewed for relevance to each
objective area, and the scope of the specific research questions. Furthermore, the
inclusion of different types of scientific evidence (from systematic reviews and peer-
reviewed original articles down to BSc theses) and the presentation of this scientific
evidence next to grey literature information presented a challenge in terms of
maintaining an understanding of the quality and weight of the evidence. The authors
addressed this to some extent by structuring the document in such a way that peer-
reviewed and grey literature are clearly identified. The full methodology and steps taken
for each review is included in Annex of this document.
DG SANTE and the Joint Research Centre (JRC) provided input on all stages of the
project and comments on the literature reviews. Expert workshops were organised to
discuss findings, highlight additional relevant sources to fill gaps and improve the series
of reviews. Experts were carefully selected from academic and policy-making fields,
based on expertise of the specific topics addressed.
The methodology used across all eight reviews remained consistent, and within each
review a detailed summary of the approach is provided, along with a full bibliography for
further reading.

                                                                                              2
Reviews of Scientific Evidence and Policies on Nutrition and Physical Activity
Glossary
The following definitions are common definitions that are used across all eight objective
areas. Where a study uses a different definition, this will be highlighted on an individual
basis in the review.
Table 1. Definitions of terms used across the reviews
Term Definition Source
Adult obesity An abnormal or excessive World Health
fat accumulation that Organisation (WHO)
presents a risk to health, (http://www.who.int/topi
with a BMI of 30 or more. cs/obesity/en/)
Adult overweight An abnormal or excessive WHO
fat accumulation that
(http://www.who.int/topi
presents a risk to health,
cs/obesity/en/)
with a BMI equal to or
more than 25.
Alcopops Pre-mixed beverages 1. Anderson, P.,
containing a spirit, wine Suhrcke, M. and
or malt combined with a Brookes, C. (2012)
non-alcoholic drink. An overview of the
market for alcohol
beverages of
potentially
particular appeal to
minors. London:
HAPI.
Artificially sweetened Beverages sweetened ICF definition based on all
beverages (ASBs) with low-calorie or zero- literature identified in
calories sweeteners such objective area B2
as sucralose, aspartame, literature review
saccharin, stevia or sugar
alcohols.
Body Mass Index A person’s weight (in WHO
kilograms) divided by the
(http://apps.who.int/bmi/
square of his or her
index.jsp?introPage=intro
height (in metres).
_3.html)
Child/adolescent obesity There are different WHO
systems available to
http://www.who.int/medi
measure child or
acentre/factsheets/fs311/
adolescent obesity
en/
for different ages.
Children under 5
obesity is weight- (Other definitions are
for-height greater available for different
than 3 standard national and international
deviations above systems).
WHO Child Growth
Standards median;
3Reviews of Scientific Evidence and Policies on Nutrition and Physical Activity
Term Definition Source
Children aged 5-19
overweight is BMI-
for-age greater than
2 standard
deviation above the
WHO Growth
Reference median.
Child/adolescent There are different WHO
overweight systems available to
http://www.who.int/medi
measure child or
acentre/factsheets/fs311/
adolescent overweight for
en/
different ages.
Children under 5 (Other definitions are
overweight is available for different
weight-for-height national and international
greater than 2 systems).
standard deviations
above WHO Child
Growth Standards
median;
Children aged 5-19
overweight is BMI-
for-age greater than
1 standard
deviation above the
WHO Growth
Reference median.
Exercise Exercise, is a subcategory WHO
of physical activity that is
(http://www.who.int/diet
planned, structured,
physicalactivity/pa/en/)
repetitive, and purposeful
in the sense that the
improvement or
maintenance of one or
more components of
physical fitness is the
objective.
Insufficient physical Physical activity that does WHO
activity not meet WHO
http://www.who.int/medi
recommended levels of at
acentre/factsheets/fs385/
least 60 minutes a day of
en/
moderate-vigorous
activity for children and
adolescents and at least
150 minutes of
moderate-intensity
aerobic physical activity
throughout the week for
4Reviews of Scientific Evidence and Policies on Nutrition and Physical Activity
Term Definition Source
adults.
Physical activity Any bodily movement WHO
produced by skeletal
(http://www.who.int/topi
muscles that requires
cs/physical_activity/en/)
energy expenditure.
Physical inactivity A lack of physical activity WHO
(http://www.who.int/diet
physicalactivity/pa/en/)
Sedentary behaviour Any waking behaviour Tremblay, M. S., et al.
characterized by an (2017). Sedentary
energy Behavior Research
expenditure ≤1.5 metabo Network (SBRN) –
lic equivalents (METs) Terminology Consensus
while in a sitting or Project process and
reclining posture. outcome. The
International Journal of
Behavioral Nutrition and
Physical Activity, 14, 75.
http://doi.org/10.1186/s
12966-017-0525-8
Sugar sweetened Any beverage with added US Department of
beverages (SSBs) sugars. This includes soft Agriculture. 2010. US
drinks, soda, fruit drinks, Department of Health and
punch, sports drinks, Human Services. Dietary
sweetened tea and coffee guidelines for Americans,
drinks, energy drinks and 2010. 7th edition,
sweetened milk. These Washington (DC): US
beverages may be Government Printing
sweetened with added Office
sugars such as sucrose
(table sugar) or high
fructose corn syrup,
which is what
distinguishes them from
100% fruit juice and
beverages with non-
caloric sweeteners (e.g.,
aspartame, saccharin or
sucralose).
5Reviews of Scientific Evidence and Policies on Nutrition and Physical Activity
Objective B1: A comprehensive review of the scientific evidence
about the source of calories consumed and types and frequency of
physical activity among Europeans
This report presents a comprehensive review of the scientific literature about dietary and
physical activity behaviours among Europeans. Specifically, the sources of calories
consumed and the types and frequency of physical activity. The review is structured by
the following sections:
Introduction, describing the relevance of this topic, the scope of the reviews, the
principal research questions; and the methodology.
Findings from the peer reviewed and grey literature, and a discussion presented
according to each research question;
Conclusions drawn from the reviews overall and an assessment of the current
scientific evidence, including any gaps in the knowledge.
1 Introduction
This review aims to capture current consumption and physical activity levels in Europe,
whilst comparing how these have changed over time. In order to carry out this review,
guidelines have been used to provide a rough benchmark for comparison. However, this
report does not make any judgements or inferences on the health consequences of these
trends as both national as well as population-based guidelines vary considerably for
Europeans.
Additionally, this review considers research on dietary and physical activity habits
separately. Whilst recognising that the link between the two is important in discussions
about weight status and obesity, this review is intended to provide a high-level overview
of current practices among Europeans and not to comment on overall energy balance (as
examined in a separate review, Objective A1). Nonetheless, the information provided
here remains valuable in identifying areas in which the EU can focus its policies and
guidelines.
1.1 Scope of this review
To ensure the most relevant sources were reviewed, we:
Focused on studies and reports with the most recent data (published after 2004,
unless stated) and excluded studies and reports with (older) data less relevant to
the situation today;
Did not exclusively focus our search on high fructose corn syrup or sugar
sweetened beverages (SSBs) as related literature was the focus of Objective B3
and Objective B2 reports, respectively; however findings from the current review
include SSBs or sugar when it was one of the food groups assessed; and
Did not search for food expenditure, purchasing or availability data, unless there
was a lack of information about consumption patterns.
1.2 Research questions
In this review, we focus on the most current literature (peer reviewed research and
systematic reviews, as well as grey literature) on dietary and physical activity behaviours
among Europeans with the goal of answering the research questions listed below.
Research questions are grouped by those relating to dietary and consumption habits
(questions 1 and 2) and by those relating to physical activity (questions 3 and 4):
6Reviews of Scientific Evidence and Policies on Nutrition and Physical Activity
What and how much do Europeans eat and drink, what kinds of food groups are
more relevant and what trends are noticeable?
When and where do Europeans eat and drink?
How much physical activity do Europeans engage in?
What types of exercises are Europeans engaging in?
7Reviews of Scientific Evidence and Policies on Nutrition and Physical Activity
2 Methodology
The review is based primarily on peer reviewed literature (which is prioritised), with grey
literature used to supplement any gaps (but treated with caution and the strength of the
evidence assessed). Given the types of questions addressed in this review, publicly
available datasets which were commonly referenced in both literature searches were
analysed further to identify additional trends and patterns – when relevant, this analysis
is presented alongside the findings from the literature review. For each set of literature
specific search terms and inclusion and exclusion criteria were used; and quality checks
undertaken. The research questions and search terms were confirmed with DG SANTE at
the start of, and then refined during a review point within, the process.
After the initial searching and extraction of literature, drafts were provided to DG SANTE
and the Joint Research Centre (JRC) for review. Expert workshops (with experts from
relevant academic and policy-making fields) were then held to discuss findings and
highlight any additional sources to fill gaps, in order to improve the series of reviews. The
final outputs of the study (‘the reviews’ as presented here for B1) were then reviewed by
a topic expert at the University of Birmingham.
While the methods to conduct this comprehensive literature review are systematic it is
not a systematic review. More information on the methodology can be found in the
Annexes.
2.1 Peer reviewed method
To search for and extract the most relevant peer reviewed literature the following steps
were taken: refining the research questions; developing a search approach and
databases; conducting literature searches; screening articles for inclusion; and
abstracting and synthesizing relevant data.
A total of 15,468 search hits of peer reviewed literature were initially retrieved using
selected search terms per research question. A total of 15,468 duplicates were found and
removed from the search hits resulting in 14,325 search results as for B1. From these,
the team aimed to screen 200 of the most recent titles and abstracts for each research
question, to create a manageable amount of material within the resources for the study;
and on the premise that the most recent material was most relevant science. Where
there was a lack of relevant literature for a research question, more than 200 articles
were screened. From the 942 most recent titles and abstracts screened, 50 were deemed
of potential relevance and reviewed as full texts. From the 50 deemed relevant and
reviewed as full texts, 20 publications were selected for inclusion in the initial review. In
Stage 5, supplementary searches were conducted and/or articles recommended by
experts during the workshops were looked at and another 30 peer-reviewed publications
were included in the final review.
The full peer reviewed searching and extraction methodology is outlined in Annex 1.
2.2 Grey literature method
To search for and extract the most relevant grey literature the following steps were
taken: searching for publications using agreed keywords and databases; screening of
search results and exclusion of less relevant literature; and, extraction and review of
remaining documents. The grey literature search process was a more fluid and dynamic
process, where hand searching was also utilised to find the most relevant sources.
Details in relation to the search strategy can be found in the Annexes.
In the initial search, 190 relevant sources were identified after excluding references
based on the absence of key search terms in the title of the reference and abstract.
These 190 references were saved in the library. The second exclusion exercise,
conducted according to the set exclusion criteria and relevance to the objective’s aim,
8Reviews of Scientific Evidence and Policies on Nutrition and Physical Activity
resulted in 100 excluded references. Filtering the remaining references using a quality
checklist resulted in the exclusion of 32 references due to a lack of relevant information.
From the 90 deemed relevant and reviewed as full texts, 58 grey literature sources were
selected for inclusion in the initial review. In Stage 5, supplementary searches were
conducted and/or articles recommended by experts during the workshops were looked at
and another 20 grey literature sources were included in the final review.
The full grey literature searching and extraction methodology is outlined in Annex 4.
3 Findings and discussion
3.1 Introduction to Research Questions 1 and 2
3.1.1 Definitions and guidelines
The main focus of Research Question 1 and 2 is calorie consumption (or energy intake)
from food and drink products. Definitions and guidelines from three sources were
examined (and referenced accordingly) in order to provide contextual information, and
enable some comparison by Member States (MSs):
World Health Organisation (WHO): In 2003, the WHO produced food based dietary
guidelines for the European region, which synthesised national, government-
endorsed food-based dietary guidelines in Europe. Whilst a large proportion of
these recommendations are still relevant today, additional sources from the WHO
were also consulted, including the overview of ‘Country profiles on nutrition,
physical activity and obesity in the 28 European Union Member States of the WHO
European Region’ published in 2013.
The European Food Safety Authority (EFSA): Dietary Reference Values and
nutrition guidelines for Europe have also been published by EFSA’s Panel on
Dietetic Products, Nutrition and Allergies1.
The Food and Agriculture Association of the United Nations (FAO): The FAO
website compiles a list of up-to-date national guidelines for Europe (and beyond) 2.
These were consulted to provide examples of how and when MSs food-group
based dietary guidelines differed, or how far they converged with WHO or EFSA
recommendations.
3.1.2 Search results
Overall, the literature search revealed that almost all the data available on consumption
is self-reported, and based on methodologies such as food diaries or memory recall,
which are known to have significant inaccuracies. Additionally, as most dietary surveys
are conducted on a national basis, cross-comparison of even the most robust data
sources is difficult given diverging methodologies, sample sizes and definitions of food
groups and products.
Nonetheless, this review found that there have been multiple attempts to compile the
most recent food and drink consumption data from all MSs into one coherent database.
For example, EFSA has tried to combine national surveys in its Comprehensive European
Food Consumption Database (a descendent of the Concise European Food Consumption
Database), which makes it possible to assess (though not systematically compare) self-
reported data on food and drink intake across the EU. In the future, EFSA’s EU Menu
project will provide more harmonised and longitudinal data from MSs to more easily
1 For a full list of guidelines by nutrient or reference value, please see:
https://www.efsa.europa.eu/en/topics/topic/dietary-reference-values-and-dietary-guidelines
2 For a full list of guidelines by country, please see: http://www.fao.org/nutrition/education/food-dietary-
guidelines/regions/europe/en/
9Reviews of Scientific Evidence and Policies on Nutrition and Physical Activity
compare patterns across the European Union (EU) and the rest of Europe. Similarly, the
European Nutrition and Health Report (Elmadfa et al., 2009) provides a broad overview
of the nutrition and health situation in Europe, using available food consumption,
availability, supply and expenditure data from published and non-published sources.
Data from recent pan-European surveys (e.g. the European Health Interview Survey;
Survey of Health Ageing and Retirement in Europe; and Health Behaviour in School
Children surveys) and larger studies across multiple countries (e.g. the Survey in Europe
on Nutrition and the Elderly: a Concerted Action (SENECA) study, and the Identification
and Prevention of Dietary- and Lifestyle-induced Health Effects in Children and Infants
study) was regularly identified in both the peer reviewed and grey literature searches.
When possible, the original data was assessed or further exploited to provide additional
information for this review.
3.1.2.1 Peer reviewed literature
In total, 23 peer reviewed articles examining dietary behaviour patterns and trends
among Europeans were used to answer Research Questions 1 and 2.
To address Research Question 1, searches were conducted using terms such as food
consumption, beverage consumption, dietary, food groups, and were combined with
secondary terms such as prevalence and trend. Supplementary searches were conducted
on Google Scholar to identify further literature relevant to each of the food groups, by
specifying what they were (according to the structure of Section 3.2.4). Additional
keywords were used to find more relevant literature on specialised diets (i.e. by
specifying the Mediterranean diet) and portion sizes.
For Research Question 2, searches included terms such as eating, feeding behaviour,
meals, beverage consumption and food consumption and were combined with secondary
terms such as intervention, pattern, prevalence and trend. Supplementary searches on
Google Scholar focused on additional key words, such as “food consumption locations
Europe”, “food consumptions times Europe”, “beverage consumption locations”,
“beverage consumption times Europe” and other similar phrases, to ensure the most
relevant literature was used in this review.
3.1.2.2 Grey literature
In total, 43 grey literature articles were identified for Research Questions 1 and 2,
though importantly this number also included a few less relevant sources which provided
further information on guidelines, definitions, the historical and cultural context, etc. One
of the sources identified was the European Nutrition and Health Report (2009) which
provided a comprehensive overview of the dietary habits of Europeans by drawing on
results of multiple surveys across Europe. The grey literature search identified few other
European dietary surveys focused on calorie consumption in the European Union (other
than those identified in the peer-reviewed literature search), but the search did provide a
rich source of information at the national level, particularly on the key factors influencing
European dietary habits.
10Reviews of Scientific Evidence and Policies on Nutrition and Physical Activity
3.2 Research Question 1: What and how much do Europeans eat and
drink, what kinds of food groups are more relevant and what
trends are noticeable?
3.2.1 Section summary
This section focuses on the eating habits of Europeans by examining how many
calories Europeans consume and what types of products according to food groups
and trends in consumption patterns over time. The section starts with an overview of the
total dietary intakes among Europeans, broken down by geography and different age
groups. This is followed by a discussion of changes to the types of foods Europeans
consume, as well as an examination of consumption data by food groups and against
guidelines where possible.
Summary: What and how much do Europeans eat and drink, what
kinds of food groups are more relevant and what trends are
noticeable?
This section outlines the consumption habits of Europeans. Overall:
Consumption habits appear to be changing and converging across Europe
because of several factors including individual preferences and choice, the
increased availability of food products through global food manufacturers,
and higher disposable income etc. These factors have also influenced the
amount of food and drink and that Europeans tend to consume.
On the whole, European consumption habits do not align with certain
aspects of EU or national food-based dietary guidelines. For example,
levels of consumption remain low for promoted food groups (such as fruit
and vegetables) and conversely exceed guidelines for discouraged food
groups (such as foods high in salt, fat and sugar). Differences can be
noted by age (children, adults and older adults).
The daily consumption of fruit and vegetables varies between MSs, and
data shows that the average consumption vegetables is much lower than
fruit. Consumption of vegetables, salads and fruits also increases by age,
though not among children and adolescents. There are also differences
among men and women, and by socio-economic status. Despite these
recommendations and an increase in the consumption of fruit and
vegetables in recent years, EU intake is still well below WHO
recommendations.
Bread and potatoes are important components of meals in Northern,
Central and Eastern Europe, possibly contributing to the reported
comparatively high carbohydrate intake in these regions. In spite of the
relatively high consumption of foods containing starch, high proportions of
the public do not eat wholegrain foods at all (which limits intake of dietary
fibre).
Average dairy consumption in Western Europe is equivalent to
approximately 300 kilograms (per person, per year) in milk and milk-
based products, which is up to six times greater than consumption in Asia
and Africa. However, it is reported that there is also a different among
MSs, with Scandinavian countries consuming the highest amount of dairy
produce in the EU.
On average, EU citizens are recorded as consuming roughly 68.3kg per
capita of meat (excluding fish) per year– this is more than the world
average but less than North America. However, data reported shows that
11Reviews of Scientific Evidence and Policies on Nutrition and Physical Activity
fish and seafood consumption in the EU has increased by a greater
percentage (13%) than average meat consumption over the same period
(1995 - 2011). The consumption of meat, fish and eggs varies among
MSs, and there is an increased focus on non-animal food products which
can replace the consumption of meat, fish and eggs for protein.
Data suggests that European countries still eat too much saturated fat,
with consumption levels on average 40% higher than the maximum
recommended by WHO guidelines. Sugar intake is highest amongst
individuals living in Eastern European countries (Latvia and Lithuania) and
tends to be lowest among the EU-15 countries. Salt intake among
Europeans also remains high, with nearly all countries exceeding the 5g
target in the EU.
Research gaps still exist. Whilst there is a large amount of high-quality
and relevant data on the consumption of fruit and vegetables, further
research is required in order to make the same assessments for all food
groups.
3.2.2 How much do Europeans eat and drink?
This section presents an overview of the amount that Europeans eat and drink, by
considering two measurements: energy intake (i.e. calories consumed) and portion size.
This section uses available data to describe the average consumption patterns of
Europeans, and does not make judgements about the health consequences of particular
diets, energy intakes or portion sizes.
Importantly, consumption can fluctuate daily and for a number of reasons, such as when
socialising or on holiday periods/occasions. Additionally, consumption may be higher
among groups that have a higher energy expenditure such as sportspersons.
3.2.2.1 Energy intake
How much Europeans eat and drink a day is likely to be influenced by daily energy intake
recommendations. Although these vary between countries, the average recommended
intake is around 2,500 and 2,000 kcal for men and women (respectively) engaged in
moderate amounts of daily physical activity (corresponding to a physical activity level of
1.60) (Public Health Evaluation and Impact Assessment Consortium, 2013). However,
estimates by the Food and Agriculture Organisation of the United Nations (FAO) for the
European Union (EU) indicate that average dietary energy supply is closer to 3,500 kcal/
person/day (3,416 kcal in 2011, though actual food intake will be lower due to factors
such as food wastage and mismanagement3 (Eurostat 2011, PHEIAC 2013).
National authorities regularly collect data on food consumption and dietary patterns
through national and local surveys, and efforts have been made to compile and modulate
these data. In the European Nutrition and Health Report (2009), Elmadfa et al. provide
an overview of average, daily energy intake for sixteen European countries 4 by age and
3 Daily calorie supply per capita by source is easier to measure than calorie consumption, though the figure is a
slight overestimation as it includes losses through food distribution and mismanagement (i.e. binning food). Data
are based on the food balance sheets available at FAOSTAT. Data sources are primarily questionnaires, national
publications and Country visits by statisticians. Calorie supply is calculated by adding together all foodstuffs
produced in a country added to the total quantity imported (adjusted for changes to stocks) and dividing this by
the population. All major food animal and vegetable items are regarded. More information can be found in the
metadata assumptions and definitions (http://ec.europa.eu/eurostat/cache/metadata/en/t2020_rk100_esmsip.htm)
4 Austria, Belgium, Czech Republic, Denmark, Estonia, Finland, France, Germany, Hungary, Ireland, Italy,
Netherlands, Norway, Poland, Sweden and the UK (EFSA, 2008)
12Reviews of Scientific Evidence and Policies on Nutrition and Physical Activity
gender (as shown in Table 2) using data compiled by the EFSA in its Concise European
Food Consumption Database (published in 2008).
Table 2. Average daily energy intakes in mega-joules and kilocalories by age
Age group Boys/Males Girls/Females
6.2 - 11.7 MJ/day 5.5 - 10.6 MJ/day
Children
(1482 - 2796 kcal/day) (1315 - 2533 kcal/day)
9.5 and 14.5 MJ/day 6.8 and 9.7 MJ/day
Adolescents (2271 and 3466 (1625 and 2318
kcal/day) kcal/day)
8.5 – 13.9 MJ/day 6.3 and 11.4MJ
Adults (2032 and 3322 (1506 and 2725
kcal/day) kcal/day)
7.1 – 13.0 MJ/day 10.9 MJ/day
Elderly
(1697 – 3107 kcal/day) (1386 - 2605 kcal/day)
Source: Data from Elmadfa et al. (2009), ICF analysis
Findings for the elderly are consistent with data collected as part of a mixture of
longitudinal and cross-sectional research undertaken as part of the Survey in Europe on
Nutrition and the Elderly: a Concerted Action (SENECA) study, which suggests that
dietary intake of older adults is sufficient but tends to decline with age (de Groot et al.,
2004). Mealtime patterns and dietary intakes of 2,600 elderly participants from 19 towns
in 12 European countries5 were measured and differences in dietary intake were found
across Europe. In particular, energy intake varied from 7.2 MJ in Switzerland (1721 kcal)
to 10.3 MJ in Spain (2462 kcal) per day, and there was considerable variation among
MSs in regards to relative contributions of proteins, fats, carbohydrates, and alcohol to
total energy intake.
Similarly, findings for children are consistent with the results of the ‘Identification and
Prevention of Dietary- and Lifestyle-induced Health Effects in Children and Infants
(IDEFICS)’ study (covering 16,228 children aged 2-10 in Sweden, Germany, Hungary,
Italy, Cyprus, Spain, Belgium, Estonia) (Hebestreit et al. 2016). This study found that in
all countries, on average, energy intake increased with age and was higher among boys
than girls.
Finally, Elmadfa and Meyer (2015) explored patterns of water and other drink
consumption across the European Union using national data compiled in the Concise Food
Consumption Database (2008). Their analysis appears to show that in general, MS
dietary records show fluid intake in line with the recommended range of 1500-2000
mL/day. However, whilst water is the most commonly consumed beverage throughout
Europe there is some variation in what types of drinks are consumed between countries.
For example, on the one hand tap water consumption was highest in Austria, and across
Northern European countries, but Germany led in the consumption of bottled water, as
well as fruit and vegetable juices and soft drinks. Elmadfa and Meyer also found that fluid
intake varied by demographic factors such has age and gender, as well as lifestyle
factors such as physical activity and food choices.
5Participants were selected from an age- and sex-stratified sample of the inhabitants, and towns had a stable
population of 10,000 to 20,000 inhabitants.
13Reviews of Scientific Evidence and Policies on Nutrition and Physical Activity
3.2.2.2 Portion sizes and single foods
In recent decades there have been only minor changes in the amount of food consumed
in the EU (based on serial self-reported data), increasing by less than 5% from 735kg in
1970 to 770kg in 2000, per person per year (according to the EEA, 2005). However, as
most dietary data is self-reported, it is difficult to estimate and quantify portion sizes in
order to assess consumption patterns among Europeans (Souverein et al, 2011). The
ongoing EU Menu project will help to provide more harmonised food consumption data on
portion sizes, by offering financial and technical support to all 28 MSs and pre-accession
countries to produce new dietary surveys following a more coherent methodology 6. Two
pilot trials assessed the applicability of different tools and procedures for conducting pan-
European food intake surveys:
The PILOT-PANEU project (2010-2013), which consisted of two non-consecutive
24 hour recalls, involved 1157 participants in five European countries (Bulgaria,
Finland, Greece, Hungary, and Portugal). The International Agency for Research
on Cancer (2013) report that there were differences in the number of single foods
eaten per day; the highest number was reported in Finland (approximately 23 per
day) and the lowest in Bulgaria (approximately 13 per day).
As stated by EFSA (2012), the ‘Pilot Study for the Assessment of Nutrient intake
and food Consumption Among Kids in Europe’ (PANCAKE 7), was a trial of the EU
Menu approach for children aged 0-10 years in Belgium and the Czech Republic.
One objective of the PANCAKE project was to develop an age-specific picture book
that ensures the best possible results in estimating portion sizes for children.
Combined results of both dietary assessment methods indicated that the most
commonly referenced pictures by all participants in Belgium and the Czech
Republic were those of butter (on bread, and in cubes), cheese on bread, and
boiled potatoes.
3.2.3 What do Europeans eat and drink?
This section provides an overview of changes to European eating and drinking habits,
caused largely by the availability of new products and the increasing popularity of
specialised diets. These trends are important as changes to what Europeans consume
have consequences for diet and health status in terms of energy and nutrient intake.
Furthermore, there is also an implication for expenditure on food, when a larger share of
income is spent on high value, specialised or processed produce (Regmi et al, 2002 cited
in Fulponi, 2009).
It is important to note that though this review primarily focuses on consumption
patterns, food supply and availability data can also be used to assess dietary patterns.
Examples of research studies that have employed the ‘food availability’ measure include
Balanza et al. (2007) who used data from Food Balance Sheets (FAO) to examine trends
in food availability for three different European regions8, between 1961-1963 and 1998-
2000. Their analysis revealed an overall increase in the total energy available per capita
per day for each European region, with a specific increase in the percentage of energy
from fats; and a decrease in the percentage of energy from carbohydrates.
6 Results were not publically available for the EU MENU project at the time of this review
7 This pilot specifically examined the usefulness of two, alternative dietary record methods: a 3-day food diary
checked by a parent, and two consecutive 1-day food diaries followed by a GloboDiet completion interview. The
two methods of assessment involved 103 and 92 participants in Belgium and 117 and 114 participants in Czech
Republic, respectively.
8 Balanza et al. (2006) focus on Mediterranean Europe (Spain, Portugal, Italy, Greece, France, Cyprus and
Albania); Northern Europe (the UK, Sweden, Norway, Finland, Germany, Ireland, Denmark and Iceland); and
Eastern Europe (Czech Republic, Slovakia, Poland, Bulgaria, Hungary, and Romania).
14Reviews of Scientific Evidence and Policies on Nutrition and Physical Activity
In addition, the European Nutrition and Health Report (Elmadfa et al., 2009) summarises
that the most prominent trends in food supply and availability are:
An increase of the proportion of animal products in Southern and Central-Eastern
European countries, a slight decrease in the North region and no change in the
West of Europe;
A decrease in average carbohydrate supply in all countries, accompanied by an
increase in fat intake (in line with Balanza et al.’s conclusion); and
Excessive average supply and availability of meat and meat products in all
countries, higher availability of fruits and vegetables in the South of Europe
compared to a higher availability of cereals and potatoes in Central and Eastern
Europe.
In the remainder of this section, two specific trends influencing European dietary choices
are examined: new food markets and the availability of convenience and pre-packed
foods; and dietary restrictions, specialised diets and eating ‘healthily’.
3.2.3.1 More choices in products
Importantly, the availability of any food and drink is a major determinant of consumption
(Elmadfa et al., 2009). Europeans now have more choices as to what they consume or
how they prepare their food, which may in part explain the convergence of dietary
consumption patterns across the continent.
Convenience and pre-packed foods, from time saving ingredients to complete ready
meals, have made it easier to access and eat a variety of products, without spending as
much time preparing them (Fulponi, 2009). In this instance, the average family spends
as little as six-and-a half minutes preparing the evening meal compared to the typical
two-and-a-half hours reported 50 years ago, in part due to the use of convenience
products such as frozen vegetables (EEA, 2005).
Europeans now also have more choices of the same or alternative produce, as a result of
factors such as to an increase in the number of competing brand suppliers for the same
foods. There is also a particular demand for ‘higher quality’ produce (European
Commission, 2014). For example, according to Meredith and Willer (2016), a noticeable
trend is the growth of the organic market in the EU, where retail sales increased by 7.4%
from 2013 to 2014. Particularly strong growth was visible in Sweden and France, where
sales grew by 45% and 10% respectively. However, the authors also note there are still
large differences in the per capita consumption of organic food between MSs, with
Luxembourg and Denmark leading, and Slovakia and Bulgaria having the least amount of
organic food consumption. Additional research into the consumption of organic produce is
required to verify these findings.
3.2.3.2 Dietary restrictions, specialised diets and eating ‘healthily’
Restrictions on what people eat can be made out of choice or as a result of health-related
factors such as allergies or food intolerance. Increasingly, more and more food and drink
options are available for individuals who have restricted diets, ranging from gluten-free
products to low-fat alternatives, which has led to policy changes around labelling and
marketing (see, for example, EU regulation on Food for Specific Groups9). Subsequently,
according to a report into sustainable diets published as part of the ‘Live Well for Life’
series, consumers have become more open to changing or specialising their diets (WWF,
2013). For example, UK government research indicates that 62% of respondents were
‘very or fairly willing’ to give up red meat, while 36% were ‘very or fairly willing’ to give
9The Regulation (EU) No 609/2013 of the European Parliament and the Council on 'Food for Specific Groups' is
an example of EU changes to improve the content and marketing of food products for groups of consumers with
specialised or energy-restricted diets.
15Reviews of Scientific Evidence and Policies on Nutrition and Physical Activity
up dairy products (DEFRA, 2011 cited in WWF, 2013), and Dutch research has identified
a growing interest in flexitarian diets, which occasionally contain meat (De Bakker and
Dagevos,, cited in WWF, 2013).
There has also been an increase in focus on healthy eating and the restriction of
nutritionally unbalanced products. For example, in the UK, the British Heart Foundation
stated that the ‘overall intake of calories, fat and saturated fat has decreased since the
1970s. This trend is accompanied by a decrease in sugar and salt intake, and an increase
in fibre and fruit and vegetable intake.’ (British Heart Foundation, 2012 as cited in
Snowdon, 2014). Conversely another report also published as part of the ‘Live Well for
Life’ campaign10 (van Dooren and Kramer, 2012) found that current dietary trends in
three European countries with diverse diets (Spain, France and Sweden) were far from
sustainable or healthy, and reflected a move towards an average Western diet, consisting
of high meat and calorie-dense food consumption, and low fruit, vegetable and legume
consumption.
This may result from the fact that some individuals still place little importance on
ensuring a healthy, balanced diet, and/or find it difficult to eat healthily. For example, the
Department for Environment, Food and Rural Affairs (DEFRA) commissioned a survey of
3,000 households in the UK in 2010 (cited in Bagwell, 2013) and found that 19% of
respondents thought it was not greatly important that the food they eat conforms to a
healthy, balanced diet. The main reasons respondents gave for not adopting a healthy
balanced diet were, ‘don’t want to give up the foods I like’, ‘healthy foods are too
expensive’ and ‘can’t resist’. Healthy eating may also be linked to other factors such as
income, though the relationships may not always be clear. For example Fernandez-Alvira
et al. (2014) found a significant association between children whose parents had a lower
reported socio-economic status (SES) and eating ‘processed’ food, though a higher socio-
economic status was not associated with a healthy diet for children in Italy, Spain and
Sweden11.
Finally, one commonly studied aspect of European consumption patterns is adherence to
a Mediterranean-like dietary pattern, which is shown to improve health and be effective
in the prevention of several non-communicable diseases (Vareiro et al., 2009). As shown
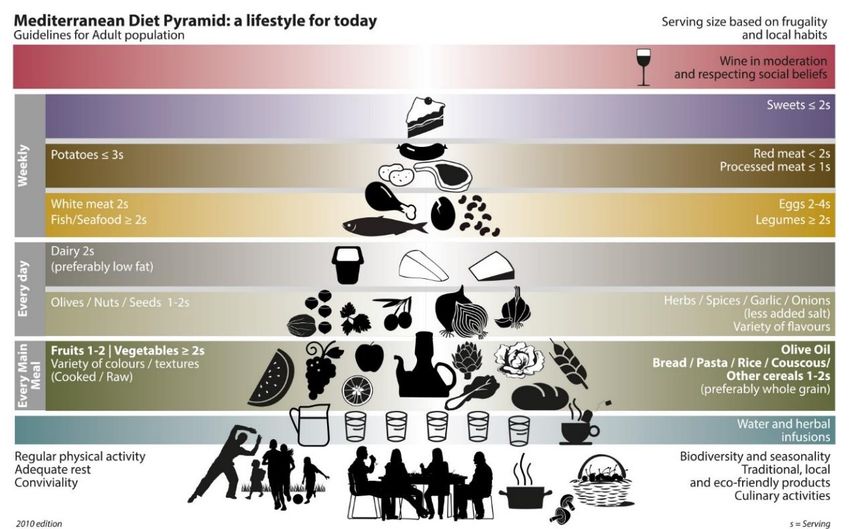
in Figure 1, the Mediterranean diet consists of a high intake of fruits and vegetables,
water and herbal infusions, and carbohydrates such as bread, pasta, rice and cereals
(preferably wholemeal); and less intake of sweets, and red or processed meats.
10 The ‘Live Well for Life’ campaign is an example of another move towards healthier eating, with a specific focus
on ‘sustainable’ diets, defined as ‘more plants and certified sustainable foods; less meat and highly processed
food’.
11 Fernandez-Alvira et al. examined dietary patterns among European children aged 2-9 using data from the
‘Identification and prevention of Dietary and lifestyle-induced health EFfects In Children and infantS’ study’
(IDEFICS, 2007/2008). Parents from eight European countries (Belgium, Cyprus, Estonia, Germany, Hungary,
Italy, Spain and Sweden) completed a self-administered questionnaire about parental attitudes, child behaviour
and parent socio-economic status. The authors performed a principal component analysis to examine the dietary
patterns of each country using data about the weekly frequency of consumption for 43 food items
16Reviews of Scientific Evidence and Policies on Nutrition and Physical Activity
Figure 1. Mediterranean diet pyramid – guidelines for the adult population
Source: Vareiro et al. (2009)
Nonetheless, research has found that current consumption trends in Europe, including in
Mediterranean countries, are increasingly moving away from the Mediterranean diet
despite efforts to encourage this pattern of consumption.12 For example, in Spain, despite
high levels of fruit consumption, there is also a shift towards more regular fat and dairy
consumption (van Dooren and Kramer, 2012). Similarly, based on food availability data
from the Food Balance Sheets13, Vareiro et al. (2009) note a move away from the
traditional (Mediterranean) diet for Mediterranean Europe with an increase in meats,
vegetables oils and sugars and sweets.
Given the changes to regional European diets, there is some evidence of converging
trends in European dietary habits and preferences. In this instance, older data collected
in the 1990s (1991 to 1999 depending on country) as part of the Data Food Networking
project (DAFNE) was used by Naska et al. (2006) to examine changes in dietary patterns
of ten European countries14 (grouped into Northern, Central and Mediterranean Europe).
The authors found that Mediterranean countries had increased meat consumption; and
northern and central European countries demonstrated patterns of fruit and vegetable
intake similar to that of Mediterranean regions. Additionally, data from 7940 children in
the IDEFICS study (Tognon et al., 2014) suggests there are similar adherence levels to a
Mediterranean diet among European children from Central, Northern and Mediterranean
Europe (with the exception of Italian pre-schoolers). This confirms that dietary
differences among European countries have narrowed over time.
12 As a result of an application by Spain, Greece, Italy and Morocco, the Mediterranean diet is on UNESCO’s List
of Intangible Heritage and so governments in these countries are obliged to protect the diet as a cultural heritage.
13 The Food Balance sheets are compiled annually and provide an estimate of consumption.
14 Data was collected as part of the Household Budget Survey (HBS), and captured foods and beverages
available at the household level. Principal component analysis was used to identify food patterns
17Reviews of Scientific Evidence and Policies on Nutrition and Physical Activity
3.2.4 Consumption of core food groups
This section reviews the dietary habits of Europeans, and is structured on the core food
groups specified in the eatwell.co.uk food pyramid developed by the UK Food Standards
Agency. These are:
Vegetables, salad and fruits;
Wholemeal cereals and breads, potatoes, pasta and rice;
Milk, yoghurt and cheese;
Meat, poultry, fish, eggs, beans and nuts;
Fats, spreads and oils; and
Foods and drinks high in fat, sugar and salt.
Importantly, certain foods could belong to multiple categories and the classification of
foods into these core food groups may vary by country. Therefore, in this review, we use
the Eatwell categories solely as a way in which to structure the section. Breaking down
diet by food group rather than nutrient group is also a more practical way of interpreting
consumption patterns.
Additionally, it should be stressed that many different food pyramid structures and
guidelines exist and recommendations depend on: the existing nutritional status of a
population; nutrient gaps/identification of nutrients of public health importance; existing
diet-health relationships; country-specific diet-related problems; foods relevant to food-
based dietary guidelines; and existing consumption patterns. Consequently, no comment
or judgement is made regarding the “healthiness” of the consumption patterns identified
as this requires a closer examination of the eating and drinking habits of Europeans
against specific and targeted benchmarks.
3.2.4.1 Vegetables, salad15 and fruit
Vegetables and fruits are often associated with a healthy diet because they contain
vitamins, minerals, fibre, small amounts of energy and minor components
(phytochemicals or secondary plant products) that are considered beneficial for health
(European Food Information Council (EUFIC), 2012). Self-reported data, collected in
several cross-national surveys, illustrate key differences in the daily consumption of
vegetables, salad and fruits by Europeans.
According to information collected during the second cycle of the European Health
Interview Survey (2013-201516), the daily consumption of fruit and vegetables varies
between MSs. As shown in Figure 2 below, over half of the population in Romania and
Bulgaria (65.1% and 58.6% respectively) report no consumption of fruit and vegetables
on a daily basis, compared to Belgium which has smallest proportion of people reporting
zero consumption (16.1 %). Respondents in the United Kingdom also report high levels
of daily fruit and vegetable consumption, with a third of all respondents consuming more
than five fruits and vegetables a day.
15Salad items are subsumed under the fruit and vegetable categories in this review
16The first wave of EHIS (EHIS wave 1 or EHIS round 2008) was conducted between 2006 and 2009. The
second wave (EHIS wave 2 or EHIS round 2014) was conducted between 2013 and 2015.
18You can also read


