Addressing Nitrate in California's Drinking Water
←
→
Page content transcription
If your browser does not render page correctly, please read the page content below

Addressing Nitrate
in California’s Drinking Water
With a Focus on Tulare Lake Basin and Salinas Valley Groundwater

Report for the State Water Resources Control Board Report to the Legislature

                                                                  California Nitrate Project,
                                                           Implementation of Senate Bill X2 1

                                                                  Center for Watershed Sciences
                                                                  University of California, Davis
                                                          http://groundwaternitrate.ucdavis.edu

                               Prepared for the California State Water Resources Control Board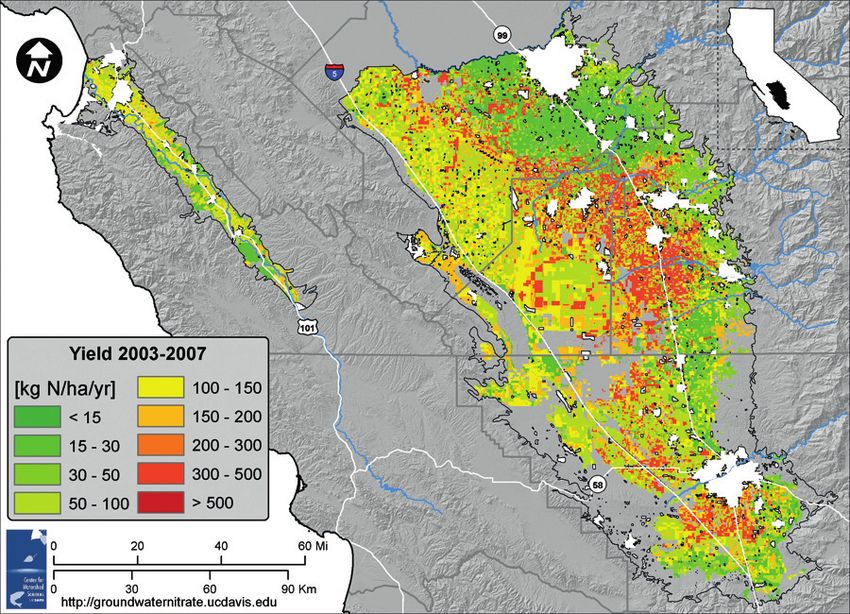
The health of our waters
   is the principal measure
of how we live on the land.

           — Luna Leopold
Addressing Nitrate in California’s Drinking Water
With a Focus on Tulare Lake Basin and Salinas Valley Groundwater

Report for the State Water Resources Control Board Report to the Legislature

This Report and its associated eight Technical Reports were prepared by
  Thomas Harter and Jay R. Lund                          Dylan B. Boyle, Holly E. Canada, Nicole
  (Principal Investigators)                              DeLaMora, Kristin N. Dzurella, Anna Fryjoff-
                                                         Hung, Allan D. Hollander, Kristin L. Honeycutt,
  Jeannie Darby, Graham E. Fogg, Richard Howitt,
                                                         Marion W. Jenkins, Vivian B. Jensen, Aaron M.
  Katrina K. Jessoe, G. Stuart Pettygrove,
                                                         King, George Kourakos, Daniel Liptzin, Elena M.
  James F. Quinn, and Joshua H. Viers
                                                         Lopez, Megan M. Mayzelle, Alison McNally, Josue
  (Co-Investigators)
                                                         Medellin-Azuara, and Todd S. Rosenstock
                                                         With project management support from
                                                         Cathryn Lawrence and Danielle V. Dolan

                                       Center for Watershed Sciences • University of California, Davis
                                     Groundwater Nitrate Project, Implementation of Senate Bill X2 1
                          Prepared for California State Water Resources Control Board • January 2012
                                                                http://groundwaternitrate.ucdavis.edu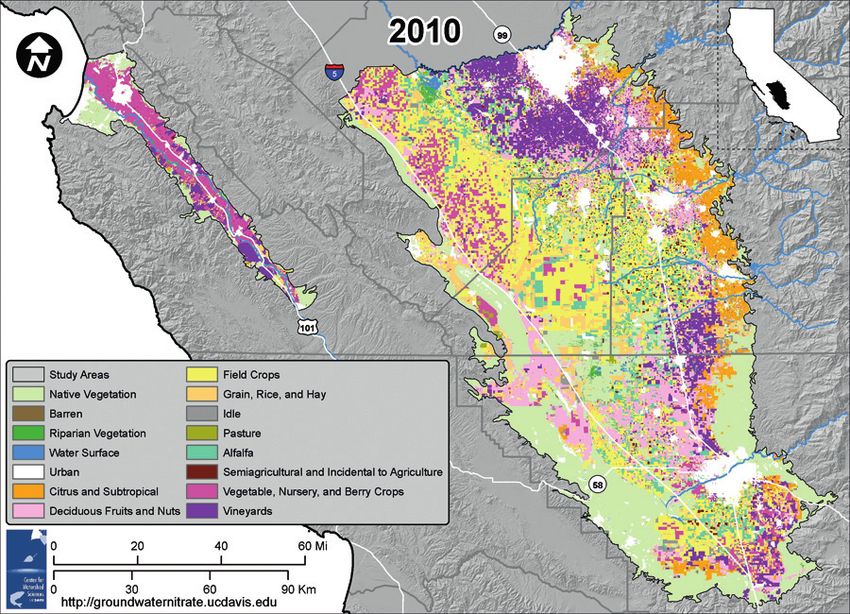
Copyright ©2012 The Regents of the University of California          Suggested citation: Harter, T., J. R. Lund, J. Darby, G. E.
                                                                     Fogg, R. Howitt, K. K. Jessoe, G. S. Pettygrove, J. F. Quinn,
All rights reserved
                                                                     J. H. Viers, D. B. Boyle, H. E. Canada, N. DeLaMora, K. N.
The University of California prohibits discrimination or             Dzurella, A. Fryjoff-Hung, A. D. Hollander, K. L. Honeycutt,
harassment of any person on the basis of race, color, national       M. W. Jenkins, V. B. Jensen, A. M. King, G. Kourakos, D.
origin, religion, sex, gender identity, pregnancy (including         Liptzin, E. M. Lopez, M. M. Mayzelle, A. McNally, J. Medellin-
childbirth, and medical conditions related to pregnancy or           Azuara, and T. S. Rosenstock. 2012. Addressing Nitrate in
childbirth), physical or mental disability, medical condition        California's Drinking Water with a Focus on Tulare Lake Basin
(cancer-related or genetic characteristics), ancestry, marital       and Salinas Valley Groundwater. Report for the State Water
status, age, sexual orientation, citizenship, or service in the      Resources Control Board Report to the Legislature. Center
uniformed services (as defined by the Uniformed Services             for Watershed Sciences, University of California, Davis. 78 p.
Employment and Reemployment Rights Act of 1994: service in           http://groundwaternitrate.ucdavis.edu.
the uniformed services includes membership, application for
membership, performance of service, application for service,
or obligation for service in the uniformed services) in any of its
programs or activities. University policy also prohibits reprisal
or retaliation against any person in any of its programs or
activities for making a complaint of discrimination or sexual
harassment or for using or participating in the investigation or
resolution process of any such complaint. University policy is
intended to be consistent with the provisions of applicable State
and Federal laws.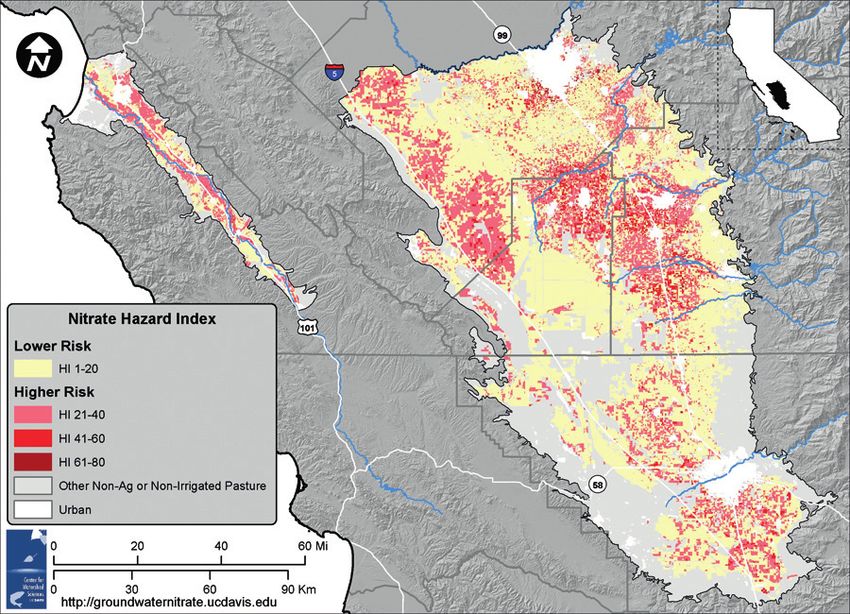
Contents
          List of Tables . . . . . . . . . . . . . . . . . . . . . . . . . . . . . . . . . . . . . . . . . . . . . . . . . . . . . . . . . . . . . . . . . v
          List of Figures . . . . . . . . . . . . . . . . . . . . . . . . . . . . . . . . . . . . . . . . . . . . . . . . . . . . . . . . . . . . . . .  vi
          Acknowledgments. . . . . . . . . . . . . . . . . . . . . . . . . . . . . . . . . . . . . . . . . . . . . . . . . . . . . . . . . . . . vii
          Acronyms and Abbreviations. . . . . . . . . . . . . . . . . . . . . . . . . . . . . . . . . . . . . . . . . . . . . . . . . . .  viii
Executive Summary.  .  .  .  .  .  .  .  .  .  .  .  .  .  .  .  .  .  .  .  .  .  .  .  .  .  .  .  .  .  .  .  .  .  .  .  .  .  .  .  .  .  .  .  .  .  .  .  .  .  .  .  .  .  .  .  . 1
          Key Issues . . . . . . . . . . . . . . . . . . . . . . . . . . . . . . . . . . . . . . . . . . . . . . . . . . . . . . . . . . . . . . . . . . . 2
          Summary of Key Findings. . . . . . . . . . . . . . . . . . . . . . . . . . . . . . . . . . . . . . . . . . . . . . . . . . . . . . . 2
          Findings: Sources of Nitrate Pollution . . . . . . . . . . . . . . . . . . . . . . . . . . . . . . . . . . . . . . . . . . . . . . 3
          Findings: Reducing Nitrate Pollution. . . . . . . . . . . . . . . . . . . . . . . . . . . . . . . . . . . . . . . . . . . . . . . 4
          Findings: Groundwater Nitrate Pollution. . . . . . . . . . . . . . . . . . . . . . . . . . . . . . . . . . . . . . . . . . . . 4
          Findings: Groundwater Remediation. . . . . . . . . . . . . . . . . . . . . . . . . . . . . . . . . . . . . . . . . . . . . . . 4
          Findings: Safe Drinking Water Supply. . . . . . . . . . . . . . . . . . . . . . . . . . . . . . . . . . . . . . . . . . . . . . 4
          Findings: Regulatory, Funding, and Policy Options. . . . . . . . . . . . . . . . . . . . . . . . . . . . . . . . . . . . 5
          Promising Actions . . . . . . . . . . . . . . . . . . . . . . . . . . . . . . . . . . . . . . . . . . . . . . . . . . . . . . . . . . . . . 5
                    Safe Drinking Water Actions . . . . . . . . . . . . . . . . . . . . . . . . . . . . . . . . . . . . . . . . . . . . . . . . . 5
                    Source Reduction Actions . . . . . . . . . . . . . . . . . . . . . . . . . . . . . . . . . . . . . . . . . . . . . . . . . . . 6
                    Monitoring and Assessment. . . . . . . . . . . . . . . . . . . . . . . . . . . . . . . . . . . . . . . . . . . . . . . . . . 6
                    Funding. . . . . . . . . . . . . . . . . . . . . . . . . . . . . . . . . . . . . . . . . . . . . . . . . . . . . . . . . . . . . . . . . 7
1 Introduction .  .  .  .  .  .  .  .  .  .  .  .  .  .  .  .  .  .  .  .  .  .  .  .  .  .  .  .  .  .  .  .  .  .  .  .  .  .  .  .  .  .  .  .  .  .  .  .  .  .  .  .  .  .  .  .  .  .  .  .  . 9
2 Sources of Groundwater Nitrate .  .  .  .  .  .  .  .  .  .  .  .  .  .  .  .  .  .  .  .  .  .  .  .  .  .  .  .  .  .  .  .  .  .  .  .  .  .  .  .  .  .  .  .  . 15
          2.1 Nitrogen Cycle: Basic Concepts. . . . . . . . . . . . . . . . . . . . . . . . . . . . . . . . . . . . . . . . . . . . . . . 15
          2.2 Sources of Nitrate Discharge to Groundwater. . . . . . . . . . . . . . . . . . . . . . . . . . . . . . . . . . . . . 15
                    Natural Nitrate Sources. . . . . . . . . . . . . . . . . . . . . . . . . . . . . . . . . . . . . . . . . . . . . . . . . . . . 15
                    Human Nitrate Sources. . . . . . . . . . . . . . . . . . . . . . . . . . . . . . . . . . . . . . . . . . . . . . . . . . . . 16
                    Groundwater Nitrate Contributions by Source Category. . . . . . . . . . . . . . . . . . . . . . . . . . . 17
                                  Agricultural Sources. . . . . . . . . . . . . . . . . . . . . . . . . . . . . . . . . . . . . . . . . . . . . . . . . 17
                                  Urban and Domestic Sources. . . . . . . . . . . . . . . . . . . . . . . . . . . . . . . . . . . . . . . . . . 24
                                  General Sources. . . . . . . . . . . . . . . . . . . . . . . . . . . . . . . . . . . . . . . . . . . . . . . . . . . . 29
          2.3 Reducing Nitrate Source Emissions to Groundwater . . . . . . . . . . . . . . . . . . . . . . . . . . . . . . . 29
                    Reducing Nitrate Loading from Irrigated Cropland and Livestock Operations. . . . . . . . . . . 29
                    Reducing Nitrate Leaching from Municipal Wastewater Treatment
                         and Food Processing Plants. . . . . . . . . . . . . . . . . . . . . . . . . . . . . . . . . . . . . . . . . . . . . . . 34
                    Reducing Nitrate Contributions from Leaking Sewer Pipes and Septic Systems. . . . . . . . . . 34
                    Reducing Nitrate Leaching from Turfgrass in Urban Areas. . . . . . . . . . . . . . . . . . . . . . . . . . 34
                    Reducing Nitrate Transfer and Loading from Wells . . . . . . . . . . . . . . . . . . . . . . . . . . . . . . . 34

                                                                                                                  Addressing Nitrate in California’s Drinking Water                                      iii
3 Impact: Groundwater Nitrate Occurrence.  .  .  .  .  .  .  .  .  .  .  .  .  .  .  .  .  .  .  .  .  .  .  .  .  .  .  .  .  .  .  .  .  .  .  .  .  .  . 35
                     3.1 Current Groundwater Quality Status. . . . . . . . . . . . . . . . . . . . . . . . . . . . . . . . . . . . . . . . . . . 35
                     3.2 Cleanup of Groundwater: Groundwater Remediation. . . . . . . . . . . . . . . . . . . . . . . . . . . . . . . 36
                     3.3 Existing Regulatory and Funding Programs for Nitrate Groundwater Contamination. . . . . . . 39
                     The Dutch Experience. . . . . . . . . . . . . . . . . . . . . . . . . . . . . . . . . . . . . . . . . . . . . . . . . . . . . . . . . 46
           4 Impact: Drinking Water Contamination .  .  .  .  .  .  .  .  .  .  .  .  .  .  .  .  .  .  .  .  .  .  .  .  .  .  .  .  .  .  .  .  .  .  .  .  .  .  .  . 47
                     4.1 Susceptible Populations. . . . . . . . . . . . . . . . . . . . . . . . . . . . . . . . . . . . . . . . . . . . . . . . . . . . . 47
                     4.2 Alternative Water Supply and Treatment . . . . . . . . . . . . . . . . . . . . . . . . . . . . . . . . . . . . . . . . 51
                               Community Public Water System Options. . . . . . . . . . . . . . . . . . . . . . . . . . . . . . . . . . . . . . 52
                               Self-Supplied Households and Local Small Water System Options. . . . . . . . . . . . . . . . . . . . 54
                               Treatment to Remove Nitrate. . . . . . . . . . . . . . . . . . . . . . . . . . . . . . . . . . . . . . . . . . . . . . . . 55
                               Consolidation and Regionalization. . . . . . . . . . . . . . . . . . . . . . . . . . . . . . . . . . . . . . . . . . . . 57
                     4.3 Comparison and Discussion. . . . . . . . . . . . . . . . . . . . . . . . . . . . . . . . . . . . . . . . . . . . . . . . . . 58
                               Options for Small Community Public Water Systems . . . . . . . . . . . . . . . . . . . . . . . . . . . . . 58
                               Options for Self-Supplied Households and Local Small Water Systems. . . . . . . . . . . . . . . . 60
                     4.4 Cost of Providing Safe Drinking Water. . . . . . . . . . . . . . . . . . . . . . . . . . . . . . . . . . . . . . . . . . 62
           5 Policy Options for Nitrate Source Reduction and Funding. .  .  .  .  .  .  .  .  .  .  .  .  .  .  .  .  .  .  .  .  .  .  .  .  .  . 63
                     5.1 Nitrate Source Reduction Policy Options. . . . . . . . . . . . . . . . . . . . . . . . . . . . . . . . . . . . . . . . 63
                               Major Findings: Future Source Reduction Options . . . . . . . . . . . . . . . . . . . . . . . . . . . . . . . 64
                     5.2 Funding Options. . . . . . . . . . . . . . . . . . . . . . . . . . . . . . . . . . . . . . . . . . . . . . . . . . . . . . . . . . 64
                               Major Findings: Future Funding Options . . . . . . . . . . . . . . . . . . . . . . . . . . . . . . . . . . . . . . 65
                     Payment for Ecosystem Services in New York City. . . . . . . . . . . . . . . . . . . . . . . . . . . . . . . . . . . . 66
           6 Promising Solutions.  .  .  .  .  .  .  .  .  .  .  .  .  .  .  .  .  .  .  .  .  .  .  .  .  .  .  .  .  .  .  .  .  .  .  .  .  .  .  .  .  .  .  .  .  .  .  .  .  .  .  .  .  . 67
                     6.1 Areas of Promising Action . . . . . . . . . . . . . . . . . . . . . . . . . . . . . . . . . . . . . . . . . . . . . . . . . . . 67
                               Safe Drinking Water Actions . . . . . . . . . . . . . . . . . . . . . . . . . . . . . . . . . . . . . . . . . . . . . . . . 67
                               Source Reduction Actions . . . . . . . . . . . . . . . . . . . . . . . . . . . . . . . . . . . . . . . . . . . . . . . . . . 67
                               Monitoring and Assessment. . . . . . . . . . . . . . . . . . . . . . . . . . . . . . . . . . . . . . . . . . . . . . . . . 69
                               Funding. . . . . . . . . . . . . . . . . . . . . . . . . . . . . . . . . . . . . . . . . . . . . . . . . . . . . . . . . . . . . . . . 69
                     6.2 Developing an Effective Solution Strategy . . . . . . . . . . . . . . . . . . . . . . . . . . . . . . . . . . . . . . . 70
                               Options without Tax Legislation . . . . . . . . . . . . . . . . . . . . . . . . . . . . . . . . . . . . . . . . . . . . . 70
                               Options Requiring Tax or Fee Legislation . . . . . . . . . . . . . . . . . . . . . . . . . . . . . . . . . . . . . . 71
                     6.3 Getting Organized. . . . . . . . . . . . . . . . . . . . . . . . . . . . . . . . . . . . . . . . . . . . . . . . . . . . . . . . . 71
                               Informational Actions . . . . . . . . . . . . . . . . . . . . . . . . . . . . . . . . . . . . . . . . . . . . . . . . . . . . . 71
                               Task Forces. . . . . . . . . . . . . . . . . . . . . . . . . . . . . . . . . . . . . . . . . . . . . . . . . . . . . . . . . . . . . 71
                     6.4 Dilemmas for State Action. . . . . . . . . . . . . . . . . . . . . . . . . . . . . . . . . . . . . . . . . . . . . . . . . . . 72
           7 Conclusions.  .  .  .  .  .  .  .  .  .  .  .  .  .  .  .  .  .  .  .  .  .  .  .  .  .  .  .  .  .  .  .  .  .  .  .  .  .  .  .  .  .  .  .  .  .  .  .  .  .  .  .  .  .  .  .  .  .  .  . 73
           Literature Cited.  .  .  .  .  .  .  .  .  .  .  .  .  .  .  .  .  .  .  .  .  .  .  .  .  .  .  .  .  .  .  .  .  .  .  .  .  .  .  .  .  .  .  .  .  .  .  .  .  .  .  .  .  .  .  .  .  .  . 75

iv   Addressing Nitrate in California’s Drinking Water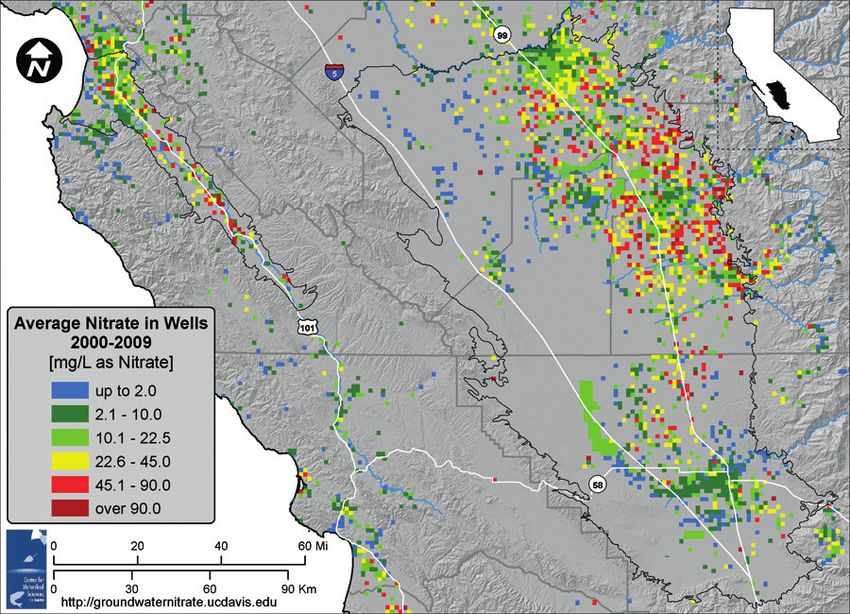
Tables
Table ES-1. Performance of state and agency actions for nitrate groundwater contamination. . . . . . . . 8
Table 1.    Major sources of groundwater nitrate. . . . . . . . . . . . . . . . . . . . . . . . . . . . . . . . . . . . 18
Table 2.    Major nitrogen fluxes to and from cropland. . . . . . . . . . . . . . . . . . . . . . . . . . . . . . . . 26
Table 3.    Total nitrogen discharge to land and average total nitrogen
            concentration in discharge . . . . . . . . . . . . . . . . . . . . . . . . . . . . . . . . . . . . . . . . . . . . 27
Table 4.    Measures for improving nitrogen use efficiency and decreasing nitrate leaching. . . . . . . 30
Table 5.    Effect of nitrate load reduction on applied water, revenues,
            crop area, and nitrogen application. . . . . . . . . . . . . . . . . . . . . . . . . . . . . . . . . . . . . . 32
Table 6.    Total number of wells and samples, location, nitrate concentration,
            and MCL exceedance . . . . . . . . . . . . . . . . . . . . . . . . . . . . . . . . . . . . . . . . . . . . . . . . 36
Table 7.    Total groundwater and remediation volume by sub-basin. . . . . . . . . . . . . . . . . . . . . . 41
Table 8a.   Programs and statutes for reducing nitrate contamination in groundwater . . . . . . . . . 42
Table 8b.   Current planning and regulatory programs regarding nitrate in groundwater . . . . . . . 43
Table 9.    Existing funding sources for safe drinking water . . . . . . . . . . . . . . . . . . . . . . . . . . . . 44
Table 10.   Number of years until community public water supply sources exceed nitrate MCL. . . . . . 52
Table 11.   Options for community public water systems . . . . . . . . . . . . . . . . . . . . . . . . . . . . . . 53
Table 12.   Options for self-supplied households and local small water systems. . . . . . . . . . . . . . 55
Table 13.   Influence of nitrate concentration on treatment selection. . . . . . . . . . . . . . . . . . . . . . 58
Table 14.   Safe drinking water option costs for household and small water systems . . . . . . . . . . 60
Table 15.   Least cost of short-term alternative water supply for
            community public water systems. . . . . . . . . . . . . . . . . . . . . . . . . . . . . . . . . . . . . . . . 61
Table 16.   Least cost of long-term alternative water supply for
            community public water systems. . . . . . . . . . . . . . . . . . . . . . . . . . . . . . . . . . . . . . . . 62
Table 17.   Regulatory options to reduce nitrate contamination to groundwater. . . . . . . . . . . . . . 63
Table 18.   Future state funding options. . . . . . . . . . . . . . . . . . . . . . . . . . . . . . . . . . . . . . . . . . . 65
Table 19.   Performance of state and agency actions for nitrate groundwater contamination . . . . . . 68

                                                                        Addressing Nitrate in California’s Drinking Water           v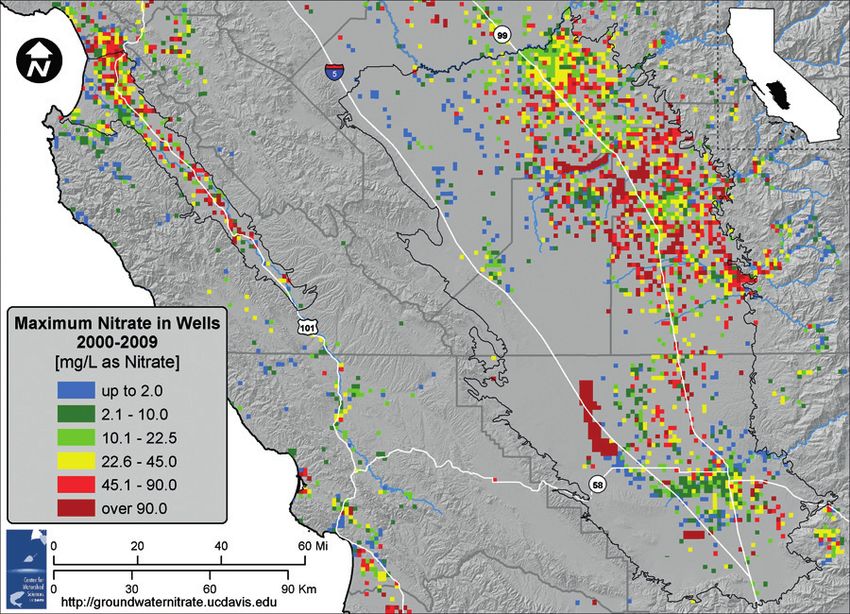
Figures
          Figure ES-1. Estimated groundwater nitrate loading from major sources. . . . . . . . . . . . . . . . . . . . 3
          Figure ES-2. Overview of cropland input and output. . . . . . . . . . . . . . . . . . . . . . . . . . . . . . . . . . 4
          Figure 1.       Maximum of raw water nitrate levels in public water systems, 2006–2010. . . . . . .  10
          Figure 2.       Tulare Lake Basin and Salinas Valley . . . . . . . . . . . . . . . . . . . . . . . . . . . . . . . . . . .  13
          Figure 3.       Overview of cropland input and output. . . . . . . . . . . . . . . . . . . . . . . . . . . . . . . . .  19
          Figure 4.       Current typical fertilization rate for irrigated agricultural cropland. . . . . . . . . . . . .  20
          Figure 5.       Estimated current average nitrogen uptake in harvested crop materials. . . . . . . . . .  22
          Figure 6.       Estimated historical agricultural development . . . . . . . . . . . . . . . . . . . . . . . . . . . .  23
          Figure 7.       Nitrogen applied, nitrogen harvested, and suggested nitrogen
                          application reduction . . . . . . . . . . . . . . . . . . . . . . . . . . . . . . . . . . . . . . . . . . . . . .  25
          Figure 8.       Septic-derived nitrate leaching rates . . . . . . . . . . . . . . . . . . . . . . . . . . . . . . . . . . .  28
          Figure 9.       Overall hazard index. . . . . . . . . . . . . . . . . . . . . . . . . . . . . . . . . . . . . . . . . . . . . . .  31
          Figure 10.      Decrease in net farm income as a function of nitrogen
                          efficiency improvements . . . . . . . . . . . . . . . . . . . . . . . . . . . . . . . . . . . . . . . . . . . .  33
          Figure 11.      Mean of the time-average nitrate concentration in wells, 2000–2009 . . . . . . . . . . .  38
          Figure 12.      Maximum nitrate concentrations, 2000–2009 . . . . . . . . . . . . . . . . . . . . . . . . . . . .  39
          Figure 13.      Five-year moving average of wells exceeding the MCL in any given year. . . . . . . . .  40
          Figure 14.      Public water system size distribution. . . . . . . . . . . . . . . . . . . . . . . . . . . . . . . . . . .  48
          Figure 15.      Estimated locations of unregulated and unmonitored small water systems . . . . . . .  48
          Figure 16.      Susceptible populations based on estimated vulnerability and water quality . . . . . . .  49
          Figure 17.      Small water systems located near wells with nitrate greater than the MCL. . . . . . . .  50
          Figure 18.      Relationship between disadvantaged communities and delivered
                          water quality. . . . . . . . . . . . . . . . . . . . . . . . . . . . . . . . . . . . . . . . . . . . . . . . . . . . .  51
          Figure 19.      California drinking water systems treating or blending for nitrate. . . . . . . . . . . . . .  56
          Figure 20.      Study area systems treating or blending for nitrate. . . . . . . . . . . . . . . . . . . . . . . . .  57
          Figure 21.      Minimum distance from a small water system to a larger system. . . . . . . . . . . . . . .  59
          Figure 22.      Lowest-cost alternative supply for community public small water systems. . . . . . . . .  61

vi   Addressing Nitrate in California’s Drinking Water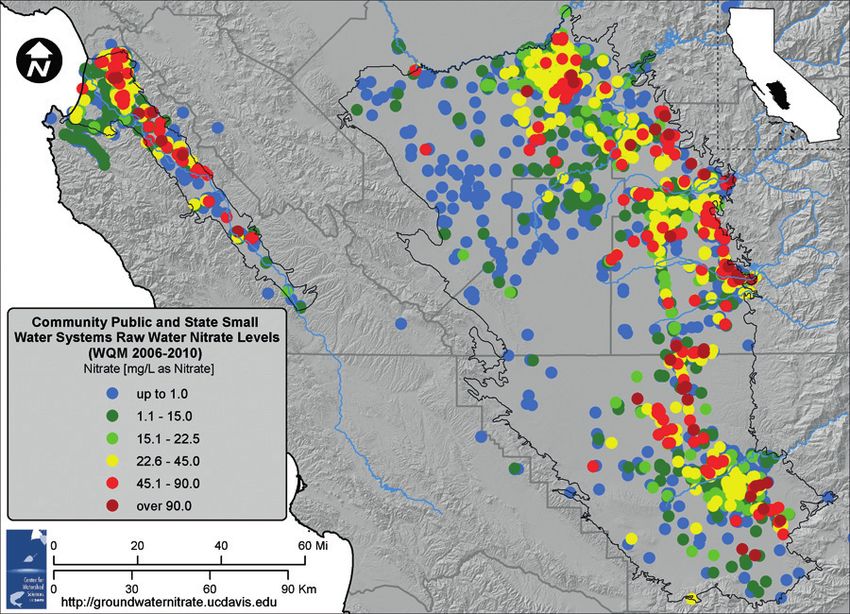
Acknowledgments
  Preparation of this Report would not have been             Groenenberg, Amrith Gunasekara, Ellen Hanak, Elise
  possible without assistance from many people               Harrington, Tim Hartz, Tom Haslebacher, Charles
  contributing in many different ways: Staff members         Hemans, Samantha Hendricks, Tarrah Henrie,
  from local, state, and federal agencies and from           Charles Hewitt, Mike Hickey, Cheryl Higgins, Glenn
  non-governmental organizations, consultants, and           Holder, Gerald Horner, Clay Houchin, Ceil Howe
  academic colleagues were involved in collecting,           III, Allen Ishida, Chris Johnson, Tim Johnson,
  organizing, and providing data; exchanging infor-          Joel Jones, Gary Jorgensen, Stephen Kafka, Mary
  mation and ideas; providing technical support and          Kaneshiro, Matthew Keeling, Sally Keldgord, Dennis
  assistance; and reviewing drafts of the Technical          Keller, Parry Klassen, Ralf Kunkel, William LaBarge,
  Reports. Many students and UC Davis staff other            Tess Lake, Matt Landon, Michael Larkin, Sarah
  than the authors helped with data entry, literature        Laybourne, Armando Leal, Lauren Ledesma, France
  research, informal surveys, and report preparation.        Lemieux, Michelle LeStrange, John Letey, Harold
         We particularly thank the following persons         Leverenz, Betsy Lichti, Carl Lischeske, Katherine
  for their support of this project: Ben Aldridge,           Lockhart, Karl Longley, Michael Louie, Jerry Lowry,
  Charles Andrews, Adam Asquith, Denise Atkins,              Mark Lubell, Patrick Maloney, Elizabeth Martinez,
  Amadou Ba, Lisa Babcock, Keith Backman, Carolina           Marsha Campbell Mathews, Megan Mayzelle, Joe
  Balazs, Jennifer Baldwin, Tom Barcellos, Stephen           McGahan, Mike McGinnis, Chiara McKenney, Zach-
  Barnett, Robert H. Beede, Ken Belitz, Daniel Benas,        ary Meyers, Gretchen Miller, Eli Moore, Jean Moran,
  Jamie Bledsoe, Tim Borel, Tony Boren, John Borkov-         Shannon Mueller, Erin Mustain, Rob Neenan, Dick
  ich, Paul Boyer, Scott Bradford, Beverly Briano, Jess      Newton, Mart Noel, Ben Nydam, Gavin O’Leary,
  Brown, Susan Brownstein, Karen Burow, Jim Butler,          Tricia Orlando, David Orth, Eric Overeem, Doug
  Michael Cahn, Kristine Cai, Mary Madison Camp-             Parker, Tim Parker, Doug Patterson, Sam Perry, Joe
  bell, Maria de la Paz Carpio-Obeso, Eugene Cassady,        Prado, Kurt Quade, Jose Antonio Ramirez, Solana
  Thomas Chamberlain, Antoine Champetier de Ribes,           Rice, Clay Rodgers, Michael Rosberg, Jim Ross, Lisa
  Paul Charpentier, Anthony Chavarria, Kathy Chung,          Ross, Omid Rowhani, Yoram Rubin, Victor Rubin,
  Jennifer Clary, Dennis Clifford, Ron Cole, Tom Cole-       Joseph Rust, Blake Sanden, Cheryl Sandoval, Sandra
  man, Carol Collar, Paul Collins, Rob Coman, Marc           Schubert, Kurt Schwabe, Seth Scott, Alan Scroggs,
  Commandatore, David Cory, Leslie Cotham, Vern              Chad Seidel, Eric Senter, Ann Senuta, David Sholes,
  Crawford, Pamela Creedon, David Crohn, Debbie              Richard Smith, Rosa Staggs, Scott Stoddard, Daniel
  Davis, Kevin Day, Michelle De Haan, Susana Deanda,         Sumner, Michael Tharp, Sonja Thiede, Kathy Thom-
  Ria DeBiase, Jesse Dhaliwal, John Dickey, John             asberg, Larry Tokiwa, Thomas Tomich, Andrew Tran,
  Diener, Danielle V. Dolan, Paige Dulberg, Murray           Thomas Travagli, Kaomine Vang, Leah Walker, Jo
  Einarson, Erik Ekdahl, Brad Esser, Joe Fabry, Bart         Anna Walker, Emily Wallace, Robin Walton, Greg
  Faris, Claudia Faunt, Bret Ferguson, Laurel Fires-         Wegis, Frank Wendland, Dennis Westcot, Jim White,
  tone, Chione Flegal, Robert Flynn, Lauren Fondahl,         Blake Wilbur, Joel Wiley, Jeff Witte, Craig Wolff,
  Wayne Fox, Ryan Fox, Carol Frate, Rob Gailey,              Steve Wright, Xiaoming Yang, and Janice Zinky.
  James Giannopoulos, Craig Gorman, Lynn Gorman,                    This work was funded by the State Water
  Kelly Granger, Sarge Green, David Greenwood, Nick          Resources Control Board under agreement number
                                                             09-122-250.

                                                          Addressing Nitrate in California’s Drinking Water         vii
Acronyms and Abbreviations
              AB                   Assembly Bill
              ac                   Acre (about 0.4 hectares)
              AF                   Acre-foot (about 1,233 cubic meters)
              AMBAG                Association of Monterey Bay Area Governments
              AQUA                 Association of People United for Water
              ARRA                 American Recovery and Reinvestment Act
              AWP                  Agricultural Waiver Program
              BD                   Biological Denitrification
              BMP                  Best Management Practices
              CAA                  Cleanup and Abatement Account
              CalEPA               California Environmental Protection Agency
              CAL FAC              California Food and Agriculture Code
              CalNRA               California Natural Resources Agency
              CCR                  California Code of Regulations
              CCR                  Consumer Confidence Report
              CDBG                 Community Development Block Grant
              CDFA                 California Department of Food and Agriculture
              CDPH                 California Department of Public Health
              CoBank               Cooperative Bank
              CPWS                 Community Public Water System
              CRWA                 California Rural Water Association
              CV-SALTS             Central Valley Salinity Alternative for Long-Term Sustainability
              CVSC                 Central Valley Salinity Coalition
              CWA                  Clean Water Act
              CWC                  Community Water Center
              CWSRF                Clean Water State Revolving Fund
              DAC                  Disadvantaged Communities
              DPEIR                Draft Program Environmental Impact Report (of the Central Valley ILRP)
              DPR                  California Department of Pesticide Regulation
              DWR                  California Department of Water Resources
              DWSAP                Drinking Water Source Assessment and Protection
              DWSRF                Drinking Water State Revolving Fund
              EDA                  U.S. Economic Development Administration

viii   Addressing Nitrate in California’s Drinking Water
EDR Electrodialysis Reversal
ERG Expense Reimbursement Grant Program
ERP-ETT Enforcement Response Policy and Enforcement Targeting Tool
FFLDERS Feed, Fertilizer, Livestock, Drugs, and Egg Regulatory Services
FMIP Fertilizing Materials Inspection Program
FP Food Processors
FREP Fertilizer Research and Education Program
GAMA Groundwater Ambient Monitoring and Assessment
Gg Gigagram (1 million kilograms, about 1,100 tons)
ha Hectare (about 2.5 acres)
HAC Housing Assistance Council
HSNC Historical Significant Non-Compliers
HUD U.S. Department of Housing and Urban Development
I-Bank California Infrastructure and Economic Development Bank
ILRP Irrigated Lands Regulatory Program
IRWM Integrated Regional Water Management
ISRF Infrastructure State Revolving Fund
IX Ion Exchange
KCWA Kern County Water Agency
kg Kilogram (about 2.2 pounds)
L Liter (about 1.06 liquid quarts)
lb Pound (about 0.45 kilogram)
LLNL Lawrence Livermore National Lab
MCL Maximum Contaminant Level
MCWRA Monterey County Water Resources Agency
mg Milligram (about 0.00003 ounce)
MHI Median Household Income
MUN Municipal or domestic water supply (beneficial use)
NDWC National Drinking Water Clearinghouse
NMP Nutrient Management Plan
NPDES National Pollutant Discharge Elimination System
NRWA National Rural Water Association
NUE Nitrogen Use Efficiency
NWG Nitrate Working Group
Addressing Nitrate in California’s Drinking Water ixO&M Operations and Maintenance
OW EPA’s Office of Water
PES Payment for Ecosystem Services
PHG Public Health Goal
PNB Partial Nutrient Balance
POE Point-of-Entry (for household water treatment)
Porter-Cologne Porter-Cologne Water Quality Control Act (California Water Code § 13000 et seq.)
POU Point-of-Use (for household water treatment)
PPL Project Priority List
PWS Public Water System
RCAC Rural Community Assistance Corporation
RCAP Rural Community Assistance and Partnership
RO Reverse Osmosis
RUS Rural Utilities Service
SB Senate Bill
SDAC Severely Disadvantaged Communities
SDWA Safe Drinking Water Act
SDWSRF Safe Drinking Water State Revolving Fund
SEP Supplement Environmental Program
SHE Self-Help Enterprises
SRF State Revolving Fund
SSWS State Small Water System
SV Salinas Valley
t Ton (U.S. short ton, about 907 kilograms)
TLB Tulare Lake Basin
U.S. EPA United States Environmental Protection Agency
U.S.C. United States Code
USDA United States Department of Agriculture
USGS U.S. Geological Survey
WARMF Watershed Analysis Risk Management Framework
WDR Waste Discharge Requirements
WEP Water Environmental Program
WMP Waste Management Plan
WWTP Wastewater Treatment Plant
x Addressing Nitrate in California’s Drinking WaterExecutive Summary
Addressing Nitrate in California’s Drinking Water / Executive Summary 1Executive Summary
In 2008, Senate Bill SBX2 1 (Perata) was signed into law
(Water Code Section 83002.5), requiring the State Water
Resources Control Board (State Water Board), in consultation
with other agencies, to prepare a Report to the Legislature to
Summary of Key Findings
“improve understanding of the causes of [nitrate] groundwa- 1 Nitrate problems will likely worsen for several
ter contamination, identify potential remediation solutions decades. For more than half a century, nitrate from
and funding sources to recover costs expended by the State… fertilizer and animal waste have infiltrated into Tu-
to clean up or treat groundwater, and ensure the provision of lare Lake Basin and Salinas Valley aquifers. Most
safe drinking water to all communities.” The University of nitrate in drinking water wells today was applied to
California prepared this Report under contract with the State the surface decades ago.
Water Board as it prepares its Report to the Legislature.
This executive summary focuses on major findings 2 Agricultural fertilizers and animal wastes applied
and promising actions. Details can be found in the Main to cropland are by far the largest regional sources
Report and eight accompanying Technical Reports. of nitrate in groundwater. Other sources can be lo-
cally relevant.
Key Issues 3 Nitrate loading reductions are possible, some at
Groundwater is essential to California, and nitrate is one modest cost. Large reductions of nitrate loads to
of the state’s most widespread groundwater contaminants. groundwater can have substantial economic cost.
Nitrate in groundwater is principally a by-product of nitro-
gen use, a key input to agricultural production. However, 4 Direct remediation to remove nitrate from large
too much intake of nitrate through drinking water can harm groundwater basins is extremely costly and not
human health. technically feasible. Instead, “pump-and-fertilize”
California’s governments, communities, and agricul- and improved groundwater recharge management
tural industry have struggled over nitrate contamination are less costly long-term alternatives.
for decades. The California Department of Public Health
5 Drinking water supply actions such as blending,
(CDPH) has set the maximum contaminant level (MCL)
treatment, and alternative water supplies are most
for nitrate in drinking water at 45 milligrams per liter (as
cost-effective. Blending will become less available in
nitrate). Nitrate concentrations in public drinking water
many cases as nitrate pollution continues to spread.
supplies exceeding the MCL require water system actions to
provide safe drinking water. 6 Many small communities cannot afford safe drink-
For this study, the four-county Tulare Lake Basin and ing water treatment and supply actions. High fixed
the Monterey County portion of the Salinas Valley are costs affect small systems disproportionately.
examined. About 2.6 million people in these regions rely
on groundwater for drinking water. The study area includes 7 The most promising revenue source is a fee on
four of the nation’s five counties with the largest agricultural nitrogen fertilizer use in these basins. A nitrogen
production. It represents about 40% of California’s irrigated fertilizer use fee could compensate affected small
cropland (including 80 different crops) and over half of communities for mitigation expenses and effects of
California’s dairy herd. Many communities in the area are nitrate pollution.
among the poorest in California and have limited economic
means or technical capacity to maintain safe drinking water 8 Inconsistency and inaccessibility of data prevent
given threats from nitrate and other contaminants. effective and continuous assessment. A statewide
effort is needed to integrate diverse water-related
data collection activities by many state and local
agencies.
2 Addressing Nitrate in California’s Drinking Water / Executive SummaryNitrate in groundwater poses two major problems
and risks:
Findings: Reducing Nitrate Pollution
Options for reducing nitrate pollution were identified for all
• Public health concerns for those exposed to nitrate sources. For cropland, where less than 40% of applied nitro-
contamination in drinking water; in California’s Tulare gen is removed by crop harvest, 10 management measures
Lake Basin and Salinas Valley, roughly 254,000 people (and 50 practices and technologies to achieve these manage-
are currently at risk for nitrate contamination of their ment objectives) were reviewed that can reduce—but not
drinking water. Of these, 220,000 are connected to eliminate—nitrate leaching to groundwater. These fall into
community public (>14 connections) or state small four categories:
water systems (5–14 connections), and 34,000 are
served by private domestic wells or other systems 1. Design and operate irrigation and drainage systems to
smaller than the threshold for state or county regula- reduce deep percolation.
tion and which are largely unmonitored. 2. Manage crop plants to capture more nitrogen and de-
• Financial costs of nitrate contamination include crease deep percolation.
additional drinking water treatment, new wells, 3. Manage nitrogen fertilizer and manure to increase crop
monitoring, or other safe drinking water actions; over nitrogen use efficiency.
1.3 million people are financially susceptible because
4. Improve storage and handling of fertilizers and manure
nitrate in raw source water exceeds the MCL, requiring
to decrease off-target discharge.
actions by drinking water systems. Nitrate contamina-
tion of drinking water sources will continue to increase
as nitrogen from fertilizer, manure, and other sources
applied in the last half century continues to percolate
downward and flow toward drinking water wells. WWTP-FP 3.2
Lagoons 0.2 Septic 2.3
Findings: Sources of Nitrate Pollution Corrals 0.5 Urban 0.9
Within the study area, human-generated nitrate sources to
groundwater include (Figure ES-1):
• cropland (96% of total), where nitrogen applied to crops,
but not removed by harvest, air emission, or runoff, is
leached from the root zone to groundwater. Nitrogen in-
tentionally or incidentally applied to cropland includes
synthetic fertilizer (54%), animal manure (33%), irriga-
tion source water (8%), atmospheric deposition (3%),
and wastewater treatment and food processing facility
effluent and associated solids (2%) (Figure ES-2);
• percolation of wastewater treatment plant (WWTP)
and food processing (FP) wastes (1.5% of total);
• leachate from septic system drainfields (1% of total); Cropland 200
• urban parks, lawns, golf courses, and leaky sewer
systems (less than 1% of total); and
• recharge from animal corrals and manure storage
lagoons (less than 1% of total);
• downward migration of nitrate-contaminated water Figure ES-1. Estimated groundwater nitrate loading from major
via wells (less than 1% of total). sources within the Tulare Lake Basin and Salinas Valley, in Gg
nitrogen per year (1 Gg = 1,100 t).
Addressing Nitrate in California’s Drinking Water / Executive Summary 3Cropland Nitrogen Inputs
Atmospheric
Irrigation water 29 losses 38
Atmospheric deposition 12 Runoff 18
Synthetic fertilizer 204 Leaching to groundwater 195
Land-applied biosolids 4.8
Land-applied liquids,
WWTP-FP 3.4
Land-applied manure from
CAFOs other than dairy 0.9
Land-applied dairy manure 127 Harvest 130
Cropland Nitrogen Outputs
Note: No mass balance was performed on 0.17 million ha (0.4 million ac) of nitrogen-fixing alfalfa, which is estimated to contribute an
additional 5 Gg N/yr to groundwater. Groundwater nitrate loading from all non-cropland sources is about 8 Gg N/yr.
Figure ES-2. Overview of cropland input and output (Gg N/yr) in the study area (Tulare Lake Basin and Salinas Valley) in 2005. The left
half of the pie chart represents total nitrogen inputs to 1.27 million ha (3.12 million ac) of cropland, not including alfalfa. The right half
of the pie chart represents total nitrogen outputs with leaching to groundwater estimated by difference between the known inputs and
the known outputs. Source: Viers et al. 2012.
4 Addressing Nitrate in California’s Drinking Water / Executive SummarySome of the needed improvements in nitrogen use Removal or reduction of contamination sources must
efficiency by crops will require increased operating costs, accompany any successful remediation effort. Combining
capital improvements, and education. For some cropland, “pump-and-fertilize” with improved groundwater recharge
the high economic costs of nitrate source reduction sufficient management is more technically feasible and cost-effective.
to prevent groundwater degradation will likely hinder strict
compliance with the state’s current anti-degradation policy
for groundwater (State Water Board Resolution 68-16). Findings: Safe Drinking Water Supply
Nitrate contamination is widespread and increasing.
Groundwater data show that 57% of the current population
Findings: Groundwater Nitrate Pollution in the study area use a community public water system with
Groundwater nitrate data were assembled from nearly two recorded raw (untreated) nitrate concentrations that have
dozen agencies and other sources (100,000 samples from exceeded the MCL at least once between 2006 and 2010.
nearly 20,000 wells). Of the 20,000 wells, 2,500 are frequently Continued basin-wide trends in nitrate groundwater concen-
sampled public water supply wells (over 60,000 samples). In tration may raise the affected population to nearly 80% by
these public supply wells, about 1 in 10 raw water samples 2050. Most of this population is protected by water system
exceed the nitrate MCL. Apart from the recently established treatment, or alternative wells, at additional cost. But about
Central Valley dairy regulatory program in the Tulare Lake 10% of the current population is at risk of nitrate contami-
Basin, there are no existing regular well sampling programs nation in their delivered drinking water, primarily in small
for domestic and other private wells. systems and self-supplied households.
The largest percentages of groundwater nitrate MCL No single solution will fit every community affected by
exceedances are in the eastern Tulare Lake Basin and in the nitrate in groundwater. Each affected water system requires
northern, eastern, and central Salinas Valley, where about individual engineering and financial analyses.
one-third of tested domestic and irrigation wells exceed the Communities served by small systems vulnerable to
MCL. These same areas have seen a significant increase in nitrate contamination can (a) consolidate with a larger system
nitrate concentrations over the past half century, although that can provide safe drinking water to more customers; (b)
local conditions and short-term trends vary widely. consolidate with nearby small systems into a new single
Travel times of nitrate from source to wells range from a larger system that has a larger ratepayer base and economies
few years to decades in domestic wells, and from years to many of scale; (c) treat the contaminated water source; (d) switch
decades and even centuries in deeper production wells. This to surface water; (e) use interim bottled water or point-of-
means that nitrate source reduction actions made today may use treatment until an approved long-term solution can be
not affect sources of drinking water for years to many decades. implemented; (f) drill a new well; or (g) blend contaminated
wells with cleaner sources, at least temporarily.
There is significant engineering and economic poten-
Findings: Groundwater Remediation tial for consolidating some systems. Consolidation can often
Groundwater remediation is the cleanup of contaminated permanently address nitrate problems, as well as many other
groundwater to within regulatory limits. Traditional pump- problems faced by small water systems.
and-treat and in-place approaches to remediation, common Solutions for self-supplied households (domestic well)
for localized industrial contamination plumes, would cost or local small water systems (2–4 connections) affected by
billions of dollars over many decades to remove nitrate from nitrate contamination are point-of-use (POU) or point-of-entry
groundwater in the Tulare Lake Basin and Salinas Valley. (POE) treatment and drilling a new or deeper well, albeit with
Timely cleanup of basin-scale nitrate contamination is not no guarantee for safe drinking water.
technically feasible. Additional costs for safe drinking water solutions to
Instead, long-term remediation by “pump-and-fertil- nitrate contamination in the Tulare Lake Basin and Salinas
ize” would use existing agricultural wells to gradually remove Valley are roughly $20 and $36 million per year for the
nitrate-contaminated groundwater and treat the water by short- and long-term solutions, respectively. About $17 to
ensuring nitrate uptake by crops through appropriate nutri- $34 million per year will be needed to provide safe drinking
ent and irrigation water management. Improved groundwa- water for 85 identified community public and state small
ter recharge management would provide clean groundwater water systems in the study area that exceed the nitrate drink-
recharge to mix with irrigation water recharge and partially ing water MCL (serving an estimated 220,000 people). The
mitigate nitrate levels in groundwater regionally. annualized cost of providing nitrate-compliant drinking water
Addressing Nitrate in California’s Drinking Water / Executive Summary 5to an estimated 10,000 affected rural households (34,000 greatest financial and public health problems from nitrate
people) using private domestic wells or local small water groundwater contamination.
systems is estimated to be at least $2.5 million for point-of-use
D1: Point-of-Use (POU) Treatment Option. CDPH reports
treatment for drinking use only. The total cost for alternative
on how to make economical household and point-of-use
solutions translates to $80 to $142 per affected person per
treatment for nitrate contamination an available and perma-
year, $5 to $9 per irrigated acre per year, or $100 to $180 per
nent solution for small water systems.*
ton of fertilizer nitrogen applied in these groundwater basins.
D2: Small Water System Task Force. CalEPA and CDPH
convene an independently led Task Force on Small Water
Findings: Regulatory, Funding, Systems that would report on problems and solutions of
and Policy Options small water and wastewater systems statewide as well as the
To date, regulatory actions have been insufficient to control efficacy of various state, county, and federal programs to aid
nitrate contamination of groundwater. Many options exist to small water and wastewater systems. Many nitrate contami-
regulate nitrate loading to groundwater, with no ideal solution. nation problems are symptomatic of the broad problems of
Nitrate source reductions will improve drinking water quality small water and wastewater systems.*
only after years to decades. Fertilizer regulations have lower D3: Regional Consolidation. CDPH and counties provide
monitoring and enforcement costs and information require- more legal, technical, and funding support for preparing
ments than do nitrate leachate regulations, but they achieve consolidation of small water systems with nearby larger
nitrate reduction targets less directly. Costs to farmers can be systems and creating new, regional safe drinking water solu-
lower with fertilizer fees or market-based regulations than tions for groups of small water systems, where cost-effective.*
with technology mandates or prescriptive standards. Market-
D4: Domestic Well Testing. In areas identified as being
based approaches may also encourage the development and
at risk for nitrate contamination by the California Water
adoption of new technologies to reduce fertilizer use.
Boards, as a public health requirement, CDPH (a) mandates
Current funding programs cannot ensure safe drink-
periodic nitrate testing for private domestic wells and local
ing water in the Salinas Valley and Tulare Lake Basin. Small
and state small systems and (b) requires disclosure of recent
water system costs are high, and some of these systems
well tests for nitrate contamination on sales of residential
already face chronic financial problems. Most current state
property. County health departments also might impose
funding for nitrate contamination problems is short term.
such requirements.
Little funding is provided for regionalization and consoli-
dation of drinking water systems. Policy options exist for D5: Stable Small System Funds. CDPH receives more
long-term funding of safe drinking water, but all existing stable funding to help support capital and operation and
and potential options will require someone to bear the costs. maintenance costs for new, cost-effective and sustainable
safe drinking water solutions, particularly for disadvantaged
communities (DACs).
Promising Actions
Addressing groundwater nitrate contamination requires Source Reduction Actions (S)
actions in four areas: (a) safe drinking water actions for Reducing nitrate loading to groundwater is possible, sometimes
affected areas, (b) reducing sources of nitrate contamination at a modest expense. But nitrate source reduction works slowly
to groundwater, (c) monitoring and assessment of ground- and cannot effectively restore all affected aquifers to drinking
water and drinking water, and (d) revenues to help fund water quality. Within the framework of Porter-Cologne, unless
solutions. Promising actions for legislative and state agency groundwater were to be de-designated as a drinking water
consideration in these areas appear below (see also Table source, reduction of nitrate loading to groundwater is required
ES-1). Starred (*) actions do not appear to require legislative to improve long-term water quality. The following options
action, but might benefit from it. seem most promising to reduce nitrate loading.
Safe Drinking Water Actions (D) S1: Education and Research. California Department of Food
Safe drinking water actions are the most effective and and Agriculture (CDFA), in cooperation with the University
economical short- and long-term approach to address of California and other organizations, develops and deliv-
nitrate contamination problems in the Tulare Lake Basin ers a comprehensive educational and technical program to
and Salinas Valley. These actions apply especially to small help farmers improve efficiency in nitrogen use (including
and self-supplied household water systems, which face the manure) and reduce nitrate loading to groundwater. This
6 Addressing Nitrate in California’s Drinking Water / Executive Summarycould include a groundwater nitrate–focused element for the contaminants, and consider expanding or building upon the
existing CDFA Fertilizer Research and Education Program, existing DPR program to include comprehensive nitrogen use
including “pump-and-fertilize” remediation and improved reporting to support nitrate discharge management.*
recharge options for groundwater cleanup.*
M4: Groundwater Data Task Force. CalEPA , in coordina-
S2: Nitrogen Mass Accounting Task Force. CalEPA estab- tion with CalNRA and CDPH, convenes an independently led
lishes a Task Force, including CDFA, to explore nitrogen mass State Groundwater Data Task Force to examine the efficacy of
balance accounting methods for regulating agricultural land current state and local efforts to collect, maintain, report, and
uses in areas at risk for nitrate contamination, and to compare use groundwater data for California’s groundwater quality
three long-term nitrogen source control approaches: (a) a cap and quantity problems.
and trade system; (b) farm-level nutrient management plans,
M5: Groundwater Task Force. CalEPA, CalNRA, and CDPH
standards, and penalties; and (c) nitrogen fertilizer fees.*
maintain a joint, permanent, and independently led State
S3: Fertilizer Excise Fee. Significantly raising the cost of Groundwater Task Force to periodically assess and coordi-
commercial fertilizer through a fee or excise tax would fund nate state technical and regulatory groundwater programs in
safe drinking water actions and monitoring and give further terms of effectiveness at addressing California’s groundwater
incentive to farmers for reducing nitrate contamination. An quality and quantity problems. These reports would be
equivalent fee or excise tax could be considered for organic incorporated into each California Water Plan Update.*
fertilizer sources (manure, green waste, wastewater effluent,
biosolids, etc.). Funding (F)
Little effective action can occur without funding. Four
S4: Higher Fertilizer Fee in Areas at Risk. Areas declared funding options seem most promising, individually or in
to be at risk for nitrate contamination might be authorized combination. State funding from fees on nitrogen or water
to maintain a higher set of excise fees on nitrogen fertilizer use, which directly affect nitrate groundwater contamination,
applications (including synthetic fertilizer, manure, waste seem particularly promising and appropriate.
effluent, biosolids, and organic amendments), perhaps as
part of a local safe drinking water compensation agreement. F1: Mill Fee. Increase the mill assessment rate on nitrogen
fertilizer to the full authorized amount (CAL. FAC Code Section
Monitoring and Assessment (M) 14611). This would raise roughly $1 million/year statewide
Monitoring and assessment is needed to better assess the and is authorized for fertilizer use research and education.*
evolving nitrate pollution problem and the effectiveness of
F2: Local Compensation Agreements. Regional Water
safe drinking water and nitrate source loading reduction
Boards can require and arrange for local compensation of
actions. Such activities should be integrated with other state
affected drinking water users under Porter-Cologne Act Water
agricultural, environmental, and land use management;
Code Section 13304. Strengthening existing authority, the
groundwater data; and assessment programs (source loading
Legislature could require that a Regional Water Board finding
reduction actions)—along with other drinking water, treat-
that an area is at risk of groundwater nitrate contamination
ment, and wastewater management programs (safe drinking
for drinking water be accompanied by a cleanup and abate-
water actions).
ment order requiring overlying, current sources of nitrate to
M1: Define Areas at Risk. Regional Water Boards designate financially support safe drinking water actions acceptable to
areas where groundwater sources of drinking water are at risk the local County Health Department. This might take the
of being contaminated by nitrate.* form of a local “liability district.”*
M2: Monitor at-Risk Population. CDPH and the State Water F3: Fertilizer Excise Fee. Introduce a substantial fee on
Board, in coordination with DWR and CDFA, issue a report nitrogen fertilizer sales or use, statewide or regionally, to fund
every 5 years to identify populations at risk of contaminated safe drinking water actions, nitrate source load reduction
drinking water and to monitor long-term trends of the state’s efforts, and nitrate monitoring and assessment programs.
success in providing safe drinking water as a supplement to
F4: Water Use Fee. A more comprehensive statewide fee
the California Water Plan Update.*
on water use could support many beneficial activities. Some
M3: Learn from Department of Pesticide Regulation of such revenues could fund management and safe drink-
Programs. CalEPA and CDFA examine successful DPR data ing water actions in areas affected by nitrate contamination,
collection, analysis, education, and enforcement programs including short-term emergency drinking water measures for
for lessons in managing nitrogen and other agricultural disadvantaged communities.
Addressing Nitrate in California’s Drinking Water / Executive Summary 7Table ES-1. Likely performance of promising state and agency actions for nitrate groundwater contamination.
Groundwater
Action Safe Drinking Water Economic Cost
Degradation
No Legislation Required
Safe Drinking Water Actions
D1: Point-of-Use Treatment Option for Small Systems + ♦♦ low
D2: Small Water Systems Task Force + ♦ low
D3: Regionalization and Consolidation of Small Systems + ♦♦ low
Source Reduction Actions
S1: Nitrogen/Nitrate Education and Research + ♦♦♦ low–moderate
S2: Nitrogen Accounting Task Force + ♦♦ low
Monitoring and Assessment
M1: Regional Boards Define Areas at Risk + ♦♦♦ ♦♦♦ low
M2: CDPH Monitors At-Risk Population + ♦ ♦ low
M3: Implement Nitrogen Use Reporting + ♦♦ low
M4: Groundwater Data Task Force + ♦ ♦ low
M5: Groundwater Task Force + ♦ ♦ low
Funding
F1: Nitrogen Fertilizer Mill Fee ♦♦♦ low
F2: Local Compensation Agreements for Water + ♦♦ ♦ moderate
New Legislation Required
D4: Domestic Well Testing * ♦♦ low
D5: Stable Small System Funds ♦ moderate
Non-tax legislation could also strengthen and augment existing authority.
Fiscal Legislation Required
Source Reduction
S3: Fertilizer Excise Fee ♦♦ ♦ moderate
S4: Higher Fertilizer Fee in Areas at Risk ♦ ♦ moderate
Funding Options
F3: Fertilizer Excise Fee ♦♦ ♦♦ moderate
F4: Water Use Fee ♦♦ ♦♦ moderate
♦ Helpful
♦♦ Effective
♦♦♦ Essential
+ Legislation would strengthen.
* County health departments may have authority; CDPH requires legislation.
8 Addressing Nitrate in California’s Drinking Water / Executive Summary1 Introduction
The development of California’s tremendous economy has not of community public water systems in California (serving
been without environmental costs. Since early in the twentieth 30 million residents) rely on groundwater for at least part
century, nitrate from agricultural and urban activities has slowly of their drinking water supply. In addition, approximately 2
infiltrated into groundwater. Nitrate has accumulated and spread million residents rely on groundwater from either a private
and will continue to make its way into drinking water supplies. domestic well or a smaller water system not regulated by the
The time lag between the application of nitrogen to the landscape state (State Water Board 2011). Intensive agricultural produc-
and its withdrawal at household and community public water tion, population growth, and—indirectly—partial restoration
supply wells, after percolating through soils and groundwater, of environmental instream flows have led to groundwater
commonly extends over decades. overdraft (Hanak et al. 2011). More protective health-based
This Report is an overview of groundwater contamina- water quality standards for naturally occurring water quality
tion by nitrate in the Tulare Lake Basin and Salinas Valley. constituents and groundwater contamination from urban and
We examine the extent, causes, consequences, and costs agricultural activities pose serious challenges to managing the
of this contamination, as well as how it will likely develop state’s drinking water supply.
over time. We also examine management and policy actions Nitrate is one of California’s most widespread
available for this problem, including possible nitrate source groundwater contaminants. Nitrate is among the most
reduction, provisions for safe drinking water, monitoring and frequently detected contaminants in groundwater systems
assessment, and aquifer remediation actions. The costs and around the world, including the extensively tapped aquifers in
institutional complexities of these options, and how they California’s Central Valley and Salinas Valley (Figure 1) (Spald-
might be funded, also are addressed. ing and Exner 1993; Burow et al. 2010; Dubrovsky et al. 2010;
Addressing nitrate contamination problems in the MCWRA 2010; Sutton et al. 2011). Nitrate contamination
Tulare Lake Basin and Salinas Valley will require decades poses an environmental health risk because many rural areas
to resolve, driven by the pace of groundwater flow and the obtain drinking water from wells that are often shallow and
response times of humans and institutions on the surface. vulnerable to contamination (Guillette and Edwards 2005; Fan
Nitrate in drinking water today is a legacy contaminant, but and Steinberg 1996).
years and decades from now the nitrate in drinking water High levels of nitrate affect human health. Infants
will be from today’s discharges. Assistance and management who drink water (often mixed with baby formula) containing
to improve drinking water supplies in response to nitrate nitrate in excess of the maximum contaminant level (MCL)
contamination is a central and urgent policy issue for the for drinking water may quickly become seriously ill and, if
State of California. Another major policy issue is the inevita- untreated, may die because high nitrate levels can decrease the
bility of widespread groundwater degradation for decades to capacity of an infant’s blood to carry oxygen (methemoglobin-
come, despite even heroic (and ultimately expensive) efforts emia, or “blue baby syndrome”). High nitrate levels may also
to reduce nitrate loading into aquifers. This introduction affect pregnant women and adults with hereditary cytochrome
attempts to put the issue in a larger context. b5 reductase deficiency. In addition, nitrate and nitrite inges-
Groundwater is essential to California. Ground- tion in humans has been linked to goitrogenic (anti-thyroid)
water is vital for California’s agricultural, industrial, urban, actions on the thyroid gland (similar to perchlorate), fatigue
and drinking water uses. Depending on drought conditions, and reduced cognitive functioning due to chronic hypoxia,
groundwater provides between one-third and nearly one-half maternal reproductive complications including spontaneous
of the state’s water supplies. As a source of drinking water, abortion, and a variety of carcinogenic outcomes deriving
groundwater serves people from highly dispersed rural from N-nitrosamines formed via gastric nitrate conversion in
communities to densely populated cities. More than 85% the presence of amines (Ward et al. 2005).
Addressing Nitrate in California’s Drinking Water / Introduction 9Nitrate is part of the natural nitrogen cycle in the Nitrogen is key to global food production. Modern environment. Groundwater nitrate is part of the global agricultural practices, using synthetically produced nitrogen nitrogen cycle. Like other key elements essential for life, fertilizer, have supplied the nitrogen uses of plants to increase nitrogen flows through the environment in a dynamic cycle food, fiber, feed, and fuel production for consumption by that supports organisms ranging from microbes to plants to humans and livestock. Agricultural production is driven by animals. Plants require nitrogen for growth, and scarcity of continued global growth in population and wealth, which fixed soil nitrogen often limits plant growth. Specialized micro- increases demand for agricultural products, particularly high- organisms can fix atmospheric elemental nitrogen and make it value agricultural products such as those produced in Cali- available for plants to use for photosynthesis and growth. The fornia. Global food, feed, and fiber demands are anticipated natural nitrogen cycle is a dynamic balance between elemental to increase by over 70% over the next 40 years (Tilman et al. nitrogen in the atmosphere and reactive forms of nitrogen 2002; De Fraiture et al. 2010). moving through the soil-plant-animal-water-atmosphere cycle of ecosystems globally. Production of synthetic nitrogen fertil- izer has disrupted this balance. Figure 1. Maximum reported raw-level nitrate concentration in community public water systems and state-documented state small water systems, 2006–2010. Source: CDPH PICME WQM Database (see Honeycutt et al. 2011). 10 Addressing Nitrate in California’s Drinking Water / Introduction
Intensive agriculture and human activities have             mg/L as nitrate-N). If nitrate levels in public drinking water
increased nitrate concentrations in the environment.               supplies exceed the MCL standard, mitigation measures must
Greater use of nitrogen-based fertilizers, soil amendments         be employed by water purveyors to provide a safe supply of
such as manure, and nitrogen-fixing cover crops add nitrogen       drinking water to the population at risk.
to deficient soils and dramatically raise crop yields. Techno-           The California Department of Food and Agriculture
logical advances in agriculture, manufacturing, and urban          (CDFA) and the Department of Water Resources (DWR) also
practices have increased levels of reactive forms of nitrogen,     have roles in nitrate management. The DWR is charged with
including nitrate, released into the atmosphere, into surface      statewide planning and funding efforts for water supply and
water, and into groundwater. The nearly 10-fold increase of        water quality protection, including the funding of Integrated
reactive nitrogen creation related to human activities over the    Regional Water Management Plans and DWR’s management
past 100 years (Galloway and Cowling 2002) has caused a            of urban and agricultural water use efficiency. CDFA collects
wide range of adverse ecological and environmental impacts         data, funds research, and promotes education regarding the
(Davidson et al. 2012).                                            use of nitrogen fertilizers and other nutrients in agriculture.
       The most remarkable impacts globally include the leach-           SBX2 1 Nitrate in Groundwater Report to Legis-
ing of nitrate to groundwater; the eutrophication of surface       lature. In 2008, the California legislature enacted Senate
waters and resultant marine “dead zones”; atmospheric depo-        Bill SBX2 1 (Perata), which created California Water Code
sition that acidifies ecosystems; and the emission of nitrogen     Section 83002.5. The bill requires the State Water Board
oxides (NOx) that deplete stratospheric ozone (Keeney and          to prepare a Report to the Legislature (within 2 years
Hatfield 2007; Beever et al. 2007; Foley et al. 2005). These       of receiving funding) to “improve understanding of the
widespread environmental changes also can threaten human           causes of [nitrate] groundwater contamination, iden-
health (Galloway et al. 2008; Guillette and Edwards 2005;          tify potential remediation solutions and funding sources
Galloway et al. 2004; Townsend et al. 2003; Vitousek et al.        to recover costs expended by the state for the purposes of
1997; Fan and Steinberg 1996; Jordan and Weller 1996).             this section to clean up or treat groundwater, and ensure
       California has decentralized regulatory responsibil-        the provision of safe drinking water to all communities.”
ity for groundwater nitrate contamination. Nitrate contami-        Specifically, the bill directs the State Water Board to
nation of groundwater affects two state agencies most directly.             identify sources, by category of discharger, of ground-
Sources of groundwater nitrate are regulated under California’s             water contamination due to nitrate in the pilot project
                                                                            basins; to estimate proportionate contributions to
Porter-Cologne Water Quality Control Act (Porter-Cologne)
                                                                            groundwater contamination by source and category of
administered through the State Water Resources Control                      discharger; to identify and analyze options within the
Board (State Water Board) and the Regional Water Quality                    board’s current authority to reduce current nitrate levels
                                                                            and prevent continuing nitrate contamination of these
Control Boards (Regional Water Boards). State Water Board
                                                                            basins and estimate the costs associated with exercis-
Resolution 88-63 designates drinking water as a beneficial use              ing existing authority; to identify methods and costs
in nearly all of California’s major aquifers. Under the Porter-             associated with the treatment of nitrate contaminated
                                                                            groundwater for use as drinking water; to identify
Cologne Act, dischargers to groundwater are responsible, first,
                                                                            methods and costs to provide an alternative water
for preventing adverse effects on groundwater as a source of                supply to groundwater reliant communities in each pilot
drinking water, and second, for cleaning up groundwater                     project basin; to identify all potential funding sources to
                                                                            provide resources for the cleanup of nitrate, groundwater
when it becomes contaminated.
                                                                            treatment for nitrate, and the provision of alternative
       Drinking water in public water systems (systems with                 drinking water supply, including, but not limited to,
at least 15 connections or serving at least 25 people for 60                State bond funding, federal funds, water rates, and fees
                                                                            or fines on polluters; and to develop recommendations
or more days per year) is regulated by CDPH under the
                                                                            for developing a groundwater cleanup program for the
federal Safe Drinking Water Act of 1972 (SWDA). CDPH                        Central Valley Water Quality Control Region and the
has set the nitrate MCL in drinking water at 45 mg/L (10                    Central Coast Water Quality Control Region based upon
                                                                            pilot project results.

                                                       Addressing Nitrate in California’s Drinking Water / Introduction              11
You can also read