GIS-Based Identification of Areas that have Resource Potential for Lode Gold in Alaska
←
→
Page content transcription
If your browser does not render page correctly, please read the page content below
Prepared in cooperation with the Alaska Division of Geological & Geophysical Surveys and the
Bureau of Land Management

GIS-Based Identification of Areas that have Resource
Potential for Lode Gold in Alaska

Open-File Report 2021–1041

U.S. Department of the Interior
U.S. Geological Survey
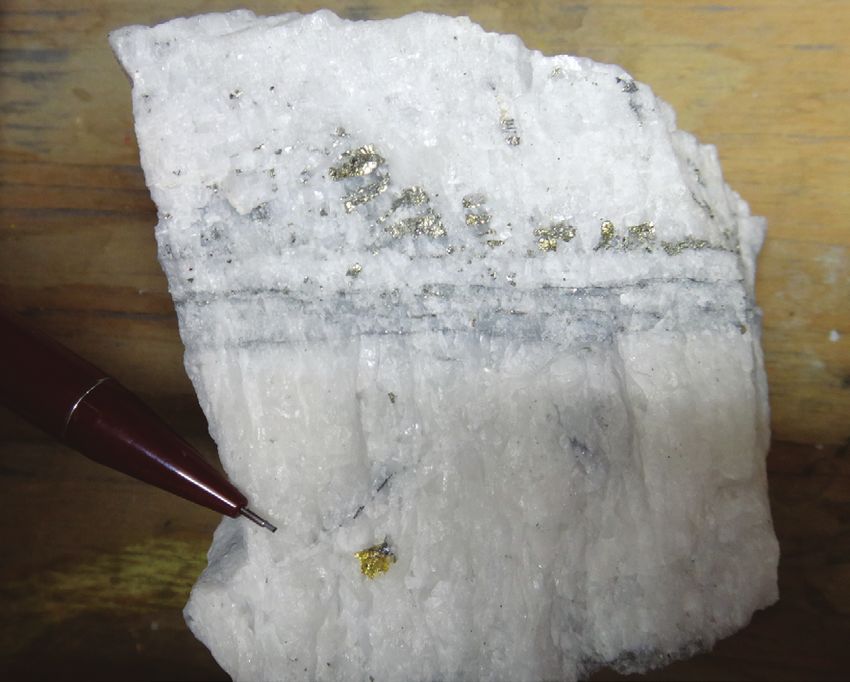
Cover. Photograph of gold, tellurides, and sulfide minerals in quartz from the Kensington Mine,
southeastern Alaska. Pencil for scale. Photograph taken by Susan Karl, USGS.
GIS-Based Identification of Areas that have
Resource Potential for Lode Gold in Alaska

By Susan M. Karl, Douglas C. Kreiner, George N.D. Case, Keith A. Labay, Nora B.
Shew, Matthew Granitto, Bronwen Wang, and Eric D. Anderson

Prepared in cooperation with the Alaska Division of Geological & Geophysical
Surveys and the Bureau of Land Management

Open-File Report 2021–1041

U.S. Department of the Interior
U.S. Geological Survey
U.S. Geological Survey, Reston, Virginia: 2021

For more information on the USGS—the Federal source for science about the Earth, its natural and living
resources, natural hazards, and the environment—visit https://www.usgs.gov or call 1–888–ASK–USGS.
For an overview of USGS information products, including maps, imagery, and publications,
visit https://store.usgs.gov.

Any use of trade, firm, or product names is for descriptive purposes only and does not imply endorsement by the
U.S. Government.

Although this information product, for the most part, is in the public domain, it also may contain copyrighted materials
as noted in the text. Permission to reproduce copyrighted items must be secured from the copyright owner.

Suggested citation:
Karl, S.M., Kreiner, D.C., Case, G.N.D., Labay, K.A., Shew, N.B., Granitto, M., Wang, B., and Anderson, E.D., 2021, GIS-
based identification of areas that have resource potential for lode gold in Alaska: U.S. Geological Survey Open-File
Report 2021–1041, 75 p., 9 plates, https://doi.org/10.3133/ofr20211041.

Associated data for this publication:
Karl, S.M., Kreiner, D.C., Case, G.N.D., Labay, K.A., Shew, N.B., Granitto, Matthew, Wang, Bronwen, and Anderson,
E.D., 2021, Data and results for GIS-based identification of areas that have resource potential for lode gold in Alaska:
U.S. Geological Survey data release, https://doi.org/10.5066/P9CAM3F9.

ISSN 2331-1258 (online)
iii

Contents
Acknowledgements......................................................................................................................................vii
Abstract............................................................................................................................................................1
Introduction.....................................................................................................................................................1
     Purpose and Scope...............................................................................................................................2
     Lode Gold Deposit Definition and Classification..............................................................................2
           Orogenic Gold Deposits ..............................................................................................................3
           Intrusion-related Gold Deposits ................................................................................................3
           Epithermal Gold Deposits ...........................................................................................................3
Data Types and Analytical Process ............................................................................................................4
     National Hydrography Dataset and Watershed Boundary Dataset..............................................5
     Geochemical Data Sources.................................................................................................................5
           Sediment Geochemical Data......................................................................................................5
           Rock Geochemical Data..............................................................................................................6
           Heavy Mineral Concentrate Mineral and Geochemical Data...............................................7
     Alaska Resource Data File ..................................................................................................................7
     Geologic Map of Alaska ......................................................................................................................8
     Aerial Magnetic Survey Data..............................................................................................................8
GIS-Based Methods ......................................................................................................................................8
Chapter 1. Lode Gold Deposits—Undivided ..............................................................................................9
     Deposit Group Characteristics ...........................................................................................................9
     Mineral Resource Potential Estimation Method ...........................................................................10
           Lithology ......................................................................................................................................10
           Alaska Resource Data File........................................................................................................10
           Rock and Sediment Geochemical Data..................................................................................10
           Heavy Mineral Concentrate Data ...........................................................................................11
     Results and Discussion ......................................................................................................................11
           Areas that have Known and Newly Recognized Prospectivity for Lode Gold Deposits.11
                    Northern Alaska.................................................................................................................11
                    Northwestern Alaska........................................................................................................11
                    East-Central Alaska...........................................................................................................12
                    Southwestern Alaska........................................................................................................12
                    South-Central and Southeastern Alaska.......................................................................12
     Conclusions .........................................................................................................................................13
Chapter 2. Orogenic Gold Deposits............................................................................................................13
     Deposit Group Characteristics .........................................................................................................13
     Mineral Resource Potential Estimation Method............................................................................14
           Lithology ......................................................................................................................................14
           Alaska Resource Data File .......................................................................................................14
           Rock and Sediment Geochemical Data .................................................................................14
           Heavy Mineral Concentrate Data ...........................................................................................15
     Results and Discussion ......................................................................................................................15
           Areas that have Known and Newly Recognized Prospectivity for Orogenic Gold
                         Deposits..........................................................................................................................15
                    Northern Alaska.................................................................................................................15
iv
Seward Peninsula and North-Central Alaska...............................................................16
East-Central Alaska...........................................................................................................16
Southwestern Alaska........................................................................................................17
Western Alaska Range.....................................................................................................18
South-Central Alaska........................................................................................................18
Southeastern Alaska.........................................................................................................19
Conclusions..........................................................................................................................................20
Chapter 3. Reduced Intrusion-Related Gold Deposits............................................................................20
Deposit Group Characteristics..........................................................................................................20
Mineral Resource Potential Estimation Method............................................................................21
Lithology.......................................................................................................................................21
Alaska Resource Data File........................................................................................................21
Rock and Sediment Geochemical Data..................................................................................22
Heavy Mineral Concentrate Data............................................................................................22
Aerial Magnetic Survey Data...................................................................................................22
Results and Discussion ......................................................................................................................22
Areas that have Known and Newly Recognized Prospectivity for Intrusion-Related
Gold Deposits ................................................................................................................22
Northern Alaska.................................................................................................................23
East-Central Alaska...........................................................................................................23
Southwestern Alaska........................................................................................................24
Western Alaska Range.....................................................................................................25
Central and Eastern Alaska Range.................................................................................25
South-Central and Southeastern Alaska.......................................................................26
Conclusions..........................................................................................................................................26
Chapter 4. Epithermal Gold Deposits ........................................................................................................26
Deposit Group Characteristics .........................................................................................................27
Mineral Resource Potential Estimation Method............................................................................27
Lithology.......................................................................................................................................27
Alaska Resource Data File........................................................................................................28
Rock and Sediment Geochemical Data..................................................................................28
Heavy Mineral Concentrate Data............................................................................................28
Aerial Magnetic Survey Data...................................................................................................28
Results and Discussion ......................................................................................................................29
Areas that have Known and Newly Recognized Prospectivity for Epithermal Gold
Deposits .........................................................................................................................29
Alaska Peninsula and Aleutian Islands..........................................................................29
Kuskokwim Mountains......................................................................................................29
Alaska Range......................................................................................................................30
Eastern Alaska...................................................................................................................30
Southeastern Alaska.........................................................................................................30
Conclusions..........................................................................................................................................30
Chapter 5. Discussion of Discrimination of Lode Gold Deposit Types.................................................31
Method to Evaluate Deposit Model Overlap...................................................................................31
Results and Discussion.......................................................................................................................32v
Chapter 6. Gold-Bearing Porphyry and Epithermal Gold Deposits.......................................................32
Deposit Group Characteristics..........................................................................................................33
Mineral Resource Potential Estimation Method............................................................................33
Lithology.......................................................................................................................................33
Alaska Resource Data File........................................................................................................33
Rock and Sediment Geochemical Data..................................................................................34
Heavy Mineral Concentrate Data............................................................................................34
Aerial Magnetic Survey Data...................................................................................................34
Results and Discussion.......................................................................................................................35
Areas that have Known Prospectivity for Gold-Bearing Porphyry and Epithermal Gold
Deposits..........................................................................................................................35
Areas that have Newly Recognized Prospectivity for Gold-Bearing Porphyry and
Epithermal Gold Deposits in Alaska...........................................................................35
Conclusions..........................................................................................................................................36
Chapter 7. Reduced Intrusion-Related and Orogenic Gold Deposits...................................................36
Deposit Group Characteristics .........................................................................................................36
Mineral Resource Potential Estimation Method ...........................................................................36
Lithology ......................................................................................................................................37
Alaska Resource Data File .......................................................................................................37
Rock and Sediment Geochemical Data .................................................................................37
Heavy Mineral Concentrate Data ...........................................................................................37
Aerial Magnetic Survey Data...................................................................................................37
Results and Discussion ......................................................................................................................38
Areas that have Known Prospectivity for Reduced-Intrusion-Related and Orogenic
Gold Deposits ................................................................................................................38
Areas that have Newly Recognized Prospectivity for Reduced-Intrusion-Related and
Orogenic Gold Deposits ..............................................................................................38
Conclusions..........................................................................................................................................38
Chapter 8. Discussion of Discrimination of Lode Gold Deposit Types Using Model Combinations
Based on Ore-forming Environments...........................................................................................39
Method to Evaluate Deposit Model Group Overlap ......................................................................39
Results and Discussion.......................................................................................................................39
Summary and Conclusions .........................................................................................................................39
Data Resources.............................................................................................................................................42
References Cited..........................................................................................................................................43
Appendix 1. Statistical Calculations of Levels of Background Values for Sediment and Rock
Geochemical Data...........................................................................................................................53
Appendix 2. Alaska Resource Data File (ARDF) Mineral-Deposit-Keyword-and-Scoring
Templates..........................................................................................................................................53
Appendix 3. Lithology-Keyword Search Terms for the “Geologic Map of Alaska” ..........................53
Reference Cited...................................................................................................................................53
Figure
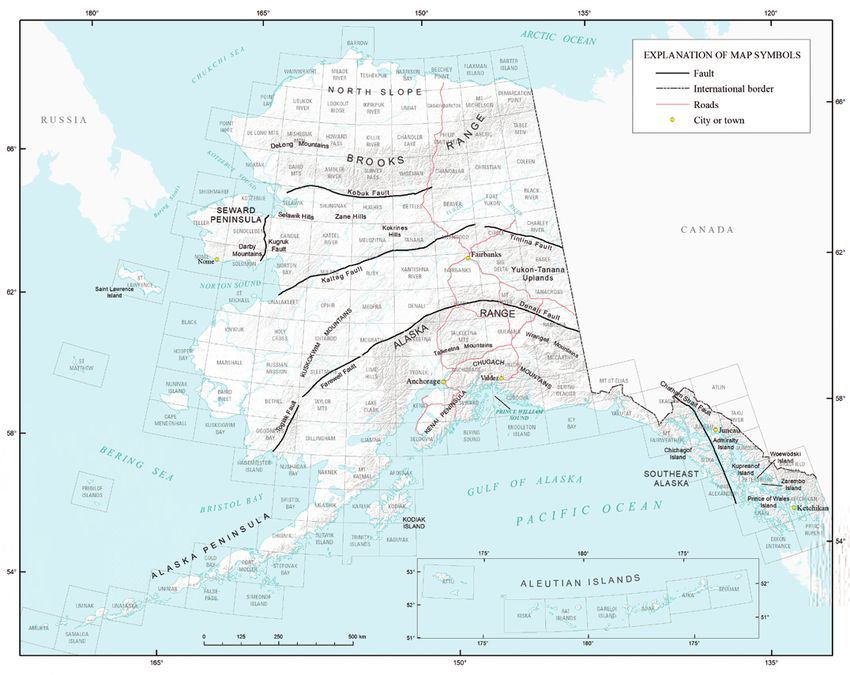
1. Physiographic map of Alaska showing place names and major faults, which provide a
reference frame for locating regional trends in prospectivity.............................................42vi
Tables
1. Lode gold deposit types in Alaska that were considered in this study and their com-
modities, characteristics, representative localities, and references.................................54
2. Scoring template for analysis of undivided lode gold potential within each hydrologic
unit code (HUC) in Alaska. .........................................................................................................56
3. Mineral resource potential versus certainty classification matrix for undivided lode
gold deposits in Alaska...............................................................................................................59
4. Scoring template for analysis of potential for orogenic gold deposits within each hydro-
logic unit code (HUC) in Alaska. ........................................................................................................60
5. Mineral resource potential versus certainty classification matrix for orogenic gold
deposits in Alaska........................................................................................................................62
6. Scoring template for analysis of potential for intrusion-related gold deposits within
each hydrologic unit code (HUC) in Alaska. ...........................................................................62
7. Mineral resource potential versus certainty classification matrix for intrusion-related
lode gold deposits in Alaska......................................................................................................64
8. Scoring template for analysis of potential for epithermal gold deposits within each
hydrologic unit code (HUC) in Alaska. .....................................................................................64
9. Mineral resource potential versus certainty classification matrix for epithermal gold
deposits in Alaska........................................................................................................................66
10. Scoring template for analysis of potential for porphyry and epithermal gold deposits
within each hydrologic unit code (HUC) in Alaska. ...............................................................66
11. Mineral resource potential versus certainty classification matrix for porphyry and
epithermal gold deposits in Alaska...........................................................................................69
12. Scoring template for analysis of potential for reduced-intrusion-related and orogenic
gold deposits within each hydrologic unit code (HUC) in Alaska. ......................................69
13. Mineral resource potential versus certainty classification matrix for reduced-intrusion-
related and orogenic gold deposits in Alaska........................................................................72
14. Summary of primary discriminating parameters for GIS-based prospectivity analyses
for lode gold..................................................................................................................................73
Plates
[Available online at https://doi.org/10.3133/ofr20211041]
1. Estimated Resource Potential and Certainty for Lode Gold—Undivided Deposits
2. Estimated Resource Potential and Certainty for Lode Gold—Undivided Deposits and
Alaska Resource Data File Localities
3. Estimated Resource Potential and Certainty for Orogenic Gold Deposits
4. Estimated Resource Potential and Certainty for Reduced Intrusion-related Gold Deposits
5. Estimated Resource Potential and Certainty for Epithermal Gold Deposits
6. Map Showing Overlap of Orogenic, Intrusion-related and Epithermal Gold Deposit
Prospectivity Maps
7. Estimated Resource Potential and Certainty for Combined Gold-bearing Porphyry and
Epithermal Gold Deposits
8. Estimated Resource Potential and Certainty for Combined Reduced Intrusion-related
and Orogenic Gold Deposits
9. Map Showing Overlap of Gold-bearing Porphyry-Epithermal Gold and Reduced
Intrusion-related-Orogenic Gold Deposit Prospectivity Mapsvii
Acknowledgments
Special thanks to Garth Graham, U.S. Geological Survey, and Melanie Werdon, Alaska Division
of Geological & Geophysical Surveys, for constructive and helpful reviews. Thanks also to John
Hoppe, Bureau of Land Management, for helpful data and discussions.
Conversion Factors
U.S. customary units to International System of Units
Multiply By To obtain
Length
inch (in.) 2.54 centimeter (cm)
inch (in.) 25.4 millimeter (mm)
foot (ft) 0.3048 meter (m)
mile (mi) 1.609 kilometer (km)
mile, nautical (nmi) 1.852 kilometer (km)
yard (yd) 0.9144 meter (m)
Area
acre 0.004047 square kilometer (km2)
square foot (ft2) 929.0 square centimeter (cm2)
square foot (ft ) 2
0.09290 square meter (m2)
square inch (in2) 6.452 square centimeter (cm2)
section (640 acres or 1 square mile) 259.0 square hectometer (hm2)
square mile (mi2) 259.0 hectare (ha)
square mile (mi ) 2
2.590 square kilometer (km2)
cubic inch (in3) 16.39 cubic centimeter (cm3)
cubic inch (in )
3
0.01639 cubic decimeter (dm3)
cubic foot (ft3) 28.32 cubic decimeter (dm3)
cubic foot (ft )
3
0.02832 cubic meter (m3)
cubic yard (yd3) 0.7646 cubic meter (m3)
cubic mile (mi ) 3
4.168 cubic kilometer (km3)
acre-foot (acre-ft) 1,233 cubic meter (m3)
acre-foot (acre-ft) 0.001233 cubic hectometer (hm3)
Mass
ounce, avoirdupois (oz) 28.35 gram (g)
pound, avoirdupois (lb) 0.4536 kilogram (kg)
ton, short (2,000 lb) 0.9072 metric ton (t)
ton, long (2,240 lb) 1.016 metric ton (t)
Pressure
atmosphere, standard (atm) 101.3 kilopascal (kPa)
bar 100 kilopascal (kPa)
Density
pound per cubic foot (lb/ft3) 16.02 kilogram per cubic meter (kg/m3)
pound per cubic foot (lb/ft3) 0.01602 gram per cubic centimeter (g/cm3)viii
International System of Units to U.S. customary units
Multiply By To obtain
Length
centimeter (cm) 0.3937 inch (in.)
millimeter (mm) 0.03937 inch (in.)
meter (m) 3.281 foot (ft)
kilometer (km) 0.6214 mile (mi)
kilometer (km) 0.5400 mile, nautical (nmi)
meter (m) 1.094 yard (yd)
Area
square meter (m2) 0.0002471 acre
hectare (ha) 2.471 acre
square hectometer (hm2) 2.471 acre
square kilometer (km ) 2
247.1 acre
square centimeter (cm2) 0.001076 square foot (ft2)
square meter (m ) 2
10.76 square foot (ft2)
square centimeter (cm2) 0.1550 square inch (ft2)
square hectometer (hm ) 2
0.003861 section (640 acres or 1 square mile)
hectare (ha) 0.003861 square mile (mi2)
square kilometer (km ) 2
0.3861 square mile (mi2)
Volume
cubic centimeter (cm ) 3
0.06102 cubic inch (in3)
cubic decimeter (dm3) 61.02 cubic inch (in3)
cubic decimeter (dm ) 3
0.03531 cubic foot (ft3)
cubic meter (m3) 35.31 cubic foot (ft3)
cubic meter (m ) 3
1.308 cubic yard (yd3)
cubic kilometer (km3) 0.2399 cubic mile (mi3)
cubic meter (m ) 3
0.0008107 acre-foot (acre-ft)
cubic hectometer (hm3) 810.7 acre-foot (acre-ft)
Mass
gram (g) 0.03527 ounce, avoirdupois (oz)
kilogram (kg) 2.205 pound avoirdupois (lb)
metric ton (t) 1.102 ton, short [2,000 lb]
metric ton (t) 0.9842 ton, long [2,240 lb]
Pressure
kilopascal (kPa) 0.009869 atmosphere, standard (atm)
kilopascal (kPa) 0.01 bar
Density
kilogram per cubic meter (kg/m3) 0.06242 pound per cubic foot (lb/ft3)
gram per cubic centimeter (g/cm ) 3
62.4220 pound per cubic foot (lb/ft3)
Temperature in degrees Celsius (°C) may be converted to degrees Fahrenheit (°F) as
°F = (1.8 × °C) + 32.
Temperature in degrees Fahrenheit (°F) may be converted to degrees Celsius (°C) as
°C = (°F – 32) / 1.8.ix Datum Horizontal coordinate information is referenced to the North American Datum of 1983 (NAD 83). Altitude, as used in this report, refers to distance above the vertical datum. Abbreviations ADGGS Alaska Division of Geological & Geophysical Surveys AGDB Alaska Geochemical Database AGDB3 Alaska Geochemical Database, version 3 ARDF Alaska Resource Data File GIS geographic information system HUC hydrologic unit code HMC heavy-mineral concentrate NURE National Uranium Resource Evaluation RIRG reduced-intrusion-related gold USGS U.S. Geological Survey
x
GIS-Based Identification of Areas that have Resource
Potential for Lode Gold in Alaska

By Susan M. Karl, Douglas C. Kreiner, George N.D. Case, Keith A. Labay, Nora B. Shew, Matthew Granitto,
Bronwen Wang, and Eric D. Anderson

Abstract                                                                     Data-driven GIS analysis for lode gold potential in
                                                                       Alaska, although limited by the size and uneven coverage of
      Several comprehensive, data-driven geographic                    available datasets, objectively indicates prospectivity in areas
information system (GIS) analyses were conducted to assess             where exposure is good as well as in areas under cover. The
prospectivity for lode gold in Alaska. These analyses use              results of our analyses show medium to high prospectivity
available geospatial datasets of lithologic, geochemical,              in areas that surround known deposits, indicating an overall
                                                                       expansion of areas that have the potential to contain gold
mineral occurrence, and geophysical data to build models
                                                                       deposits. Exploration in these areas may help improve the
for recognizing different types of gold deposits within
                                                                       balance between the volume of gold produced in placer
physiographic units defined by stream drainage basins that are
                                                                       districts statewide and the relatively low volume of identified
approximately 100 square kilometers in area. The analytical
                                                                       lode resources that contribute to these placer deposits. The
methods successfully delineated areas in the State that
                                                                       results of our analyses can help focus future investigations
contain known lode gold deposits and occurrences, providing
                                                                       in areas that show prospectivity but are not known to contain
some measure of confidence in their ability to predict gold
                                                                       gold deposits, as well as in areas where data are lacking and
prospectivity in areas of unknown lode gold potential. The
                                                                       the geology is poorly understood, and acquisition of additional
results of our analyses indicate high prospectivity in a few
                                                                       data may help better define and constrain gold prospectivity.
areas scattered around the State that are not known to contain
lode gold deposits.
      In addition to assessing the potential for lode gold
deposits in Alaska, we designed analyses to distinguish                Introduction
different lode gold deposit types, including orogenic,
reduced-intrusion-related, epithermal, and gold-bearing por-                 Gold is a primary commodity that is mined from both
phyry. These can primarily be differentiated using their unique        lode and placer deposits in Alaska. Exploration strategies
trace element geochemical fingerprints and elemental enrich-           for finding gold deposits commonly focus on a deposit type
ments, which reflect the characteristics of the geologic environ-      that geologists expect to find in a region. This expectation
ment and chemistry of the ore-forming fluids. We identified            is based on regional geology, known occurrences, and
multiple parameters that would discriminate the different types        possibly a regional geochemical survey. In Alaska, handicaps
of gold deposits, but owing to the limits of available data, the       to the determination of gold resource potential include
compositional similarity of ore-forming fluids among some              covered or poorly understood geology in many areas,
types of lode gold deposits, and overlapping geologic environ-         clustering of known occurrences in areas that have more
ments, distinguishing deposit types at the state scale in Alaska       robust infrastructure, and ambiguous data from available
remains problematic. These limitations resulted in overlapping         geochemical and geophysical surveys.
areas of prospectivity for different deposit types, highlight-               A geographic information system (GIS) data-driven
ing the challenges for targeted gold exploration in Alaska.            analysis of the potential and relative certainty for lode gold
Adjustment of some scoring parameters and recharacterization           occurrences was conducted to assess prospectivity in Alaska,
at smaller scales to highlight individual mineral systems for          including areas under ice, snow, or vegetative cover that have
application of prospectivity analyses may be helpful at a district     unknown mineral potential; areas underlain by favorable
scale. At a regional scale, the aerial overlap of individual deposit   geology; and areas that have known occurrences. The analysis
type analyses reinforces confidence in prospectivity for a lode        combines multiple data layers to evaluate the geologic setting,
gold resource in a drainage basin. Our analysis for undivided          rock types, minerals, pathfinder element enrichments, and
lode gold deposits will be the most practical analysis for land-       geophysical favorability of areas defined geographically
use decisions in which delineation of areas that have confident        by drainage basins statewide with respect to a potential
potential for gold deposits in general is the primary goal.            concentration of gold.
2 GIS-Based Identification of Areas that have Resource Potential for Lode Gold in Alaska
Our first-order analysis was to identify potential for any can form by complicated genetic processes or by discrete
type of lode gold deposit, which we refer to as undivided events that overlap in space and time, it may be difficult to
lode gold deposits. Our second-order analyses attempted discriminate different deposit types. We discuss the benefits
to target specific gold deposit types to (1) achieve a tighter and cautions in the application of available datasets at the state
spatial constraint of prospectivity relative to that of undivided scale for digitally analyzing the potential for various types
lode gold deposits, (2) apply specific parameters to assist in of gold deposits and how to improve and complement these
focusing future exploration for gold, and (3) more precisely datasets for future analyses.
define potential for gold deposits in covered areas. In addition, The methods used here are applicable to other deposit
owing to the correlation of deposit types with distinct tectonic types and other commodities. Publicly available digital data-
settings, the inferred distribution of a deposit type resulting sets contain geologic information that can be used to charac-
from prospectivity analysis in an area of poor exposure and terize most deposit types and groups, although available data
unknown geology may serendipitously contribute to knowledge may not be adequate to discriminate between all deposit types
of regional geologic settings and tectonic belts. within a deposit group. The evaluation of some deposit types
in Alaska can be limited owing to the reconnaissance level of
geologic mapping and the lack of available geochemical and
Purpose and Scope geophysical data, information that could provide sufficient
detail to target specific deposit types within a group of related
Lode gold was chosen for evaluation in the analyses herein
deposits. At a district scale where appropriate data are avail-
because it is a major focus for exploration and development in
able, deposit-specific tailored analyses can be very effective.
Alaska, and important to Alaska’s economy. The potential dis-
Exploration strategies may focus on gold systems which
tribution of resources such as gold must be evaluated to aid land
are high-grade, low-tonnage, structurally controlled, bonanza-
stewardship decisions. The data-driven GIS analyses employed
type vein systems or they may target large-tonnage, dissemi-
herein allow the relative potential for gold concentration to be
nated, and relatively low grade deposits. For applications such
considered objectively with respect to various possible land uses
as land-use management, regulation, and planning, it may
and integrated with other types of geospatial data to inform land
be important simply to know whether there is potential for
use decisions from local and regional perspectives.
significant gold resources in an area of interest, regardless of
The GIS analytical method used in our analyses was
the attributes of the system. To address overall prospectivity for
designed to identify areas with geologic potential for lode gold,
lode gold deposits statewide, we combined the key parameters
both known and undiscovered, in Alaska. It is not a compre-
for all gold deposit types to derive a map showing the potential
hensive review of known mines, prospects, occurrences, or
for undivided lode gold deposits in Alaska. To address explora-
mineral deposits that contain gold in the State. Instead, it is an
tion strategies for specific types of gold deposits, we created
evaluation of where in Alaska lode gold deposits might occur
individual maps that show prospectivity for the main types of
based on geoscientific data, including geology (for example,
lode gold deposits that are known or likely to occur in Alaska.
lithology, mineralogy, known prospects), geochemistry (of rock
and sediment samples), and geophysical properties. Comparison
of lode and placer deposit records in the Alaska Resource Data Lode Gold Deposit Definition and Classification
File (ARDF, https://ardf.wr.usgs.gov/; U.S. Geological Survey,
undated) indicates that as much as two-thirds of the recognized Lode gold deposits are concentrations of gold that occur
placer deposits do not have associated lode sources or sources as native gold and (or) are concentrated in gold-bearing miner-
of a size comparable to the volume of production from a placer als in rocks. Numerous magmatic and tectonic settings are
mine or district. This indicates a high potential for discovery of amenable to the formation of lode gold deposits and result in a
previously unrecognized lode deposits, and our integrated data variety of deposit types.
analyses can contribute to this exploration. The main requirements for gold mineralization are a metal
In addition to evaluating the potential for lode gold source, mobilization of hydrothermal fluids that carry gold, and
deposits, more nuanced construction of data models can be a physical or chemical trap to induce gold deposition. Discrimi-
applied for guiding exploration for specific types of gold nation of and exploration for various hydrothermal systems
deposits such as orogenic, intrusion-related, gold-bearing that may have carried gold rely on a detailed understanding of
porphyries, and epithermal gold. Accordingly, although fundamental geologic and geochemical processes operating in
our primary analysis in this report involves compiling and various geologic environments, available sources of fluids, host
scoring parameters to identify potential for lode gold deposits rock compositions, and potential traps. Lithologic, geochemical,
statewide, undivided with respect to deposit type, subsequent and geophysical data provide critical clues for discerning these
analyses focus on specific deposit types to facilitate increased processes and environments as well as for guiding exploration
efficiency in gold exploration. We attempt to determine and resource assessments. Placer gold deposits are an important
discriminating factors in gold systems that sometimes form spatial clue; they extend across large areas of Alaska but most
in distinct circumstances. Deposit-specific parameters of them lack known lode sources. These areas cover a variety of
can be weighted according to their relative importance in geologic settings, implying a corresponding variety in the types
characterizing a deposit. However, because gold deposits of lode sources for the placers.Introduction 3
The broadest classification of lode gold occurrences with high oxidation state systems or reduced systems. In large
falls into four main types of deposits: (1) orogenic (or regions of central Alaska and Yukon, economic concentrations
mesothermal) veins, (2) magmatic-hydrothermal (or intrusion- of gold in intrusive rocks are mainly associated with reduced
related), (3) terrestrial hydrothermal (or epithermal vein) or ilmenite-series systems (Thompson and Newberry, 2000;
systems, and (4) disseminated sediment-hosted gold. The Hart and others, 2004a; Hart, 2007). Owing to the importance
primary lode gold deposit types, which are listed with their of this association, we conducted a GIS analysis to evaluate
primary global and Alaskan examples, are compiled in the prospectivity for reduced-intrusion-related gold (RIRG)
table 1. Some well-known Alaskan deposits, including the in chapter 3. Porphyry copper (such as the Pebble deposit in
Pogo mine and the Donlin Creek prospect, are not listed on Alaska) and other high oxidation state, or magnetite-series
table 1 because classification of their deposit type is highly intrusive systems, may carry large amounts of gold, and these
debated. Deposits of disseminated sediment-hosted gold, such systems are addressed separately in chapter 6.
as the well-known Carlin trend in the State of Nevada, form
in continental extensional settings and no analogs are known
in Alaska. Based on the current understanding of this deposit Epithermal Gold Deposits
type and regional geology, it is not considered likely to be
Epithermal vein systems form in the uppermost crust
found in Alaska, and so was not addressed in our individual
(4 GIS-Based Identification of Areas that have Resource Potential for Lode Gold in Alaska
Data Types and Analytical Process In this report, potential mineral resource is defined as the
potential for the occurrence of a concentration of a mineral
We identified the key characteristics of gold deposit resource, in this case gold. It does not imply potential for
types that are retrievable from available datasets and scored economically viable development or extraction of the min-
geospatially qualified data with respect to relative importance eral resource. This study separates four levels of mineral
for indicating the potential for resource occurrence using GIS resource potential using natural statistical breaks, qualified
analysis. To evaluate resource potential across the landscape by the certainty of the analysis based on the presence and
(Fortescue, 1992), we chose drainage basins as our unit of abundance of favorable attributes for each deposit type. The
analysis and selected the smallest drainage basins available product of the analysis is a map for each deposit group which
in the National Hydrography dataset (http://nhd.usgs.gov/), indicates the relative level (High, Medium, Low, Unknown) of
designated as 12-digit hydrologic unit codes (HUCs), each of resource potential, and the relative level (High, Medium, Low,
which covers approximately 100 km2. Our GIS analysis could Unknown) of the certainty of the specific deposit type for all
alternatively be applied to a different areal unit of evaluation, of the 12-digit HUCs within Alaska (plates 1–9).
such as a square mile grid. However, data density sufficient to In accord with previous work (Taylor and Steven, 1983;
evaluate by a square mile grid is rare in Alaska and is typically Goudarzi, 1984) and as defined below, the four levels (High,
available only for selected, relatively small areas of inter- Medium, Low, and Unknown) of resource potential are
est, which could introduce local bias in a regional analysis. assigned in our analyses as follows:
Because sediment geochemistry is our most regionally robust 1. High mineral resource potential is assigned to areas where
dataset, sediment sources are the key target for resource analy- geologic, mineralogic, geochemical, mineral occurrence,
sis, and therefore drainage basins are the most logical and and geophysical characteristics indicate a geologic envi-
efficient unit for evaluation in our analyses. ronment favorable for resource occurrence; where inter-
The geospatial datasets assembled for analysis using pretations of data indicate a high degree of likelihood for
ArcGIS include (1) bedrock geology from the digital geologic resource accumulation; where data indicating the presence
map of Alaska (Wilson and others, 2015); (2) known mineral of resources support mineral deposit models; and where
deposits and occurrences in the Alaska Resource Data File evidence indicates that mineral concentration has taken
(ARDF, https://ardf.wr.usgs.gov/; U.S. Geological Survey, place. Resources or deposits need not be previously iden-
undated); (3) geochemical data for rock, sediment, soil, and tified for an area to be assigned high resource potential.
heavy-mineral concentrate (HMC) samples from the Alaska
Geochemical Database (AGDB; Granitto and others, 2013, 2. Medium mineral resource potential is assigned to areas
2019); and (4) the digital aeromagnetic map of Alaska (Saltus where geologic, mineralogic, geochemical, mineral
and Simmons, 1997; https://mrdata.usgs.gov/airborne/map. occurrence, and geophysical characteristics indicate a
html; https://mrdata.usgs.gov/general/map-ak.html). geologic environment favorable for resource occurrence;
A data scoring and ranking process for each data type where interpretations of data indicate a reasonable likeli-
was tailored to critical parameters for each lode gold deposit hood of resource accumulation; and where an application
type described above. For each analysis, data types were of mineral deposit models indicates favorable ground for
chosen and ranked according to their ability to objectively concentration of the specified type(s) of minerals.
and uniquely define a deposit type; data types were scored
according to their relevance to the deposit type and weighted 3. Low mineral resource potential is assigned to areas
according to their ability to discriminate that deposit type. where geologic, mineralogic, geochemical, mineral
Associated tables indicate the datasets that were applied in the occurrence, and geophysical characteristics define a geo-
analysis for each deposit type, the parameters in the datasets logic environment in which the existence of the specific
that were chosen, and the weighting of each parameter (tables resource is unlikely.
2–13); a complete summary is given in table 14. Appendixes
4. Unknown mineral resource potential is assigned to
1–3 provide information used to select and weight parameters
areas where information is inadequate to assign High,
that contributed to the scoring results (Karl and others, 2021)
Medium, or Low levels of resource potential.
for each deposit type. The scores for each parameter were
statistically analyzed and combined using a Python script to In accord with previous work (Taylor and Steven, 1983;
yield a total score for resource potential for each HUC. The Goudarzi, 1984), the four levels (High, Medium, Low, and
percentages of the total score that each parameter contributed Unknown) of certainty are assigned as follows:
to each HUC are tabulated in Karl and others (2021). ArcGIS 1. High certainty is assigned to areas for which available
permits users to analyze and query the findings in a spatial information from multiple sources provides a robust
context (individual HUCs) on each of the final digital map indication of the level of mineral resource potential.
products (plates 1–9). Users can manipulate parameters and
scoring with a Python script in ArcGIS to test for different 2. Medium certainty is assigned to areas for which avail-
attributes if they wish to attempt additional analyses at a able information is sufficient to give a reasonable indica-
regional, district, or local scale. tion of the level of mineral resource potential.Data Types and Analytical Process 5
3. Low certainty is assigned to areas for which available streams; some 12-digit HUCs refer to subdivisions of large
information is limited and only indicates a level of min- drainages. The datasets described below were scored for appli-
eral resource potential. cation to each 12-digit HUC across the State as they pertained
to specific gold deposit types, and scores were statistically
4. Unknown certainty is assigned to areas for which avail- analyzed and classified for mineral resource favorability fol-
able information is not adequate for determination of the lowing the methods described below.
level of mineral resource potential.
For the GIS analyses in this report, certainty for each
HUC is quantified by the number of geoscientific data layers Geochemical Data Sources
that contribute to the resource potential score of that HUC.
The rock and sediment geochemical datasets used are
A lack of sediment, HMC, or rock geochemical samples, as
compilations of data from the Alaska Geochemical Database,
well as a lack of appropriate rock type and ARDF records
version 3.0 (AGDB3, Granitto and others, 2019). The AGDB3
for a HUC yields an Unknown classification assignment. If
is a compilation of (1) U.S. Geological Survey (USGS) geo-
aeromagnetic data are the only data that exist for a HUC, they
chemical analyses of rock, sediment, soil, and HMC samples
are not counted towards a certainty calculation because their
that were collected between 1962 and 2017 from Alaska
utility stems from their coordination with a specific rock type.
and prepared according to various USGS standard methods
The potential-certainty tables that are calculated based on five
(Miesch, 1976; Arbogast, 1990, 1996; Taggart, 2002); (2)
datasets (tables 3, 5) are those for which magnetic character
reanalyses of 1,121 archived USGS rock samples from the
cannot be tied to potential for lode gold occurrences. The
National Uranium Resource Evaluation (NURE), the Alaska
potential-certainty tables that are calculated based on six data-
Division of Geological & Geophysical Surveys, and the
sets (tables 7, 9, 11, 13) are those for which the magnetic char-
Bureau of Land Management using higher precision modern
acter of a specific rock type can be an indicator of potential
analytical technology and complementary data; and (3) legacy
for lode gold occurrences associated with that rock type. This
data from the Bureau of Mines.
method is easily adaptable to other groups of deposit types,
The NURE database contains data from the NURE
although available data may not be adequate to discriminate
Hydrogeochemical and Stream Sediment Reconnaissance
between some deposit types. For example, important param-
(NURE-HSSR) program that was overseen by the U.S. Atomic
eters for gold deposits—hydrothermal alteration type and
Energy Commission (Smith and others, 2013). The 66,103
intensity—are poorly documented statewide and undeniably
NURE sediment samples were collected in Alaska between
limit the precision of our results for all deposit types. Datasets
1976 and 1979 and analyzed by Los Alamos National Labora-
applied for the lode gold analyses are discussed below.
tory; 65,993 of these Alaska sediment samples were reana-
lyzed for additional elements for application in the Alaska
National Hydrography Dataset and Watershed Mineral Resource Assessment Program.
The Alaska Division of Geological & Geophysical
Boundary Dataset Survey’s (ADGGS) geochemical database includes analyses
The National Hydrography and Watershed Bound- of 12,437 rock samples, 10,919 sediment samples, 100 soil
ary Datasets (http://nhd.usgs.gov/) delineate surface water samples, and 1,568 HMC samples collected between 1960 and
networks and drainage basins throughout the United States 2014. These data provided by the ADGGS are also available for
using standardized criteria based on topography and hydrol- download via the internet (http://doi.org/10.14509/geochem).
ogy. Relative drainage basin size, geographic location, and The file structure and data format of each database is
nested hierarchy are encoded within a string of digits known different. Reformatting was necessary to ensure consistency
as a hydrologic unit code, or HUC. A classical hydrologic unit of data presentation and to facilitate use in the prospectiv-
is a division of a watershed with a single discharging stream; ity analysis. The AGDB3 used for our analyses in this report
accordingly, it corresponds to a physical watershed that is contains data for 129,347 rock samples (including mineralized
defined by topography. These HUCs are identified by 2 to samples), which include 56,112 igneous rock samples, 40,194
12 digits, which correspond to the largest drainage systems metamorphic rock samples, 19,012 sedimentary rock samples,
known as regions and to subwatersheds, respectively. Numeric and 14,029 unspecified rock samples, as well as 169,606 sedi-
codes, names, and boundaries associated with each HUC pro- ment samples, 51,518 HMC samples, 18,137 pan mineralogy
vide unique identifiers useful for associating other geospatial samples, and 6,969 soil samples.
data from multiple sources in a GIS. We use the term “HUC”
to refer to a physical drainage subbasin and not solely to the Sediment Geochemical Data
string of digits used to identify the subwatershed. Twelve-digit
HUC boundaries are used in this study as a geographic refer- The sediment geochemical data compose the most com-
ence frame and sampling unit for evaluating mineral resource prehensive, evenly distributed, and highest-density dataset
potential across Alaska. In Alaska, the majority of 12-digit applicable to the analysis of mineral resource potential across
HUCs are classical HUCs, subwatersheds that refer to single Alaska. This dataset is referred to in this report as sediment6 GIS-Based Identification of Areas that have Resource Potential for Lode Gold in Alaska
geochemistry because, although more than 80 percent of the Threshold values used to define anomalously enriched
sediment samples in the AGDB3 were collected from streams, element classes in mineral prospectivity analysis can be set in
sediment samples collected from other types of surface-water various ways. One of the more common methods is to use a
bodies such as lakes, ponds, and bays are also included. The percentile value, which will always yield anomalous element
sediment dataset is particularly useful owing to concealment classes with respect to the dataset. The anomalous element
of bedrock in many areas by unconsolidated sediment and classes, however, may not be enriched beyond the background
vegetation. Sediment geochemical data portray elemental concentrations of the material investigated, and thus not reflec-
abundance patterns that reflect rock compositions in their tive of the potential for a mineral deposit. To avoid this pitfall,
respective drainage basins and thus provide clues about rock we instead calculated levels above background for this study.
types and mineral occurrences in areas of poor exposure or For the sediment dataset in our analyses, the median value of
where geologic mapping is lacking. elements in the combined sediment database of Lee and others
Sediment geochemical data from the AGDB3 include (2016) is used for determining the background concentra-
heterogeneous data of highly variable accuracy, precision, and tions. Classification ranges for the elements were chosen on
associated lower detection limits. Although analytical methods a pseudologarithmic scale based on multiples of the respec-
have greatly improved in recent years, many geochemically tive background concentrations and provided in appendix 1;
scarce elements have highly left-censored data (assigned mini- background was determined to be 0.5 to 1.5 times the median
mum values) resulting from high minimum detection limits for value, values in samples at 1.5 to 3.5 times background are
older analytical data. In addition, analyses of many samples in considered as weakly anomalous, 3.5 to 7.5 times background
the AGDB3 database were completed by more than one analyti- are moderately anomalous, 7.5 to 15.5 times background are
cal method, including many archived sediment samples that highly anomalous, and values >15.5 times background are
have been reanalyzed using newer technology. To minimize the extremely anomalous.
complexity inherent in multiple determinations for individual
elements, a single best value concentration, derived from the
consideration of sample preparation and sample analysis meth-
Rock Geochemical Data
ods, was identified for each element in each sample. Granitto Rock geochemical data provide important clues for
and others (2013) provide a detailed description of the ranking revealing the potential of rocks in a HUC to contain an ele-
criteria accompanying analytical methods and how they were ment or mineral concentration. The distribution of rock geo-
used to determine the so-called best value for each sample. chemical analyses for Alaska is widely scattered, and although
For our GIS-based analyses, in situations for which more than the dataset is less robust when compared to the distribution
one sample was analyzed from a specific sample location, the of sediment data statewide, it is a valuable and strongly
highest best value for any given element from that location was weighted parameter in our analyses. This study did not attempt
selected for use in calculation of geochemical scores, to display to classify rock types based on the geochemical character-
on point plots, and to use for gridded map layers. istics of rocks, given the wide range of associated host and
In addition to the best-value determinations of chemical source rocks in gold-dominant hydrothermal systems. Instead,
values with respect to analytical methods, the comparabil- we focused on the use of the key suites of elements in rock
ity of data was compromised by a lack of consistency among samples to aid in the identification of HUCs that have resource
analytical methods for the determination of elemental abun- potential. All rocks were treated the same, whether they are
dances. For example, different analytical techniques have noted as fresh, altered, or mineralized; however, only a very
different detection limits for a single element, thus resulting in small percentage of the rock samples that have data reported
diverse data-censoring limits. Censored data are those that fall in AGDB3 were submitted as altered or mineralized.
outside the detection limit for a specific element analyzed by a Many of the rock samples in the AGDB3 have been ana-
particular method. Censored values complicate the determina- lyzed for only a limited number of elements, which typically do
tion of summary statistics, such as the mean, median, standard not include the important gold pathfinder elements such as As,
deviation, and percentile values, which are commonly used Bi, Sb, Te, Se, Tl, and Hg. We submitted 1,121 archived rock
to determine threshold values for a dataset. Two strategies samples to USGS contract laboratories for reanalysis by mod-
were used for handling the censored data when calculating the ern inductively coupled plasma mass spectrometry following a
summary statistics for the elements in the combined sediment sinter digest (see Granitto and others, 2019) to acquire concen-
dataset used in previous studies (Karl and others, 2016; Lee trations of pathfinder elements for areas of the State where they
and others, 2016): (1) when 40 percent or less of the data were were lacking. The results of these reanalyses were integrated
censored, either one-half the minimum noncensored value or into AGDB3 and processed to determine best values.
one-half the minimum lower detection limit (whichever was Threshold values for anomalous concentrations of
smaller) was substituted for the censored data, prior to the cal- elements in the rock samples were established to identify
culation of the element’s summary statistics; or (2) when the concentrations of elements that are high compared to typi-
data were more than 40 percent censored, the Kaplan-Meier cal rock. There are varied methods and approaches to deter-
method (Kaplan and Meier, 1958; Helsel, 2012) was used to mine threshold values for a rock geochemical dataset. As
estimate the summary statistics. discussed above for sediment geochemistry, the calculationYou can also read