The Investment Case for Gold - An update on recent economic trends and gold's role in a portfolio from a trusted leader in the space
←
→
Page content transcription
If your browser does not render page correctly, please read the page content below
June 2020

The Investment Case for Gold

An update on recent economic trends and gold’s role
in a portfolio from a trusted leader in the space
Important Disclosures
This material does not constitute an offer to sell or solicitation to buy any security, including shares of any Fund. An offer or solicitation will be made only through a Fund’s prospectus or summary
prospectus and will be subject to the terms and conditions contained. This material and the information provided herein are not directed at or intended for distribution to any person (or entity) who is
a citizen or resident of (or located or established in) any jurisdiction where the distribution of these materials and/or the purchase or sale of interests of a Fund would be contrary to applicable law or
regulation or would subject a Fund to any registration or licensing requirement in such jurisdiction. Persons who wish to review this material are required to inform themselves about and to observe
any legal or regulatory restrictions which may affect their eligibility to make an investment in a Fund. Professional advice should be sought in cases of doubt.
Any projections, market outlooks or estimates in this material are forward-looking statements and are based upon certain assumptions that are solely the opinion of VanEck. Any projections, outlooks or
assumptions should not be construed to be indicative of the actual events which will occur. Further, any information regarding portfolio composition, portfolio composition methodology, investment process or limits,
or valuation methods of evaluating companies and markets are intended as guidelines which may be modified or changed by VanEck at any time in its sole discretion without notice.
Any performance presented herein is for illustrative purposes only. Historical information is not indicative of future results; current data may differ from data quoted. Performance results for the Fund(s) reflects
temporary fee waiver and for expense reimbursement; current performance may be lower or higher than the performance quoted. Had the Fund(s) incurred all expenses and fees, investment returns would have
been reduced. Each index listed is unmanaged and the returns include the reinvestment of all dividends, but do not reflect the payment of transaction costs, advisory fees or expenses that are associated with an
investment in any fund. An index’s performance is not illustrative of a Fund’s performance. You cannot invest in an index. Please call 800.826.2333 for more recent performance information.
Non-VanEck proprietary information contained herein has been obtained from sources believed to be reliable, but not guaranteed. No part of this material may be reproduced in any form, or referred to in any other
publication, without express written permission of VanEck. ©2020, VanEck.
VanEck International Investors Gold Fund
You can lose money by investing in the Fund. Any investment in the Fund should be part of an overall investment program, not a complete program. The Fund is subject to the risks associated with concentrating
its assets in the gold industry, which can be significantly affected by international economic, monetary and political developments. The Fund’s overall portfolio may decline in value due to developments specific to
the gold industry. The Fund’s investments in foreign securities involve risks related to adverse political and economic developments unique to a country or a region, currency fluctuations or controls, and the
possibility of arbitrary action by foreign governments, or political, economic or social instability. The Fund is subject to risks associated with investments in Canadian issuers, commodities and commodity-linked
derivatives, commodities and commodity-linked derivatives tax, gold-mining industry, derivatives, direct investments, emerging market securities, foreign currency transactions, foreign securities, other investment
companies, management, market, non-diversification, operational, regulatory, small- and medium-capitalization companies and subsidiary risks.
Investing involves risk, including possible loss of principal. An investor should consider investment objectives, risks, charges and expenses of the investment company carefully before investing.
The prospectus and summary prospectus contain this and other information. Please read them carefully before investing.
VanEck Vectors Gold Miners ETF (GDX) and VanEck Vectors Junior Gold Miners ETF (GDXJ)
Gold- and silver-related investments, including gold exchange-traded funds (ETFs), are subject to risks including bullion price volatility, changes in world political developments, competitive pressures and risks
associated with foreign investments. In times of stable economic growth, the value of gold, silver and other precious metals may be adversely affected. Mining companies are subject to elevated risks, which
include, among others, competitive pressures, commodity and currency price fluctuations, and adverse governmental or environmental regulations. In particular, small and mid-cap mining companies may be
subject to additional risks including inability to commence production and generate material revenues, significant expenditures and inability to secure financing, which may cause such companies to operate at a
loss, greater volatility, lower trading volume and less liquidity than larger companies. Investors should be willing to accept a high degree of volatility and the potential of significant loss. The Funds may loan their
securities, which may subject them to additional credit and counterparty risk.
NYSE Arca Gold Miners Index is a service mark of ICE Data Indices, LLC or its affiliates (“ICE Data”) and has been licensed for use by VanEck Vectors ETF Trust (the “Trust”) in connection with VanEck Vectors
Gold Miners ETF (the “Fund”). Neither the Trust nor the Fund is sponsored, endorsed, sold or promoted by ICE Data. ICE Data makes no representations or warranties regarding the Trust or the Fund or the ability
of the NYSE Arca Gold Miners Index to track general stock market performance.
MVIS Global Junior Gold Miners Index is the exclusive property of MV Index Solutions GmbH (a wholly owned subsidiary of the Adviser), which has contracted with Solactive AG to maintain and calculate the
Index. Solactive AG uses its best efforts to ensure that the Index is calculated correctly. Irrespective of its obligations towards MV Index Solutions GmbH, Solactive AG has no obligation to point out errors in the
Index to third parties. The VanEck Vectors Junior Gold Miners ETF is not sponsored, endorsed, sold or promoted by MV Index Solutions GmbH and MV Index Solutions GmbH makes no representation regarding
the advisability of investing in the Fund.
Investing involves substantial risk and high volatility, including possible loss of principal. An investor should consider the investment objective, risks, charges and expenses of a Fund carefully
before investing. Please read the prospectus and summary prospectus carefully before investing.
Van Eck Securities Corporation, Distributor of VanEck International Investors Gold Fund, VanEck Vectors Gold Miners ETF, and VanEck Vectors Junior Gold Miners ETF. 666 Third Avenue, New York, NY 10017
vaneck.com 800.826.2333.

2

Important Disclosures
VanEck Merk Gold Trust (OUNZ)
The material must be preceded or accompanied by a prospectus. Before investing you should carefully consider the VanEck Merk Gold Trust's (the “Trust")
investment objectives, risks, charges and expenses. Please read the prospectus carefully before investing.
Investing involves risk, including possible loss of principal. The Trust is not an investment company registered under the Investment Company Act of 1940 or a
commodity pool for the purposes of the Commodity Exchange Act. Shares of the Trust are not subject to the same regulatory requirements as mutual funds.
Because shares of the Trust are intended to reflect the price of the gold held in the Trust, the market price of the shares is subject to fluctuations similar to
those affecting gold prices. Additionally, shares of the Trust are bought and sold at market price, not at net asset value (“NAV”). Brokerage commissions will
reduce returns.
The request for redemption of shares for gold is subject to a number of risks including but not limited to the potential for the price of gold to decline during the time between
the submission of the request and delivery. Delivery may take a considerable amount of time depending on your location.
Commodities and commodity-index linked securities may be affected by changes in overall market movements and other factors such as weather, disease, embargoes, or
political and regulatory developments, as well as trading activity of speculators and arbitrageurs in the underlying commodities.
Trust shares trade like stocks, are subject to investment risk and will fluctuate in market value. The value of Trust shares relates directly to the value of the gold held by the
Trust (less its expenses), and fluctuations in the price of gold could materially and adversely affect an investment in the shares. The price received upon the sale of the
shares, which trade at market price, may be more or less than the value of the gold represented by them. The Trust does not generate any income, and as the Trust
regularly issues shares to pay for the Sponsor’s ongoing expenses, the amount of gold represented by each Share will decline over time. Investing involves risk, and you
could lose money on an investment in the Trust. For a more complete discussion of the risk factors relative to the Trust, carefully read the prospectus.
The sponsor of the Trust is Merk Investments LLC (the “Sponsor”). Van Eck Securities Corporation and Foreside Fund Services, LLC, provide marketing services to the
Trust.
© 2020 Merk Investments LLC. © 2020 VanEck. All trademarks, service marks or registered trademarks are the property of their respective owners.

3

Table of Contents

    About VanEck                          05
    Investment Case for Gold Bullion      10
    Investment Case for Gold Miners       21
    Role of Gold Bullion in a Portfolio   27
    VanEck’s Gold Investments             32

4
About VanEck

5
Mission and History
VanEck’s mission is to strengthen portfolios by offering forward looking, intelligent solutions
Transformative Investments: Started offering active strategies in international equities (1955), gold shares (1968),
emerging markets (1993); added passive strategies in 2006 and has emerged as top 10 ETF sponsor globally
Private Ownership: As an independent, private firm we can focus on client interests with a long-term perspective
Accessible Management: We pride ourselves on being available to clients and engaging directly with them
6Corporate Overview
Today, VanEck manages $56 billion in assets
Global headquarters in New York with robust lineups of local funds in Europe and Australia
295 full-time staff, including 50 investment professionals averaging 24 years of portfolio management experience
Lead portfolio managers all have direct experience in the sectors and regions in which they invest
Institutional and wealth management clients
Our active funds and smart beta ETFs have won numerous performance awards
$1.7B $0.5B
$3.0B
$3.5B Global and International Equity
Municipal Bonds
Emerging Markets Equity
$4.1B
Emerging Markets and International Bonds
$4.5B U.S. Equity
$33.6B
Corporate Bonds
$5.2B
Equity Income
Asset Allocation and Commodities
Data as of June 30, 2020. Awards received available at https://www.vaneck.com/about-vaneck/awards/
Strategies offered in mutual, pooled and off-shore funds, separate accounts, variable insurance portfolios, sub-advisory, ETFs and limited partnerships.
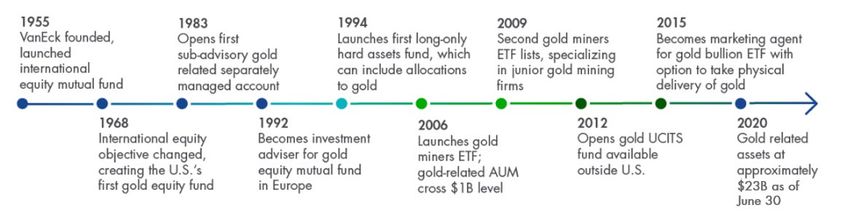
7Over 50 Years of Gold Leadership
VanEck has led the development of strategies that allow investors to easily access the potential portfolio benefits of gold
The firm launched the nation’s first gold fund (INIVX) in 1968 and also issued the first gold miners ETF (GDX) in 2006
VanEck’s History in Gold
8VanEck’s Full Range of Gold Investing Access
VanEck offers gold investing access through active strategies and gold
ETFs providing exposure to both gold mining stocks and gold bullion
Actively Managed Physical Gold with
Index Exposure to Gold Mining
Gold Mining Option for Delivery
INIVX OUNZ GDX® GDXJ®
VanEck International VanEck® Merk® VanEck Vectors® Gold VanEck Vectors® Junior
Investors Gold Fund Gold Trust Miners ETF Gold Miners ETF
Please see important disclosures at the beginning of this presentation.
9Investment Case for Gold Bullion 10
Gold Broke Out in 2019
New secular bull market began with Federal Reserve (Fed) rate hike in December 2015
Market broke out with Fed shift to easing in 2019
Overwhelming risks of pandemic drove gold to $1,800 in 2020
Gold Price, 2008 to 2020
$2,100
$1,900
$1,700
$1,500
Price ($/oz)
$1,300
$1,100
New Gold Bull Market
$900
$700
$500
Source: VanEck, Bloomberg. Data as of June 2020. Past performance is no guarantee of future results. Please see important disclosures at the beginning of this presentation and definitions at end.
11Middle-Innings of a Longer Secular Gold Bull Market?
Current price trends hint at a potentially longer, sustained rally in gold—perhaps more similar to the secular rally of 2001 to 2008
While it is still too early to tell, we believe a similar rally (in today’s terms) would suggest gold prices well above $2,000/oz,
eventually
Historical Gold Bull Market Rallies
Secular: Oct 1971 - Dec 1974 Aug 1976 - Sep 1980 Mar 2001 - Feb 2008 Oct 2008 - Aug 2011
Cyclical: Feb 1985 - Nov 1987 Feb 1993 - Feb 1996
Current: Dec 2015 - Present
600%
Cumulative Gold Price Change
500%
400%
300%
200%
100%
0%
0 4 8 12 16 20 24 28 32 36 40 44 48 52 56 60 64 68 72 76 80
Months
Source: VanEck, Bloomberg. Data as of June 2020. Past performance is no guarantee of future results. Please see important disclosures at the beginning of this presentation and definitions at end.
12Are Negative Real Rates Here to Stay?
Negative real rates have historically been a positive environment for gold
Indicative of high financial risks
Gold becomes an alternative to interest-bearing assets
Gold vs. Real Rates
U.S. Real Interest Rates Gold Price
10% $2,000
8% $1,750
Real U.S. Interest Rates
6% $1,500
Gold Price ($US/oz)
4% $1,250
2% $1,000
0% $750
-2% $500
-4% $250
-6% $0
Source: VanEck, FactSet, Bloomberg. Data as of May 2020. Past performance is no guarantee of future results. Please see important disclosures at the beginning of this presentation and definitions at end..
13Gold Production Reaching a Plateau
Industry no longer able to grow production
Decline in discoveries (0 reported for 2017, 2018, and 2019), despite record spending on exploration
Supply issues may become a driver in the future
Gold Discoveries and Exploration Spending: 1990 to 2019
180 $12,000
160
$10,000
140
120 $8,000
Gold (millions of ounces)
100
US$ million
$6,000
80
60 $4,000
40
$2,000
20
0 $0
Gold discovered (Reserves, Resources) (Moz) Gold exploration budgets (US$ mn)
Source: BofA Merrill Lynch Global Research; S&P Global Intelligence. Data as of December 2019. Past performance is no guarantee of future results. Please see important disclosures at the beginning of
this presentation and definitions at end.
14Inflows to ETPs Driving Gold Prices
Western demand (investment demand) in bullion ETPs and futures
Investment demand more impactful than jewelry demand
Positive trend of ETP inflows since 2015
ETF Holdings of Gold
120
Total Known ETF Holdings in Gold (oz, Millions)
100
80
60
40
20
0
Source: VanEck, Bloomberg. Data as of June 2020. Not a recommendation to buy or sell any security. Past performance is no guarantee of future results. Please see important disclosures at the beginning of
this presentation and definitions at end..
15Gold Investment Demand Could Double from Current Levels
Gold allocations are small compared to other asset classes
We believe there is room for gold positions to continue to grow and investment demand to widen
Gold Allocations (Gold ETFs + COMEX Longs as % of Global Funds Assets Under Management (AUM))
1.0%
0.9%
0.8%
0.7%
Gold % Of Global AUM
0.6%
0.5%
0.4%
0.3%
0.2%
Source: Morningstar; VanEck. Data as of May 2020. COMEX Longs represent long positions (an investment that expects an asset to increase in price) in COMEX gold futures contracts which trade on the
Chicago Mercantile Exchange Globex based on the price of gold. Past performance is no guarantee of future results. Please see important disclosures at the beginning of this presentation and definitions at end.
16Central Banks Continue Gold Buying
Though the pace has slowed in the near term, central banks have been continuing their long-term trend of gold buying
Central bank buying has been one driver of increased demand for gold
Central Bank Gold Reserves Have Been Increasing
Q1 2000 - Q1 2020
2,500
2,000
Gold Reserves (Tonnes)
1,500
1,000
500
0
2000 2001 2002 2003 2004 2005 2006 2007 2008 2009 2010 2011 2012 2013 2014 2015 2016 2017 2018 2019 2020
China Russia India Turkey
Source: World Gold Council. Past performance is no guarantee of future results. Please see important disclosures at the beginning of this presentation and definitions at end..
17Central Bank Balance Sheets Have Exploded
Because increases in balance sheets have historically moved in tandem with increases in gold prices, the recent spike in balance sheets
may potentially be supportive of gold prices moving forward
Major central bank balance sheets are up nearly 100% on average YTD
Federal Reserve European Central Bank Riksbank (Central Bank of Sweden)
(1/1/2010 - 6/30/2020) (1/1/2010 - 6/30/2020) (1/1/2010 - 6/30/2020)
+70% +33% +32%
8 7 1.4
7 6 1.2
6
Trillions (USD)
Trillions (EUR)
Trillions (SEK)
5 1.0
5
4 0.8
4
3 0.6
3
2 2 0.4
1 1 0.2
0 0 0.0
2010
2011
2012
2013
2014
2015
2016
2017
2018
2019
2020
2010
2011
2012
2013
2014
2015
2016
2017
2018
2019
2020
2010
2011
2012
2013
2014
2015
2016
2017
2018
2019
2020
Bank of Canada Reserve Bank of Australia Bank of England
(1/1/2010 - 6/30/2020) (1/1/2010 - 6/30/2020) (1/1/2010- 6/30/2020)
+337% +58% +46%
600 300 800
250 700
500
600
Billions (AUD)
Billions (GBP)
Billions (CAD)
400 200 500
300 150 400
100 300
200
200
100 50 100
0 0 0
2010
2011
2012
2013
2014
2015
2016
2017
2018
2019
2020
2010
2011
2012
2013
2014
2015
2016
2017
2018
2019
2020
2010
2011
2012
2013
2014
2015
2016
2017
2018
2019
2020
Source: central banks; Bloomberg. Data as of 6/30/2020. Past performance is no guarantee of future results. Please see important disclosures at the beginning of this presentation and definitions at end.
18Gold Has Outperformed in Modern Market
Gold is more than a diversification and hedging tool
Gold has outperformed many other asset classes since the beginning of the century
Gold Outperformance over 20 Years
(1/1/2000 - 6/30/2020)
700
600 9.22%
500
Base Level = 100
400
300 5.74%
5.21%
200
2.94%
100
0
2000 2001 2002 2003 2004 2005 2006 2007 2008 2009 2010 2011 2012 2013 2014 2015 2016 2017 2018 2019 2020
Gold Bullion US Stocks US Bonds US Treasuries
Source: Morningstar. Data as of 6/30/2020. US Stocks represented by S&P® 500 Index; US Bonds represented by Bloomberg Barclays US Aggregate Bond Index; Gold Bullion represented by LBMA PM Gold
Price; US Treasuries represented by the Bloomberg Barclays US 1-3 Year Treasury Bond Index. Past performance is not indicative of future results. Indices are not securities in which investments can be made. An
index’s performance is not illustrative of a fund’s performance. Please see important disclosures at the beginning of this presentation and definitions at end.
19Gold Has Proven Its Value in Uncertain Markets
Gold has Shined in Recent Crises
20% 18% 17%
11%
10% 9% 8%
5% 6%
5%
3% 2% 2% 2%
0%
-3%
-10%
Return
-13% -12%
-14%
-20%
-19%
-30%
-40%
-43%
-50%
2008 2010 2011 2015 2018 YTD
Global Eurozone US Sovereign Debt China Yuan Devaluation Fed Hike/ COVID Crisis
Financial Crisis Crisis Downgrade 8/18/15 - 2/11/16 US-China 1/1/20 - 6/30/20
10/11/07 - 3/6/09 4/20/10 - 7/1/10 7/25/11 - 8/9/11 Trade War
9/20/18 - 12/24/18
US Stocks US Treasuries Gold Bullion
Source: Morningstar. Data as of 6/30/2020. US Stocks represented by S&P® 500 Index; Gold Bullion represented by LBMA PM Gold Price; US Treasuries represented by the Bloomberg Barclays US 1-3 Year
Treasury Bond Index. Past performance is not indicative of future results. Indices are not securities in which investments can be made. An index’s performance is not illustrative of a fund’s performance. Please see
important disclosures at the beginning of this presentation and definitions at end.
20Investment Case for Gold Miners 21
Gold Equity Valuations Currently at Attractive Levels
Major and Mid-Tier miner price/cash flow (P/CF) valuations have been below average in recent years and mid-tier/junior miners have been
deeply discounted on a price/net asset value (P/NAV) basis
Gold miners historically have traded at prices above their valuations, based on cash flow and net asset value, due in part to investor
expectations of excess return versus rising gold prices and the potential for gold discovery by these companies
Historical P/CF of Majors and Mid-Tiers (2006 – 2020) Adjusted P/NAV of North American Gold Producers (at Gold Spot)
25X Senior Mid-Tier Junior
4.00x
3.75x
20X 3.50x
Consensus Forward P/CF (X) – Majors & Mid-Tiers
3.25x
2006-2011 3.00x
14.8X
2.75x
15X
Adjusted P/NAV - Spot
2.50x
2006-Pres 2.25x
10.7X
2.00x
10X 1.75x
1.50x
2012-Pres. 1.25x
7.5X 1.00x
5X
0.75x
0.50x
0.25x
0X
0.00x
Source: RBC Capital Markets. Data as of June 2020. P/CF represents a company’s stock price to cash flow. P/NAV represents a company’s stock price to net asset value. Senior (or Major), Mid-Tier, and Junior
miners are classifications developed by RBC Capital Markets based on their coverage universe and represent the amount of gold production by these companies. Seniors/Majors tend to be larger companies and
produce the most gold per year followed by Mid-Tier miners which tend to be slightly smaller and produce less gold. Junior miners tend to be smaller exploratory companies that produce little or no gold at present.
Past performance is no guarantee of future results. Please see important disclosures at the beginning of this presentation and definitions at end.
22Companies Now Able To Generate Significant Free Cash Flow
All-in mining costs, or what it costs a gold miner to extract gold, average around $900 per ounce
Industry is currently free cash flow (FCF) positive above approximately $1,100
A $200 move in gold price (approximately 13%) has the potential to translate to strong double-digit increases in FCF
Average All-In Mine Costs (Seniors/Mid-Tiers) 2021 FCF At Varying Gold Prices (Seniors/Mid-Tiers)
$1,000 $25
+29%
$900
$20
$800 +41%
US$ Billions $15
$700
$US/oz
$10
$600
$500 $5
$400
$0
2020E 2021E 2022E 2023E 2024-
2026E $1,600 $1,800 $2,000
Source: VanEck, Company Reports. Data as of June 2020. Seniors miners produce approximately 1.5-6.0 million ounces of gold per year. Mid-Tier miners produce approximately 0.3-1.5 million ounces of gold
per year. Junior miners (not pictured) produce approximately less than 0.3 million ounces of gold per year. Data displayed for Major and Mid-Tier miners. FCF represents a company’s free cash flow. Past
performance is no guarantee of future results. Please see important disclosures at the beginning of this presentation and definitions at end.
23Gold Miners’ Balance Sheets Are Solid
Net debt levels of North American mid-tier and senior gold producers are currently at lows seen only once in the last decade
On a Net Debt/EBITDA basis, they are currently as underleveraged as they have been in nearly two decades
Net Debt/EBITDA – Commonly Traded Gold Stocks vs. S&P 500
3.0
PVG
2.5
WPM
2.0 SPX
EDV
1.5 AU GFI
Net Debt/EBITDA
AEM
1.0 NCM ASR ELD AUY OGC
K
FRES
0.5 NEM
ABX AVG
SAR BTORGLD
0.0
FNVPAAS
-0.5 EVN
AGI KL
-1.0
OR
-1.5
IAG NSTSSRM
-2.0
Source: VanEck, FactSet. Data as of March 2020. EBITDA represents earnings before interest, taxes, depreciation, and amortization. Net Debt/EBITDA is a common ratio representing the amount of leverage
employed by a company, or debt issues relative to earnings. Past performance is no guarantee of future results. Please see important disclosures at the beginning of this presentation and definitions at end.
24Gold Mining Industry Has Been Transformed
Newmont – Focus on Returns and Disciplined Capital Allocation
Financially conservative – low debt levels, no hedging
Maintain low costs
Capital discipline – sequence projects, recent history of high IRRs, lower capex
Incentivized to deliver profits not ounces
Recent history of:
Growing margins, • Advancing our most profitable projects
Reserves and
• Investing in exploration across cycles
Resources
Maintaining • Liquidity of ~$5B and net debt to adj. EBITDA of 1.5x*
investment grade • Refinanced 2019 debt with 10-year notes at 2.800%
balance sheet • Preserving balance sheet optionality and flexibility
• Annualized dividend of $0.56/share Tanami
Returning cash to
• Dividends of ~$900 million expected in 2019
shareholders
• Commitment to long-term value creation
*Net debt to pro forma adjusted EBITDA shown for 2019 Q2, which reflects the addition of Goldcorp’s pre-acquisition adjusted EBITDA on a U.S. GAAP basis to our adjusted EBITDA to
include the full twelve months of Goldcorp results for the twelve months ended June 30, 2019.
Source: VanEck, Newmont Mining Corporation. Data as of June 2019. EBITDA represents earnings before interest, taxes, depreciation, and amortization. Capex represents capital expenditures. Not a
recommendation to buy or sell any security. Past performance is no guarantee of future results. As of 6/30/2020, Newmont represented 7.5% of INIVX net assets, and 13.7% of GDX net assets. Please see important
disclosures at the beginning of this presentation and definitions at end.
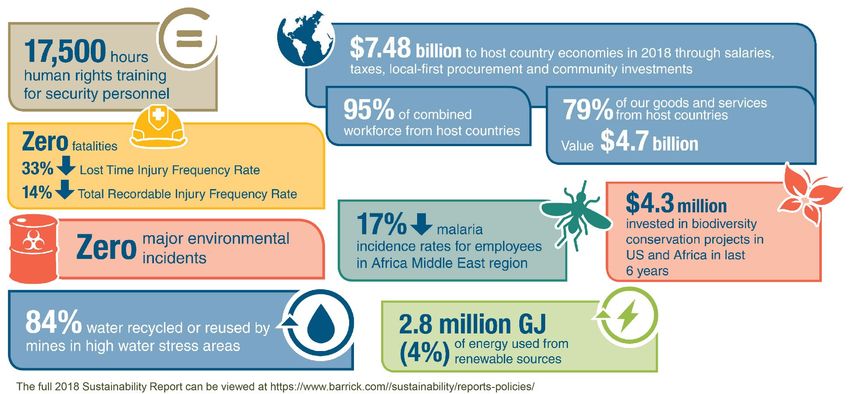
25Gold Industry Proactive on Environment and Social Activities Barrick – 2018 Sustainability Highlights Bring education, medicine, jobs, infrastructure to many impoverished regions Operate to stringent environmental standards Increasing focus on renewable energy Source: VanEck; Barrick. Data as of December 2019. Not a recommendation to buy or sell any security. Past performance is no guarantee of future results. As of 6/30/2020, Newmont represented 7.4% of INIVX net assets, and 13.2% of GDX net assets. Please see important disclosures at the beginning of this presentation and definitions at end. 26
Role of Gold
in a Portfolio

27
The Role if Gold in a Portfolio: Portfolio Diversification
Low correlation with mainstream investments – global stocks and bonds, REITs
May potentially enhance risk-adjusted returns
Asset Class Correlations, October 2004 – June 2020
International Emerging
U.S. Stocks Global Bonds REITs Gold Miners Gold Bullion
Stocks Markets Stocks
U.S. Stocks 1.00
International Stocks 0.88 1.00
Emerging Markets Stocks 0.77 0.88 1.00
REITs 0.73 0.67 0.59 1.00
Global Bonds 0.27 0.44 0.45 0.37 1.00
Gold Miners 0.23 0.32 0.45 0.19 0.52 1.00
Gold Bullion 0.05 0.16 0.29 0.08 0.51 0.78 1.00
More Diversification Less Diversification
Source: Morningstar, VanEck. Data as of June 2020. U.S Stocks represented by S&P® 500 Index; International Stocks represented by MSCI EAFE Index; Emerging Markets Stocks represented MSCI EM Index;
REITS represented by FTSE NAREIT All Equity REIT Index; Global Bonds represented by Bloomberg Barclays Global Aggregate Bond Index; Gold Miners represented by NYSE Arca Gold Miners Index; Gold
Bullion represented by LBMA PM Gold Price. Past performance is not indicative of future results. Indices are not securities in which investments can be made. An index’s performance is not illustrative of a fund’s
performance. Please see important disclosures at the beginning of this presentation and definitions at end.
28The Role of Gold in a Portfolio: Hedge Against Systemic Risks
Gold has historically outperformed the broader market, e.g. DJIA, during
— Deflationary periods (1930s, 2009)
— High inflation (1970s)
— Market turmoil (2000s) caused by asset bubbles
Dow/Gold Ratio, 1896 to 2020
— Increasing ratio indicates an increasing stock market and/or declining gold price.
— Decreasing ratio indicates a declining stock market and/or increasing gold price.
Chart Title
45
40
35
Arrows indicate periods of
30 gold outperformance
Dow/Gold Ratio
25
20
15
10
5
0
Source: Bloomberg, VanEck. Data as of June 2020. Dow/Gold Ratio represents the Dow Industrial Average divided by the price of gold. Past performance is no guarantee of future results. Please see important
disclosures at the beginning of this presentation and definitions at end..
29Miners Have Offered Leveraged Exposure to Gold
Gold miners have historically exhibited higher risk and higher reward in gold bull markets
Gold bullion had a lower volatility profile in both bull and bear markets offering return potential and defensive characteristics
Current Gold Bull Market Last Gold Bear Market
1/1/2016 - 6/30/2020 9/1/2011 - 12/31/2015
30.0 -10.0
28.0 -12.0
Gold Bullion
26.0 -14.0
Gold Miners
24.0 -16.0
22.0 -18.0
Return (%)
Return (%)
50/50 Portfolio 50/50 Portfolio
20.0 -20.0
18.0 -22.0
16.0 -24.0
14.0 -26.0
12.0 -28.0
Gold Miners
Gold Bullion
10.0 -30.0
10.0 15.0 20.0 25.0 30.0 35.0 40.0 15.0 17.0 19.0 21.0 23.0 25.0 27.0 29.0 31.0 33.0 35.0
Standard Deviation (%) Standard Deviation (%)
Source: Morningstar; VanEck. Data as of 6/30/2020. Standard Deviation is a historical measure of the variability of returns relative to the average annual return. A higher number indicates higher overall volatility.
Past performance is no guarantee of future results. Please see important disclosures at the beginning of this presentation and definitions at end..
30Bullion May Limit Miner Drawdown
Based on its defensive characteristics, an allocation to gold bullion may potentially limit the drawdowns, or
declines from peak values, that have historically been associated with gold miner investment
Reduced Drawdown in Turbulent Markets
10/2004 - 6/2020
0.0
-10.0
-20.0
-30.0
Drawdown (%)
-40.0
-50.0
-60.0
-70.0
-80.0
-90.0
3/2005
8/2005
1/2006
6/2006
4/2007
9/2007
2/2008
7/2008
5/2009
3/2010
8/2010
1/2011
6/2011
4/2012
9/2012
2/2013
7/2013
5/2014
3/2015
8/2015
1/2016
6/2016
4/2017
9/2017
2/2018
7/2018
5/2019
3/2020
10/2004
11/2006
12/2008
10/2009
11/2011
12/2013
10/2014
11/2016
12/2018
10/2019
50% Gold Bullion/50% Gold Miners LBMA Gold Price (Gold Bullion) NYSE Arca Gold Miners Index (Gold Miners)
Source: Morningstar; VanEck. Data as of 6/30/2020. Drawdown refers to how much an investment declines from its peak value before it recovers back to that peak. Over time, an investment may have
drawdowns from multiple peak values. Past performance is no guarantee of future results. Please see important disclosures at the beginning of this presentation and definitions at end..
31VanEck’s Gold Investments 32
Providing Broad Access to Gold Investing
VanEck has led the development of strategies that allow investors to easily access the potential portfolio benefits of gold
Our approaches are tailored to meet investors’ needs and preferences, whether active or passive via gold mining or bullion
VanEck Gold Capabilities
Assets by Strategy (in Billion)
Gold-Related Assets $23.4 Billion (as of June 30, 2020)
Actively Managed Gold Mining $0.3B
Passively Managed Gold Mining
Gold Strategies $22.0B
Passively Managed Gold Bullion $1.2B
(with the option of physical delivery)
U.S. Mutual Funds
U.S. Insurance Trusts
U.S. ETFs
Vehicle Availability
UCITS Funds
Sub-Advisory Services Actively Managed Gold Mining
Institutional Separate Accounts Passively Managed Gold Mining
Passively Managed Gold Bullion
Data as of June 30, 2020.
33VanEck’s Full Range of Gold Investing Access
VanEck offers gold investing access through active strategies and gold
ETFs providing exposure to both gold mining stocks and gold bullion
Actively Managed Physical Gold with
Index Exposure to Gold Mining
Gold Mining Option for Delivery
INIVX OUNZ GDX® GDXJ®
VanEck International VanEck® Merk® VanEck Vectors® Gold VanEck Vectors® Junior
Investors Gold Fund Gold Trust Miners ETF Gold Miners ETF
Please see important disclosures at the beginning of this presentation.
34VanEck’s Gold Investments – Gold Bullion
VanEck® Merk® Gold Trust provides investors with a convenient and cost-efficient way to buy and hold gold
through an exchange-traded product with the option to take physical delivery of gold.
Fund Details Deliverability
VanEck Merk Gold Trust holds gold bullion in the form of
Ticker OUNZ
allocated London Bars. It differentiates itself by providing
investors with the option to take physical delivery of gold
Inception Date 5/16/2014
bullion in exchange for their shares.
Expense Ratio (%) 0.25
Net Assets ($M) 317.6 Convertibility
For the purpose of facilitating delivery, Merk has developed
Custodian JPMorgan Chase Bank, N.A.
a patented process for the conversion of London Bars into
gold coins and bars in denominations investors may desire.
Trustee Bank of New York Mellon
Tax Efficiency
Taking delivery of gold is not a taxable event as investors
merely take possession of what they already own: the gold.
Why Delivery Matters?
Access: Investors have direct access to their gold
Efficiency: OUNZ investors that choose to take delivery of physical gold avoid the tax liability associated with selling other gold ETF shares
in order to fund physical gold purchases
Peace of Mind: Gold has successfully been delivered to OUNZ investors in exchange for their shares providing an extra layer of comfort to
investors that their gold is in fact in OUNZ’s vault
Net assets as of 7/22/2020. Source: VanEck. The request for redemption of shares for gold is subject to a number of risks including but not limited to the potential for the price of gold to decline during the time
between the submission of the request and delivery. Delivery may take a considerable amount of time depending on your location. It is expected that, if an Investor submits shares to the Trust, the exchange for
physical gold will generally not be a taxable event. See tax discussion in prospectus. Not tax advice; please consult with a tax professional for tax advice. Please see important disclosures at the beginning of this
presentation.
35VanEck’s Gold Investments – Gold Miners
Gold miners offer indirect exposure to gold. Business heavily dependent on gold prices but other factors also
impact performance.
Actively Managed Mutual Fund Exchange Traded Funds
International Investors Gold Fund Van Eck Vectors Gold Miners ETF
An actively managed portfolio of gold mining equities with a 40+ year track Comprehensive portfolio of global gold miners
record. The fund is managed by a specialized investment team that
Ticker GDX
conducts continuous on- and under-the-ground research to access mining
efficiencies and opportunities. Benchmark Index NYSE Arca Gold Miners Index
Tickers Inception Date 5/16/2006
Class A INIVX Expense Ratio Gross/Net (%) 0.52/0.52
Class C IIGCX Net Assets ($M) 15,962.7
Class I INIIX
Van Eck Vectors Junior Gold Miners ETF
Class Y INIYX
Early stage and exploratory global gold miners
Inception Date 2/10/1956
Ticker GDXJ
Expense Ratio Gross/Net (%)
Benchmark Index MVIS Global Junior Gold Miners Index
Class A 1.49/1.45
Inception Date 11/10/2009
Class C 2.31/2.20
Expense Ratio Gross/Net (%) 0.53/0.53
Class I 1.09/1.00
Net Assets ($M) 5,234.8
Class Y 1.17/1.10
Net Assets ($M) 1,007.0
Data as of 6/30/2020. Source: VanEck. Please see important disclosures at the beginning of this presentation
36Active Gold Investment Team
Joe Foster | Portfolio Manager
Portfolio Manager for VanEck’s Gold strategies since 1996
Also serves as Gold Strategist for VanEck’s natural resource investment teams
Nearly 40 years of gold industry experience in mining and finance
Previously a Senior Geologist at Pinson Mining Company and Exploration Geologist at Lacana Gold Inc.
MBA, MS (Geology), University of Nevada-Reno; BS (Geology), Tennessee Technological University
Imaru Casanova | Deputy Portfolio Manager
Senior Gold Analyst for VanEck’s Gold and Natural Resources strategies since joining in 2011
Over 20 years of gold and natural resource industry experience in finance
Previously Managing Director at McNicoll Lewis & Vlak and Research Analyst at Barnard Jacobs Mellet and BMO
Prior career experience as a Petroleum Engineer and Offshore Well Site Supervisor for Shell in Venezuela
MS (Mechanical Engineering), Case Western Reserve; BS (Mechanical Engineering), Case Western Reserve
Charl P. de M. Malan | Senior Analyst
Senior Metals & Mining Analyst for VanEck’s Gold and Natural Resources strategies since joining in 2003
Nearly 25 years of metals and mining industry experience in finance
Previously Equity Analyst at JPMorgan Chase and Junior Portfolio Manager at Standard Corporate and Merchant Bank
MBA, BA (Business Administration), University of Stellenbosch; BA (Arts), University of Pretoria
37Index Descriptions These indices do not reflect the performance of a fund. All indices listed are unmanaged indices and include the reinvestment of all dividends, but do not reflect the payment of transaction costs, advisory fees or expenses that are associated with an investment in a fund. Certain indices may take into account withholding taxes. An index’s performance is not illustrative of a fund’s performance. Indices are not securities in which investments can be made. NYSE Arca Gold Miners Index (GDMNTR) is a modified market capitalization-weighted index composed of publicly traded companies involved primarily in the mining for gold. The Index is calculated and maintained by the New York Stock Exchange. MVIS® Junior Gold Miners Index (MVGDXJTR) is a rules-based, modified market capitalization-weighted, float-adjusted index comprised of a global universe of publicly traded small-capitalization companies that generate at least 50% of their revenues from gold and/or silver mining/royalties/streaming or have mining projects with the potential to generate at least 50% of their revenues from gold and/or silver when developed. Gold Spot (GOLDS Commodity) is quoted as U.S. dollars per Troy Ounce. S&P 500® Index (S&P 500) consists of 500 widely held common stocks, covering four broad sectors (industrials, utilities, financial and transportation). Dow Jones Industrial Average (DJIA) is a price-weighted average of 30 significant stocks traded on the New York Stock Exchange (NYSE) and the Nasdaq. Bloomberg Barclays US Treasury Index measures U.S. dollar-denominated, fixed-rate, nominal debt issued by the U.S. Treasury. Bloomberg Barclays US 1-3 Year Treasury Bond Index measures public obligations of the U.S. Treasury with a maturity between 1 and up to (but not including) 3 years. Bloomberg Barclays Global Aggregate Bond Index is a market-weighted index of global government, government-related agencies, corporate and securitized fixed-income investments. MSCI EAFE Index is an equity index which captures large and mid cap representation across Developed Markets countries around the world, excluding the US and Canada. MSCI Emerging Markets Index is a free float-adjusted market capitalization index that is designed to measure equity market performance of emerging markets. FTSE NAREIT All Equity REIT Index is a free-float adjusted, market capitalization-weighted index of U.S. Equity REITs. Gold Bullion or LBMA Gold Price is the London Bullion Market Association measure of gold price quoted in U.S dollars The S&P 500 Index is a product of S&P Dow Jones Indices LLC and/or its affiliates and has been licensed for use by Van Eck Associates Corporation. Copyright © 2020 S&P Dow Jones Indices LLC, a division of S&P Global, Inc., and/or its affiliates. All rights reserved. Redistribution or reproduction in whole or in part are prohibited without written permission of S&P Dow Jones Indices LLC. For more information on any of S&P Dow Jones Indices LLC’s indices please visit www.spdji.com. S&P® is a registered trademark of S&P Global and Dow Jones® is a registered trademark of Dow Jones Trademark Holdings LLC. Neither S&P Dow Jones Indices LLC, Dow Jones Trademark Holdings LLC, their affiliates nor their third party licensors make any representation or warranty, express or implied, as to the ability of any index to accurately represent the asset class or market sector that it purports to represent and neither S&P Dow Jones Indices LLC, Dow Jones Trademark Holdings LLC, their affiliates nor their third party licensors shall have any liability for any errors, omissions, or interruptions of any index or the data included therein. Bloomberg Barclays Indices does not sponsor, endorse, or promote the Fund and bears no liability with respect to the Fund or security. 38
You can also read