Brookfield Global Listed Real Estate - Brookfield ...

Page created by Clifton Evans
 
CONTINUE READING
Brookfield Global Listed Real Estate - Brookfield ...
Brookfield Global Listed Real Estate

Q1 2019

                                       © 2019 Brookfield Public Securities Group LLC
Brookfield Global Listed Real Estate - Brookfield ...
Brookfield’s Real Estate Business & Securities Team

 Jason Baine                                      Bernhard Krieg, CFA                                 Iconic Brookfield Assets1
 Portfolio Manager                                Portfolio Manager
 23 Years of Investing Experience                 21 Years of Investing Experience
 18 Years with Brookfield                         13 Years with Brookfield
 Launched Brookfield’s real estate                Extensive long/short and real estate
 securities platform in 2001                      securities experience

 Supported by Nine Analysts
 Average 13 years experience                                                                          5 Manhattan West | New York
 Cross-border coverage with regular coverage rotations
 Centralized team in Chicago

   One of the largest real estate investors in the world1                                                                                     CityPoint | London
                                                                                                      Brookfield Place | Toronto
   History of buying assets on a value basis

   Own some the world’s most iconic real estate assets

   Global operator for over 120 years1                                                                Woodlands Mall | Houston                Brookfield Place | New York

$188 billion1
REAL ESTATE ASSETS
UNDER MANAGEMENT                                                                                      Canary Wharf | London

As of December 31, 2018. 1. Assets under management for Brookfield Asset Management Inc. includes its affiliates. Brookfield Public Securities Group LLC has approximately $20
billion in total assets under management as of December 31, 2018 and includes discretionary, non-discretionary and administrative. Values may not add to the total due to rounding.
Iconic Brookfield Assets are not held be the fund.
                                                                                                                                                                                2
Brookfield Global Listed Real Estate - Brookfield ...
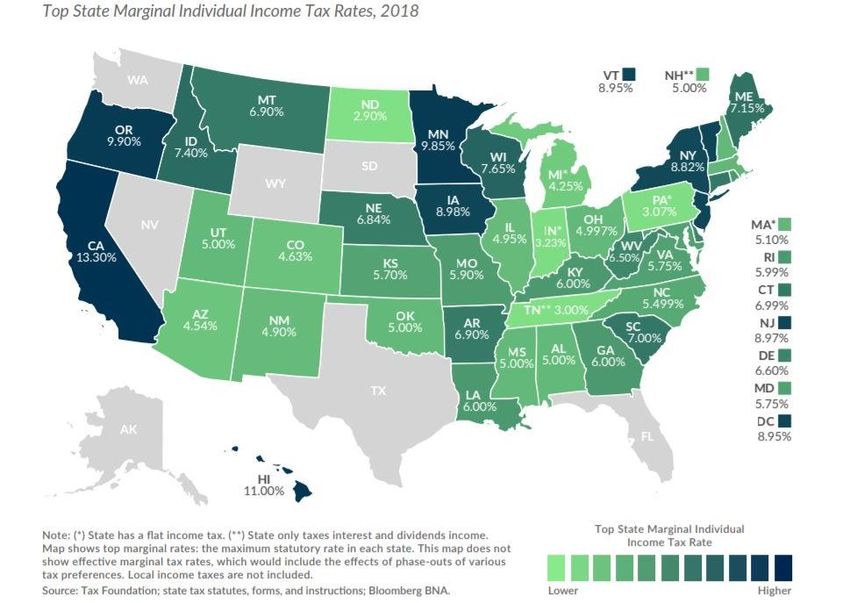
Why Do Demographics Matter?

                     Population Growth                                                         Home Price Growth
                               (2001-2017)                                                          (2001-2017)
30%                                                                                     120%
                                                  27%
                                                                                                                   101%

                                                                                        90%

20%                   ~2X                                                                       ~2X
                      Growth                                                                    Growth
                             14%                                                        60%
                                                                                                   52%

10%

                                                                                        30%

0%                                                                                       0%
                                  Population                                                      Median Home Price

                           U.S.              Seattle                                                U.S.          Seattle

 As of July 2, 2018. Source: Biggest US Cities by Population; Zillow Home Value Index

                                                                                                                            3
Brookfield Global Listed Real Estate - Brookfield ...
Cost of Living

2 Parent & 2 Child Households – Per Month
                             San Francisco                                                                       Austin
    Housing                                                           $3,121      -$1,870   Housing                         $1,251
    Food                                                                  $998              Food                              $738
    Child Care                                                         $1,730               Child Care                      $1,108
    Transportation                                                     $1,114               Transportation                  $1,150
    Health Care                                                        $1,152               Health Care                       $964
    Other Necessities                                                  $1,662               Other Necessities                 $802
    Taxes                                                             $2,593      -$1,875   Taxes                            $718
    Monthly Total                                                   $12,370       -$5,639   Monthly Total                   $6,731

                             New York City                                                                      Nashville
    Housing                                                           $1,789      -$787     Housing                         $1,002
    Food                                                                  $908              Food                              $792
    Child Care                                                         $2,773               Child Care                      $1,052
    Transportation                                                        $589              Transportation                  $1,170
    Health Care                                                        $1,238               Health Care                     $1,170
    Other Necessities                                                  $1,088               Other Necessities                 $724
    Taxes                                                             $1,958      -$1,265   Taxes                            $693
    Monthly Total                                                   $10,343       -$3,740   Monthly Total                   $6,603

 As of March 2018. Source: Economic Policy Institute. Costs are in 2017 dollars

                                                                                                                                     4
Brookfield Global Listed Real Estate - Brookfield ...
Quality of Life

   Average One-Way                                                           Average Yearly
   Commute Time                                                              Temperature

   Austin                 23.8 min                                           Miami            77.05 F

   Nashville              24.3 min                                           Austin            69.4 F

   Miami                  28.5 min                                           Nashville        59.25 F

   Chicago                31.3 min                                           San Francisco     57.3 F

   San Francisco          32.4 min                                           New York         55.15 F

   New York City          40.3 min                                           Chicago           51.3 F

 As of December 20, 2017. Source: US Census Bureau 2016; usclimatedata.com

                                                                                                        5
Brookfield Global Listed Real Estate - Brookfield ...
Current State Income Taxes

 As of March 5, 2018. Source: taxfoundation.org 2018

                                                       6
Brookfield Global Listed Real Estate - Brookfield ...
Future Tax Liabilities – Pension Liabilities

          Pension Promises Grew Faster than GDP                                                                       Funded Ratios Declining
                                      (2003-2016)                                                                                  (2003-2016)

 New York                                                                                      New York

                                                     141% difference
New Jersey                                                                                   New Jersey
                                                                                                                                         -62% difference
 California
                                                                                                California

    Illinois
                                                                                                    Illinois

Tennessee

                                                                                              Tennessee
     Texas

                                                                                                    Texas

               0% 20% 40% 60% 80% 100% 120% 140% 160% 180%                                                     0%      20%         40%      60%    80%     100%   120%
                                                                                                                                         2003
                                    GDP
                                    Accrued Liabilities                                                                                  2016

    As of July 20, 2018. Source: Overpromising has crippled public pensions. A 50-state survey by Ted Dabrowski and John Klinger

                                                                                                                                                                    7
Brookfield Global Listed Real Estate - Brookfield ...
Future Tax Liabilities – Aging Infrastructure

                                                              Aging Infrastructure by Area
               60%

               50%

               40%

               30%

               20%

               10%

                 0%
                         CALIFORNIA           NEW YORK             ILLINOIS            NORTH              TEXAS           TENNESSEE   FLORIDA
                                                                                      CAROLINA

                                                   % of Roads in Poor Condition             % of Structurally Deficient Bridges

 As of April 10, 2018. Source: U.S. Department of Transportation; 2017 Infrastructure Report Card.

                                                                                                                                                8
Brookfield Global Listed Real Estate - Brookfield ...
Historical Population Growth

Coastal & Northern                                                           Sunbelt
3.5%                                                                         3.5%

3.0%                                                                         3.0%

2.5%                                                                         2.5%

2.0%                                                                         2.0%

1.5%                                                                         1.5%

1.0%                                                                         1.0%

0.5%                                                                         0.5%

0.0%                                                                         0.0%
       2011

                2012

                            2013

                                        2014

                                                   2015

                                                               2016

                                                                      2017

                                                                                    2011

                                                                                           2012

                                                                                                  2013

                                                                                                            2014

                                                                                                                       2015

                                                                                                                               2016

                                                                                                                                      2017
                       San Francisco             New York                                          Austin          Nashville

  As of December 20, 2017. Source: U.S. Census Bureau, 2017.

                                                                                                                                             9
Brookfield Global Listed Real Estate - Brookfield ...
Faster Growth in Sunbelt Talent Pools

                                      Texas                                       Tennessee
                                      Residents with bachelor’s                    Residents with bachelor’s
                                      degrees                                      degrees

                                       3.2M                  21.0%                 712K              16.7%
                                       Total                 Growth                Total             Growth
                                                             (2010-2016)                             (2010-2016)
                                      549K                                         102K
                                      New since 2010                               New since 2010

      California                                               New Jersey                                   New York
       Residents with bachelor’s                               Residents with bachelor’s                    Residents with bachelor’s
       degrees                                                 degrees                                      degrees

       5.1M                  13.7%                              1.7M                                         2.7M             12.1%
       Total                 Growth
                                                                Total
                                                                                 10.8%                       Total
                                                                                                                              Growth
                             (2010-2016)                                         Growth
        619K                                                    138K             (2010-2016)                 286K             (2010-2016)

        New since 2010                                                                                       New since 2010
                                                                New since 2010

 As of December 20, 2017. Source: U.S. Census Bureau 2016.

                                                                                                                                            10
Recent Corporate Relocations and Expansions

                                      Austin                                                                   Nashville

              Company                                              Jobs                   Company                          Jobs
              Apple                                         5k - 15,000                   Amazon                           5,000
              Oracle                                             10,000                   Alliance Bernstein               1,050
              Charles Schwab                                       1,500                  Asurion                           400
              Indeed                                               1,500                  Tenneco                           200
              Amazon                                                 800                  Five Star Custom Foods            138
              General Motors                                         500                  Medline Industries                100
              PIMCO                                                  200

As of September 1, 2018. Source: Austin Chamber of Commerce (2017-2018); Nashville Chamber of Commerce (2017-2018).

                                                                                                                                   11
Dual Demographic Wave

                 Annual U.S. Population Change

                                                                                 Forecasted
                                                                                                                 Annual U.S. Population Change

                                                                                                                                                 Forecasted
                                       (Ages 25-45)                                                                         (Ages 65+)

           2.2                                                                                             2.2

            2                                                                                               2

           1.8                                                                                             1.8

           1.6                                                                                             1.6

           1.4                                                                                             1.4

           1.2                                                                                             1.2

                                                                                                Millions
Millions

            1                                                                                               1

           0.8                                                                                             0.8

           0.6                                                                                             0.6

           0.4                                                                                             0.4

           0.2                                                                                             0.2

            0                                                                                               0
                 1970
                 1972
                 1974
                 1976
                 1978
                 1980
                 1982
                 1984
                 1986
                 1988
                 1990
                 1992
                 1994
                 1996
                 1998
                 2000
                 2012
                 2014
                 2016
                 2018
                 2020
                 2022
                 2024

                                                                                                                 1970
                                                                                                                 1972
                                                                                                                 1974
                                                                                                                 1976
                                                                                                                 1978
                                                                                                                 1980
                                                                                                                 1982
                                                                                                                 1984
                                                                                                                 1986
                                                                                                                 1988
                                                                                                                 1990
                                                                                                                 1992
                                                                                                                 1994
                                                                                                                 1996
                                                                                                                 1998
                                                                                                                 2000
                                                                                                                 2002
                                                                                                                 2004
                                                                                                                 2006
                                                                                                                 2008
                                                                                                                 2010
                                                                                                                 2012
                                                                                                                 2014
                                                                                                                 2016
                                                                                                                 2018
                                                                                                                 2020
                                                                                                                 2022
                                                                                                                 2024
           As of December 20, 2017. Source: U.S. Census Bureau 2017 National Population Projection Data.

                                                                                                                                                              12
Migration Pattern

 As of December 20, 2017. Source: U.S. Census Bureau 2017

                                                            13
Higher Growth in Sunbelt Office Jobs

Coastal & Northern                                                                                         Sunbelt
 6%                                                                                                         6%

 5%                                                                                                         5%

 4%                                                                                                         4%                                                                           50% growth

 3%                                                                                                         3%
                                                                                                                                                                                         40% growth
 2%                                                                            21% growth
                                                                                                            2%
 1%                                                                                                         1%
                                                                                    7% growth
 0%                                                                                                         0%
 -1%                                                                                                        -1%
 -2%                                                                                                        -2%
 -3%                                                                                                        -3%
 -4%                                                                                                        -4%
 -5%                                                                                                        -5%
 -6%
                                                                                                            -6%
       2005

              2006

                     2007

                            2008

                                   2009

                                          2010

                                                 2011

                                                        2012

                                                               2013

                                                                      2014

                                                                             2015

                                                                                      2016

                                                                                             2017

                                                                                                    2018

                                                                                                                  2005
                                                                                                                         2006
                                                                                                                                2007
                                                                                                                                       2008
                                                                                                                                              2009
                                                                                                                                                     2010
                                                                                                                                                            2011
                                                                                                                                                                   2012
                                                                                                                                                                          2013
                                                                                                                                                                                 2014
                                                                                                                                                                                        2015
                                                                                                                                                                                               2016
                                                                                                                                                                                                      2017
                                                                                                                                                                                                             2018
                            San Francisco                      New York                                                                       Austin                 Nashville

 As of January 31, 2018. Source: Bureau of Labor Statistics (BLS) and Baird Research.

                                                                                                                                                                                                                    14
Office Employment & Net Migration Forecasts

Q2 2018 – Q2 2020 Forecast

                                  3.0%                                                           Austin
                                                                                                              Orlando
                                                                             Houston
                                                                                   Dallas
                                  2.5%
                                                                                                 Las Vegas                                     Tampa
                                                                                San Antonio
 Office-using Employment Growth

                                                                                         Phoenix      Raleigh
                                  2.0%
                                                                                  Miami
                                                                                     Nashville
                                               Memphis
                                  1.5%             Baltimore                                 Charlotte
                                                                                            Atlanta                                       U.S. National
                                                Chicago
                                                                        Sacramento
                                                              San Diego
                                  1.0%        Los Angeles            Norfolk
                                                                     Boston
                                                                                            San Francisco
                                                            New York
                                  0.5%
                                                                       Washington D.C.

                                  0.0%
                                      -2.0%   -1.0%            0.0%            1.0%              2.0%            3.0%         4.0%      5.0%           6.0%
                                                                            Net Migration (% of Population)

                                                  Gateway       Major Non-Gateway         Secondary Sunbelt        Secondary Snowbelt

 As of September 13, 2018. Source: Cushman & Wakefield.

                                                                                                                                                          15
Office Supply

                                                  San Francisco                                                                                                                                                         Austin

                                                                                                                               Forecasted

                                                                                                                                                                                                                                                                                   Forecasted
5%                                                                                                                                                  40%   12%                                                                                                                                          40%
                                                                                                                                                    35%                                                                                                                                                35%
4%                                                                                                                                                        10%
                                                                                                                                                    30%                                                                                                                                                30%
                                                                                                                                                          8%
3%                                                                                                                                                  25%                                                                                                                                                25%
                                                                                                                                                    20%   6%                                                                                                                                           20%
2%                                                                                                                                                  15%                                                                                                                                                15%
                                                                                                                                                          4%
                                                                                                                                                    10%                                                                                                                                                10%
1%                                                                                                                                                        2%
                                                                                                                                                    5%                                                                                                                                                 5%
0%                                                                                                                                                  0%    0%                                                                                                                                           0%
        1988
               1990
                      1992
                             1994
                                    1996
                                           1998
                                                  2000
                                                         2002
                                                                2004
                                                                       2006
                                                                              2008
                                                                                      2010
                                                                                              2012
                                                                                                      2014
                                                                                                              2016
                                                                                                                      2018
                                                                                                                              2020
                                                                                                                                             2022

                                                                                                                                                                1988
                                                                                                                                                                       1990
                                                                                                                                                                              1992
                                                                                                                                                                                     1994
                                                                                                                                                                                            1996
                                                                                                                                                                                                   1998
                                                                                                                                                                                                          2000
                                                                                                                                                                                                                 2002
                                                                                                                                                                                                                         2004
                                                                                                                                                                                                                                2006
                                                                                                                                                                                                                                       2008
                                                                                                                                                                                                                                              2010
                                                                                                                                                                                                                                                     2012
                                                                                                                                                                                                                                                            2014
                                                                                                                                                                                                                                                                   2016
                                                                                                                                                                                                                                                                          2018
                                                                                                                                                                                                                                                                                 2020
                                                                                                                                                                                                                                                                                                2022
                        Completions (% of existing stock)                                                   Vacancy Rate                                                         Completions (% of existing stock)                                           Vacancy Rate

                                                         New York                                                             Forecasted                                                                         Nashville

                                                                                                                                                                                                                                                                                  Forecasted
 4%                                                                                                                                                 20%   8%                                                                                                                                           25%
 3%                                                                                                                                                 18%   7%
 2%                                                                                                                                                 16%                                                                                                                                                20%
                                                                                                                                                          6%
 1%                                                                                                                                                 14%
                                                                                                                                                    12%   5%                                                                                                                                           15%
 0%
                                                                                                                                                    10%   4%
-1%
                                                                                                                                                    8%    3%                                                                                                                                           10%
-2%                                                                                                                                                 6%
-3%                                                                                                                                                       2%
                                                                                                                                                    4%                                                                                                                                                 5%
-4%                                                                                                                                                 2%    1%
-5%                                                                                                                                                 0%    0%                                                                                                                                           0%
        1988
               1990
                      1992
                             1994
                                    1996
                                           1998
                                                  2000
                                                         2002
                                                                2004
                                                                       2006
                                                                              2008
                                                                                     2010
                                                                                             2012
                                                                                                     2014
                                                                                                             2016
                                                                                                                     2018
                                                                                                                             2020
                                                                                                                                            2022

                                                                                                                                                                1988
                                                                                                                                                                       1990
                                                                                                                                                                              1992
                                                                                                                                                                                     1994
                                                                                                                                                                                            1996
                                                                                                                                                                                                   1998
                                                                                                                                                                                                          2000
                                                                                                                                                                                                                 2002
                                                                                                                                                                                                                         2004
                                                                                                                                                                                                                                2006
                                                                                                                                                                                                                                       2008
                                                                                                                                                                                                                                              2010
                                                                                                                                                                                                                                                     2012
                                                                                                                                                                                                                                                            2014
                                                                                                                                                                                                                                                                   2016
                                                                                                                                                                                                                                                                          2018
                                                                                                                                                                                                                                                                                 2020
                                                                                                                                                                                                                                                                                                2022
                      Completions (% of existing stock)                                                Vacancy Rate                                                             Completions (% of existing stock)                                             Vacancy Rate

      As of December 31, 2018. Source: CBRE Econometric Advisors.

                                                                                                                                                                                                                                                                                                       16
Office Rents

                                                                                   Cumulative Rent Growth
         200%

                                                                                                                                                                                                                                             164%

         150%                                                                                                                                                                                                                                158%

         100%

                                                                                                                                                                                                                                             75%

                                                                                                                                                                                                                                             65%
           50%

            0%

          -50%
                   1988
                          1989
                                 1990
                                        1991
                                               1992
                                                      1993
                                                             1994
                                                                    1995
                                                                           1996
                                                                                  1997
                                                                                         1998
                                                                                                1999
                                                                                                       2000
                                                                                                              2001
                                                                                                                     2002
                                                                                                                            2003
                                                                                                                                   2004
                                                                                                                                          2005
                                                                                                                                                 2006
                                                                                                                                                        2007
                                                                                                                                                               2008
                                                                                                                                                                       2009
                                                                                                                                                                              2010
                                                                                                                                                                                     2011
                                                                                                                                                                                            2012
                                                                                                                                                                                                   2013
                                                                                                                                                                                                          2014
                                                                                                                                                                                                                 2015
                                                                                                                                                                                                                        2016
                                                                                                                                                                                                                               2017
                                                                                                                                                                                                                                      2018
                                                                       San Francisco                          Austin                 New York                         Nashville

 As of December 31, 2018. Source: CBRE Econometric Advisors.

                                                                                                                                                                                                                                                    17
Apartment Supply

                                        San Francisco                                                                                                                         Austin

                                                                                                                                                                                                                                Forecasted
                                                                                              Forecasted
6%                                                                                                                        9%   6%                                                                                                                       9%
                                                                                                                          8%                                                                                                                            8%
5%                                                                                                                             5%
                                                                                                                          7%                                                                                                                            7%
4%                                                                                                                        6%   4%                                                                                                                       6%
                                                                                                                          5%                                                                                                                            5%
3%                                                                                                                             3%
                                                                                                                          4%                                                                                                                            4%
2%                                                                                                                        3%   2%                                                                                                                       3%
                                                                                                                          2%                                                                                                                            2%
1%                                                                                                                             1%
                                                                                                                          1%                                                                                                                            1%
0%                                                                                                                        0%   0%                                                                                                                       0%
     2008
            2009
                   2010
                          2011
                                 2012
                                         2013
                                                2014
                                                       2015
                                                              2016
                                                                     2017
                                                                            2018
                                                                                   2019
                                                                                           2020
                                                                                                            2021
                                                                                                                   2022

                                                                                                                                    2008
                                                                                                                                           2009
                                                                                                                                                  2010
                                                                                                                                                         2011
                                                                                                                                                                2012
                                                                                                                                                                       2013
                                                                                                                                                                              2014
                                                                                                                                                                                     2015
                                                                                                                                                                                            2016
                                                                                                                                                                                                   2017
                                                                                                                                                                                                          2018
                                                                                                                                                                                                                 2019
                                                                                                                                                                                                                         2020
                                                                                                                                                                                                                                         2021
                                                                                                                                                                                                                                                2022
                   Completions (% of existing stock)                                      Vacancy                                                 Completions (% of existing stock)                                     Vacancy

                                           New York                                                                                                                       Nashville
                                                                                               Forecasted

                                                                                                                                                                                                                            Forecasted
6%                                                                                                                        9%   6%                                                                                                                       9%
                                                                                                                          8%                                                                                                                            8%
5%                                                                                                                             5%
                                                                                                                          7%                                                                                                                            7%
4%                                                                                                                        6%   4%                                                                                                                       6%
                                                                                                                          5%                                                                                                                            5%
3%                                                                                                                             3%
                                                                                                                          4%                                                                                                                            4%
2%                                                                                                                        3%   2%                                                                                                                       3%
                                                                                                                          2%                                                                                                                            2%
1%                                                                                                                             1%
                                                                                                                          1%                                                                                                                            1%
0%                                                                                                                        0%   0%                                                                                                                       0%
     2008
            2009
                   2010
                          2011
                                 2012
                                         2013
                                                2014
                                                       2015
                                                              2016
                                                                     2017
                                                                            2018
                                                                                   2019
                                                                                           2020
                                                                                                            2021
                                                                                                                   2022

                                                                                                                                    2008
                                                                                                                                           2009
                                                                                                                                                  2010
                                                                                                                                                         2011
                                                                                                                                                                2012
                                                                                                                                                                       2013
                                                                                                                                                                              2014
                                                                                                                                                                                     2015
                                                                                                                                                                                            2016
                                                                                                                                                                                                   2017
                                                                                                                                                                                                          2018
                                                                                                                                                                                                                 2019
                                                                                                                                                                                                                         2020
                                                                                                                                                                                                                                         2021
                                                                                                                                                                                                                                                2022
                   Completions (% of existing stock)                                      Vacancy                                                 Completions (% of existing stock)                                     Vacancy

 As of December 31, 2018. Source: Axiometrics, a RealPage Company.

                                                                                                                                                                                                                                                       18
Apartment Rents

                                                                   Cumulative Rent Growth
         80%

         70%                                                                                                                                                                    71%

         60%
                                                                                                                                                                                55%
         50%
                                                                                                                                                                                50%

         40%

         30%
                                                                                                                                                                                25%
         20%

         10%

           0%

        -10%

        -20%
                 1Q08

                        3Q08

                               1Q09

                                      3Q09

                                             1Q10

                                                     3Q10

                                                            1Q11

                                                                   3Q11

                                                                          1Q12

                                                                                 3Q12

                                                                                        1Q13

                                                                                               3Q13

                                                                                                        1Q14

                                                                                                               3Q14

                                                                                                                      1Q15

                                                                                                                             3Q15

                                                                                                                                      1Q16

                                                                                                                                             3Q16

                                                                                                                                                    1Q17

                                                                                                                                                           3Q17

                                                                                                                                                                  1Q18

                                                                                                                                                                         3Q18
                                                    San Francisco                Austin               New York City                 Nashville

As of December 31, 2018. Source: Axiometrics, a RealPage Company.

                                                                                                                                                                                      19
Key Takeaways

      Demographics drive demand for real estate

                  Demographic demand for Sunbelt cities is significantly
                  better

                               Strong case for both employees and employers to
                               migrate

                                            We continue to watch supply closely, but not an issue
                                            currently

                                                         Several attractively priced REITs with exposure to
                                                         Southern office and residential markets in the portfolio

As of June 30, 2018. Past performance is not indicative of future results.

                                                                                                                    20
What We See As Benefits of REIT Investing

                                                                                     Exposure to
                                                                                     Real Estate

                                                                                         REIT        Income
                                                 Equity
                                                                                       Investing    Investing
                                               Investing
                                                                                                    Potential

                                                                                  Diversification

Diversification does not guarantee a profit nor protect from loss in a declining market.                        21
REITs – Attractive Investment Potential

                  Simple business
                 model, transparent                Ability to access
                 quarterly reporting                  public and
                   monitored by                    private debt and
                     regulatory                     equity markets
                      agencies

                                         Why
                                       Invest in
                                        REITs?

          Professional                                             Low
          Management                                             Leverage
             Team

                                         Daily
                                       Liquidity
                                                                            22
REIT Company Examples

 Major Cities - Office
Boston Properties                                                                              SL Green
• Owns or holds interests in 197 commercial properties                                         • New York City's largest owner of Office real estate
• Properties: Boston, Los Angeles, New York, San                                               • Owns or holds interests in 30 Manhattan office buildings
  Francisco and Washington, DC

        Salesforce Tower (Rendering) San Francisco, CA, U.S.                                        420 Lexington Avenue New York, The Graybar Building.

 Derwent London PLC                                                                            Japan Real Estate Investment Corporation
• Derwent London owns predominantly an office portfolio in                                      • The company owns a portfolio of 73 office properties
  13 ‘villages’ in London’s West End and Tech Belt                                                focused on the Tokyo market

        The White Chapel Building London.                                                           Otemachi Financial City North Tower.

For illustrative purposes only. Information is as of March 31, 2019 and subject to change without notice. The mention of a specific security is not a recommendation to buy or sell.
Past performance is not indicative of future results.
                                                                                                                                                                                       23
REIT Company Examples

Major Cities - Retail
Simon Property Group Inc                                                                       Unibail-Rodamco-Westfield
• S&P 100 company with total market capitalization of $56                                        • One of Europe’s largest listed commercial property
  billion                                                                                          companies, with a portfolio of over 150 retail assets
• Owns or has an interest in 200+ retail real estate properties                                    throughout the EU, UK and US

     Walt Witman Shops Huntington Station New York.                                                   Les Quatre Temps, Paris

 Hammerson PLC                                                                                 Scentre Group
• Portfolio includes investments in 21 prime shopping                                           • Scentre Group owns and operates 41 shopping centers in
  centers in the U.K., Ireland and France                                                         Australia and New Zealand

     Union Square Aberdeen, U.K.                                                                    Westfield Bondi Junction, Sydney, Australia

For illustrative purposes only. Information is as of March 31, 2019 and subject to change without notice. The mention of a specific security is not a recommendation to buy or sell.
Past performance is not indicative of future results.                                                                                                                                  24
Income and Capital Appreciation

                     Combination of Capital Appreciation and Income Return
                     (12/31/1996 – 3/31/2019)
                                                                                                                                           Capital Appreciation
                      10%
                                                  8.90%                                                                                    Income
                       9%
                       8%                                                                                                                  Total Return
                       7%                         3.65%                                             6.21%
                       6%                                                                                                                             5.19%
                       5%                                                                                                                             0.15%
                       4%                                                                           4.33%
                       3%
                                                  5.25%                                                                                               5.04%
                       2%
                       1%                                                                           1.88%
                       0%
                                            Global REITs                                    Global Equities                                    Global Bonds
 Yield
 (3/31/2019)                                    3.90%                                              2.65%                                             1.77%
 Correlation with
 Global REITs
 (12/31/1996 –                                    1.00                                              0.77                                               0.57
 3/31/2019)
As of March 31, 2019. Source: Bloomberg; Brookfield Public Securities Group LLC Reflects longest common available time period for all indexes shown. The index data presented above
includes is shown for illustrative purposes only. Global REITs represented by the S&P Developed REIT Index for the period 12/31/1996 through 1/31/2005 and the FTSE EPRA Nareit
Developed Index for the period 2/1/2005 to the latest date. Global Equities represented by the MSCI World Index; Global Bonds by the ICE BofAML Global Corporate Bond Index. See
end of this presentation for additional disclosures and definitions.
                                                                                                                                                                                 25
Historical Hedge Against Inflation

•        The growth in REIT distributions has historically outpaced the rate of inflation
•        Property values have tended to rise during inflationary periods
REIT Dividend Growth vs. Inflation
12%
         10.2%
                                                                         9.6%
10%
                                                                                       8.6%                                      8.4%
    8%                                                                                               7.3%
                                                                                                                   6.5%                        6.3%
    6%                                                                                                                                                       4.8%
                           4.1%
    4%                                                                          3.0%                                                                                       3.3%          4.4% Avg.
             2.5%                                  2.7%
                                                                                              1.7%                                                    2.1%          2.1%          1.9%
    2%                                                            1.5%                                      1.5%
                    0.5%              0.1%
                                                                                                                          0.8%          0.7%                                             1.9% Avg.
    0%
                                  -0.4%                   -0.4%
-2%

-4%

-6%

-8%
                                             -7.5%
-10%
           2006        2007         2008        2009            2010        2011         2012          2013          2014           2015         2016          2017          2018

          Global REITs Annual Growth in Dividends per Share
          U.S. Consumer Price Index
Sources: Bloomberg and Morningstar. Global REITs reflects        factors relevant to any such comparison such as differences         differ given different tax treatment of income versus capital
the FTSE EPRA Nareit Developed Index. The above                  in the volatility, and regulatory and legal restrictions between    gain and other factors, such as the capital structure of the
indexes do not reflect deductions for fees, expenses or          the indexes shown and an actively managed investment                investment. Past performance does not guarantee results.
taxes. Indexes are not managed, and investors cannot             strategy. See index definitions at the end of this                  The Consumer Price Index is a measure of the average
invest directly in an index. Performance is shown for            presentation. Investing in real estate securities involves          change over time in the prices paid by urban consumers for
illustrative purposes only and does not predict or depict the    different risks, including the loss of principal. The tax           a market basket of consumer goods and services.
performance of any investment. There may be material             treatment of returns of the asset classes listed above may
                                                                                                                                                                                              26
REIT Dividend Growth Has Historically Outpaced Inflation

Annual Growth In Dividends and Major Expenses (2006-2018)
                                       College
5.0%
                                       Tuition
                                                                  REIT
4.5%                                    Costs
                                                                Dividends
4.0%
                                                                                             Healthcare
3.5%                                                                                           Costs
3.0%

2.5%                                     75%                          72%
                                         Total                        Total
                                                                                                                              Core
2.0%                                   Increase                     Increase                       53%                      Inflation
                                                                                                   Total
                                                                                                 Increase
1.5%                                                                                                                            28%
                                                                                                                                Total
1.0%                                                                                                                          Increase

0.5%

0.0%

  REIT Dividend growth has outpaced core inflation as well as Healthcare Costs while also
                 keeping pace with the rapid rise in College Tuition Costs

Sources: Bloomberg and Bureau of Labor Statistics. Global REITs reflects the FTSE EPRA Nareit Developed Index. Core CPI represents U.S. CPI Urban Consumers; Healthcare Costs
represented by US CPI Urban Consumers Medical Care Services; College Tuition Costs represented by U.S. CPI College Tuition & Fees
                                                                                                                                                                         27
Real Estate Has Low Correlation With Equities

The correlation with broader equities has been below 0.5 during most periods
 Trailing 5 year correlation between
 U.S. REITs and U.S. Equities
 0.9

 0.8

 0.7

 0.6

 0.5

 0.4

 0.3

 0.2

 0.1

    0

Sources: Bloomberg U.S. REITs reflects the MSCI US REIT Total Return Gross Index. U.S. Equities represents the S&P 500 Total Return Index.
                                                                                                                                             28
Global Real Estate vs. Global Equities

Global Real Estate has underperformed Global Equities since the Fed began
raising rates, providing an attractive opportunity to add exposure
   135
                                                                                                               Global Equities
                                                                                                                returned ~33%     Global Equities
   130                                                                                                        through 9/30/2018+30% During the period

   125

   120
                                                                                                                                      Global
                                                                                                                           Global Equities   Real Estate
                                                                                                                                           fell
   115                                                                                                                             +15%  During the period
                                                                                                                              13.3%  in Q4

   110                                                                                                       Global Real Estate
                                                                                                                      Global
                                                                                                               returned ~6% Real Estate
   105                                                                                                                  was down only
                                                                                                             through 9/30/2018
                                                                                                                          5.5% in Q4
   100

     95

     90

                                     Global Real Estate Securities                     Global Equities

As of March 31, 2019. Sources: Bloomberg, MSCI, FTSE EPRA Nareit. Global Real Estate represented by FTSE EPRA Nareit Developed Total Return Index USD; Global Equities
represented by MSCI World Gross Total Return USD Index.
                                                                                                                                                                  29
REIT Fund Flows

U.S. Mutual Fund and ETF Flows and AUM             Japan Mutual Fund AUM

Source: Citi Research and Lipper as of 3/28/2019    Source: Citi Research and Bloomberg as of 3/28/19

                                                                                                        30
Balance Sheets Over The Past Decade

We believe significantly improved balance sheets decrease the risk associated with
rising rates
Debt to Total Assets: All listed U.S. equity REITs
                            70

                            65
                                                                                                          FOMC Tightening Cycle
                            60
                                                                                                          Debt/Market Assets
 Debt to Total Assets (%)

                            55

                            50

                            45

                            40

                            35

                            30

                            25
                                 2003   2004   2005   2006   2007   2008   2009   2010   2011   2012   2013   2014     2015       2016   2017   2018

As of September 30, 2018. Source: Nareit. FOMC: Federal Open Market Committee
                                                                                                                                                       31
Average Global Valuations

Global Historical Premium (Discount) to NAV

 30%

 20%

 10%

  0%

-10%
                                                                           Historical Average: -7.4%                                                                                       Current:
                                                                                                                                                                                           -5.9%
-20%

-30%

-40%

-50%

             Global Premium (Discount) to NAV
             Historical Average

As of March 31, 2019. Represents data beginning January 1995. Represents estimated average public market valuations relative to estimated average private market valuations for
global real estate. NAV or Net Asset Value is the "market value" of all a company's assets, including but not limited to its properties, after subtracting the “market value” of all its
liabilities and obligations. Source: UBS Global Real Estate Research; Brookfield Public Securities Group LLC research and estimates.

                                                                                                                                                                                           32
Global Real Estate – Valuation Dispersions Across Geographies

Although global real estate in aggregate trades near its historical average, many
regions trade at meaningful discounts to their long-term averages
Premium (Discount) to NAV by Geography
 80%
180%

 60%
160%

 40%
140%

 20%
120%

  0%
100%

-20%
80%

-40%
60%

-60%
40%

-80%
20%

             Current
             Historical 10th to 90th Percentile
             Historical Maximum/Minimum
 As of March 31, 2019. Represents data beginning January 1995. Valuation dataset duration varies by geography and is dependent on data availability for each individual market.
 Represents estimated average public market valuations relative to estimated average private market valuations for each real estate market. NAV or Net Asset Value is the "market value"
 of all a company's assets, including but not limited to its properties, after subtracting the “market value” of all its liabilities and obligations. The geographies and sectors are defined by
 UBS Global Research and BMO Capital Markets and do not necessarily reflect any widely followed indexes. Source: UBS Global Real Estate Research; Brookfield Public Securities
 Group research and estimates. Canada data sourced from BMO Capital Markets.

                                                                                                                                                                                            33
U.S. Real Estate – Wide Valuation Spreads in Select Sectors

Intra-sector valuations remain wide in most U.S. sectors

Premium (Discount) to NAV by Sector
70%

60%

50%

40%

30%

20%

10%

 0%

-10%

-20%

-30%

-40%

-50%

-60%

-70%

-80%
            Office           Industrial         Diversified       Apartment          Healthcare       Regional Mall       Strip Center        Net Lease           Hotels          Self-Storage

             Current Sector Average
             Current Range from Sector Minimum to Sector Maximum

As of March 31, 2019. Represents estimated average public market valuations relative to estimated average private market valuations for each real estate sector. NAV or Net Asset
Value is the "market value" of all a company's assets, including but not limited to its properties, after subtracting the “market value” of all its liabilities and obligations. Sectors are defined
by Brookfield Public Securities Group LLC research and estimates and do not necessarily reflect any widely followed indexes. Source: Brookfield Public Securities Group LLC research.
Information referenced herein represents U.S. Real Estate Securities and not specific Fund or Strategy information.
                                                                                                                                                                                                 34
The Real Estate Securities Team

Seasoned leadership team supported by a deep roster of analysts
Investment   Jason Baine                         Bernhard Krieg, CFA
Leadership   Portfolio Manager                   Portfolio Manager
             23 Years of Investing Experience    21 Years of Investing Experience
             18 Years with Brookfield            13 Years with Brookfield
             Launched Brookfield’s real estate   Extensive long/short and real estate
             securities platform in 2001         securities experience

Analysts     James Allison                       Jamieson Duff, CFA                     Anar Isman, CFA
             Continental, Central and Eastern    U.S. Industrial;                       U.S. Residential and Timber;
             Europe; Nordic Countries            Japanese REITS                         Japanese Developers; Canada
             16 Years of Experience              8 Years of Experience                  15 Years of Experience
             7 Years with Brookfield             8 Years with Brookfield                7 Years with Brookfield

             Kevin Mueller                       Julian Perlmutter, CFA                 Michael Shoemacher
             Generalist                          U.S. Student Housing; Storage; Data    U.S. Healthcare; United Kingdom;
             2 Years of Experience               Centers and Towers; Hong Kong; China   Australia
             1 Year with Brookfield              16 Years of Experience                 15 Years of Experience
                                                 7 Years with Brookfield                7 Years with Brookfield

             Richard Sweigard                    John Wallace, CFA                      Matt Wenman, CFA
             U.S. Office, Diversified and        U.S. Strip Center Retail;              Product Specialist;
             Regional Malls; Singapore           Triple Net Lease; Global Hotels        Portfolio and Market Analytics
             18 Years of Experience              18 Years of Experience                 13 Years of Experience
             14 Years with Brookfield            3 Years with Brookfield                13 Years with Brookfield

Trader       Rob Kosar
             23 Years of Experience
             14 Years with Brookfield

                                                                                                                           35
Brookfield Global Listed Real Estate Fund Portfolio Characteristics
  March 2019

  Asset Allocation                                                                                         Allocation Changes

N. America -2.7%                                                                                             N. America                             +0.9%
                        U.S. Sectors
                                U.S.                             Portfolio                                                             U.S.
                                                                                                                               U.S. Sectors                                    Current
                           Healthcare                                                       10.0%                                 Healthcare                                      10.0%
                                                                         6.9%                                                                                      6.2%
                          Residential                                                9.1%                                         Residential                               9.1%
                                                                                  8.7%                                                                                          10.5%
                               Office                                              8.7%                                                Office                              8.7%
                                                                              7.3%                                                                               5.6%
                           Net Lease                                5.3%                                                           Net Lease                    5.3%
                                                                       5.9%                                                                             2.5%
                                Retail                            4.9%                                                                  Retail                 4.9%
                                                                               7.7%                                                                                                 11.1%
                         Self Storage                       4.0%                                                                 Self Storage               4.0%
                                                          3.6%       Benchmark                                                                          2.3%                     One Year Ago
                                Hotel                      3.6%                                                                         Hotel               3.6%
                                                         3.3%                                                                                                    5.2%
                            Industrial                    3.5%                                                                      Industrial              3.5%
                                                                4.9%                                                                                      3.0%
                        Data Centers            1.5%                                                                            Data Centers         1.5%
                                                  2.1%                                                                                                     3.2%
                            Specialty    0.0%                                                                                       Specialty    0.0%
                                                1.3%                                                                                                     2.7%
                                         0.0%                                                                                      Diversified   0.0%
                           Diversified          1.4%                                                                                             0.0%
                             Canada                 2.5%                                                                            Canada
                                                                                                                                     Canada              2.5%
                             Canada                  2.7%                                                                                        0.0%

  Asia Pacific                             +0.8%                                                            Asia Pacific                                 +3.1%
                                                                                                   12.2%                               Japan                                              12.2%
                               Japan                                                           11.1%                                                                                      12.3%
                                                                                     8.5%                                   Hong Kong/China                                8.5%
                     Hong Kong/China                                                 8.5%                                                                       5.2%
                                                           3.8%                                                                 Australia/N.Z.              3.8%
                        Australia/N.Z.                        4.8%                                                                                         3.7%
                                                          3.3%                                                               Singapore/Other              3.3%
                      Singapore/Other                  2.7%                                                                                                3.6%

       Europe                                   +1.0%                                                          Europe       -2.2%
                                                                                              10.9%                        Continental Europe                                       10.9%
                   Continental Europe                                                             12.4%                                                                          10.0%
                                                                              7.2%                                                       U.K.                           7.2%
                                 U.K.                            4.8%                                                                                                             10.4%

                                                                                Active Weight
                                                                                                                                                                        One Year Change
                                                                                     Portfolio
                                                                                                                                                                          Current Portfolio
                                                                                  Benchmark
                                                                                                                                                                   Portfolio One Year Ago

As of March 31, 2019 and includes Cash. Benchmark refers to the FTSE EPRA Nareit Developed Index. Weights and portfolio holdings are subject to change. Due to rounding,
amounts presented herein may not add up precisely to the total. See end of this presentation for additional disclosures and definitions.                                                          36
Southeastern & Midwest Multifamily REIT

o      Established owner and operator of
       multifamily apartment communities in
       the Southeast and Midwest United                                                                                   Market Exposure
                                                                                                                           (% of Net Operating Income)
       States
o      Portfolio of over 100,000 units in 17
       states
o      $11.5B market capitalization                                                                                                            13%
o      $126 million development pipeline
                                                                                                                        32%
                                                                                                                                                          9%

                                                                                                                                                          7%

                                                                                                                         4%                              6%
                                                                                                                             5%                      4%
                                                                                                                                  6%           7%
                                                                                                                                          7%

Acklen Apartments - Nashville

                                                                                                                   Atlanta, GA                 Dallas, TX
                                                                                                                   Charlotte, NC               Austin, TX
                                                                                                                   Nashville, TN               Washington, DC
                                                                                                                   Tampa, FL                   Orlando, FL
                  Canyon Point Apartments - Austin                                                                 Raleigh/Durham, NC          Fort Worth, TX
                                                                                                                   Other

    As of June 30, 2018. Source: Company filings. Properties identified in the image are held indirectly by the Fund as of March 31, 2019. .
                                                                                                                                                                37
Hong Kong – Office Landlord

Central portfolio creates a network effect of international commerce

Source: Company filings. Properties identified in the image are held indirectly by the Fund as of March 31, 2019. .
                                                                                                                      38
Hong Kong – Office Landlord

Gross Assets as of June 30, 20181

                                                                                                              90% Investment Properties

                                                                                                              77% Hong Kong

                                                                                     Central office portfolio average rent

                     Central office market
                        continues to have
                      stable rent growth

As of June 30, 2018. Source: Company filings. Shown for illustrative purposes only
                                                                                                                                     39
Hong Kong – Office Landlord

Worries of a U.S./China trade war have caused a                                                           Portfolio trades well below replacement cost at
selloff for Hong Kong landlords, we believe this is                                                       US$1,800/SF
overdone                                                                                                  • Henderson Land purchased an adjacent land site for
                                                                                                             US$6,400/sf ($3bn) and are under-writing US$8,000/sf
Attractive Current Valuation                                                                                 total construction costs.
• 7.5% implied cap rate                                                                                   • Cheung Kong Assets Sold its “The Center” which is on
• Implied US$1,800/SF                                                                                        the border of Central for US$5bn or US$4,300/sf
• 13x Price/FFO                                                                                           • Private transactions have had cap rates of 2-3%
• 3.1% dividend yield
• 0.43x Price/Book, near a 10 year low (57% Discount)                                                     High barriers to entry
                                                                                                          • Hong Kong Island will see virtually no new supply in
                           Price to Book Ratio                                                               coming years
1.2x
                                                                                                          • Landlord’s high-quality Central portfolio has only 1%
1.1x
                                                                                                             vacancy
1.0x
0.9x                                                                                                      Management proactively addressing valuation
0.8x                                                                                                      • Enacted first share buyback since 2008, repurchased
                                                                    Average = 0.66x
0.7x                                                                                                        $130m of securities year to date
0.6x                                                                                                      • We expect share buybacks to continue if pricing
0.5x                                                                                                        dislocation persists
0.4x
                                                                  Current = 0.43x
0.3x

As of March 31, 2019. Source: Brookfield Public Securities Group LLC and company filings. 1) Valuation example provided for illustrative purposes only . SF: Square feet. FFO: Funds from operations
                                                                                                                                                                                                       40
Real Estate Universe

    Historical Investment Characteristics
•     Many lease agreements have contractual increases                                               $1.5 trillion
      tied to inflation, leading to generally attractive                                             Total market capitalization
      revenues and cash flows
                                                                                                     (>400 companies)
•     Assets with a history of pricing power—the ability to
      pass along rising costs to customers—which has
      been beneficial in periods of elevated inflation
•     Companies, which are bound by the REIT structure,
      are generally required to distribute 90% of income

                             Healthcare               Shopping Centers       Industrial              Single Family Rental   Self Storage

     Longer Lease Term                                                                                                                          Shorter Lease Term

                         Triple Net Lease      Regional Malls          Office                                Multifamily                   Hotels

    As of December 31, 2018. Source: Brookfield Public Securities Group LLC research and estimates
                                                                                                                                                                     41
Is the correlation between REITs and rates a myth?
                 100%

                   80%

                   60%

                   40%

                                                                                                                              R2 = 0.10
                   20%
Global REITs
    One Year        0%
 Total Return
                  -20%

                  -40%

                  -60%

                                                                                                                                                     Positive GDP Growth
                  -80%
                      -2.5%       -2.0%      -1.5%       -1.0%      -0.5%       0.0%        0.5%       1.0%       1.5%        2.0%       2.5%
                                                                                                                                                     Negative GDP Growth

                                                               10-Year U.S. Treasury Yield
                                                                Year-Over-Year Change

              The correlation is very weak; we believe GDP growth is likely a better indicator

As of September 30, 2018. Source: Bloomberg; Brookfield Public Securities Group LLC Reflects trailing 12-month returns and GDP growth for each quarterly observation for the period
12/31/1992- latest. Reflects longest available time period. Global REITs represented by the S&P Developed REIT Index for the period 12/31/1992 through 1/31/2005 and the FTSE
EPRA Nareit Developed Index for the period 2/1/2005 to the latest date.
                                                                                                                                                                                 42
Brookfield Global Listed Real Estate Fund Key Holdings

Top Ten
                                                                                                                                       Market Cap                               Active
 Ticker        Company                                               Region                         Sector                                                     Weight
                                                                                                                                         (billions)                            Weight1
 VNA.GY          Vonovia SE                                          Continental Europe              Residential                           $26.9               4.5%              2.7%
 AVB             AvalonBay Communities Inc                           U.S.                            Residential                           $27.8               3.8%              2.0%
 KRC             Kilroy Realty Corp                                  U.S.                            Office                                  $7.7              3.4%              2.9%
 MAA             Mid-America Apartment Communities Inc               U.S.                            Residential                           $12.5               3.3%              2.5%
 VTR             Ventas Inc                                          U.S.                            Healthcare                            $22.8               3.2%              1.8%
 PSA             Public Storage                                      U.S.                            Self Storage                          $38.0               3.0%              0.9%
 8802.JP         Mitsubishi Estate Co Ltd                            Japan                           Office                                $25.2               2.9%              1.6%
 8801.JP         Mitsui Fudosan Co Ltd                               Japan                           Office                                $24.9               2.9%              1.4%
 MGP             MGM Growth Properties LLC                           U.S.                            Net Lease                               $2.9              2.7%              2.7%
 SGP             Simon Property Group Inc                            U.S.                            Retail                                $56.3               2.6%             -1.0%
 Total                                                                                                                                                        32.3%

Top Overweight Positions
                                                                                                                                       Market Cap                               Active
  Ticker       Company                                               Region                         Sector                                                     Weight
                                                                                                                                         (billions)                            Weight1
  KRC           Kilroy Realty Corp                                   U.S.                            Office                                  $7.7              3.4%              2.9%
  VNA.GY        Vonovia SE                                           Continental Europe              Residential                           $26.9               4.5%              2.7%
  MGP            MGM Growth Properties LLC                           U.S.                            Net Lease                               $2.9              2.7%              2.7%
  MAA            Mid-America Apartment Communities Inc               U.S.                            Residential                           $12.5               3.3%              2.5%
  DOC           Physicians Realty Trust                              U.S.                            Healthcare                              $3.4              2.3%              2.1%

As of March 31, 2019. 1. Relative to the FTSE EPRA Nareit    securities identified and described do not represent all of the   precisely to the total. Performance data quoted represents
Developed Index (Net of WHT). Weights and portfolio          securities purchased, sold or recommended for the Fund.           past performance, which does not guarantee future
holdings are subject to change. The mention of specific      The reader should not assume that an investment in the            results. No guarantee that the Fund currently holds any of
securities is not a recommendation or solicitation for any   securities identified was or will be profitable. Due to           the names referenced herein. See end of this presentation
person to buy, sell or hold any particular security. The     rounding, amounts presented herein may not add up                 for additional disclosures and definitions.
                                                                                                                                                                                     43
Brookfield Global Listed Real Estate Fund Performance Summary
   (BLRAX, BLRCX, BLRYX)
     Performance Summary as of 3/31/19
                                                                                               Inception                                    One         Three         Five         Since
   (Net of Fees)                                                                                   Date         QTD           YTD           Year       Years
                                                                                                                                                             1
                                                                                                                                                                    Years
                                                                                                                                                                          1
                                                                                                                                                                               Inception
                                                                                                                                                                                         1

      Brookfield Global Listed Real Estate Fund (Class A – excluding sales charge)                 4/30/12    15.16%       15.16%         10.39%         5.79%         6.51%         8.36%
      Brookfield Global Listed Real Estate Fund (Class A – including sales charge)                 4/30/12     9.67%         9.67%         5.15%         4.08%         5.48%         7.60%
      Brookfield Global Listed Real Estate Fund (Class C – excluding sales charge)                 4/30/12    14.97%       14.97%          9.52%         5.01%         5.71%         7.55%
      Brookfield Global Listed Real Estate Fund (Class C – including sales charge)                 4/30/12    13.97%       13.97%          8.52%         5.01%         5.71%         7.55%
      Brookfield Global Listed Real Estate Fund (Class Y)                                         11/30/11    15.29%       15.29%         10.66%         6.06%         6.75%        10.34%
      FTSE EPRA Nareit Developed Index (Net of WHT)                                                           14.59%       14.59%         13.27%         5.68%         6.41%        7.30%2
      FTSE EPRA Nareit Developed Index (Gross of WHT)                                                         14.86%       14.86%         14.33%         6.67%         7.36%        8.20%2

   Performance
   Growth of $10,0002                                                                                                                                                              $16,594
  $17,000
  $16,000
  $15,000                                                                                                                                                                           $16,277
  $14,000
  $13,000
  $12,000
  $11,000
  $10,000
   $9,000
   $8,000
        Apr-12           Jan-13             Oct-13           Jul-14            May-15            Feb-16                 Nov-16              Sep-17            Jun-18             Mar-19
          Brookfield Global Listed Real Estate Fund (Class A – including sales charge) (Net of Fees)
          FTSE EPRA Nareit Developed Total Return Index (Net of WHT)
1) Annualized. As of March 31, 2019.                          or CDSC and if reflected, the sales charge or fee would              of the Fund.
2) References Class A’s inception date.                       reduce the performance quoted. Investment performance                The chart illustrates the performance of a hypothetical
3) Relative to Class A – including sales charge against the   reflects fee waivers, expenses and reimbursements in                 $10,000 investment made in the Fund since inception. Results
FTSE EPRA Nareit Developed Index (Net of WHT).                effect. In the absence of such waivers, total return and             for the Fund are net of management and performance fees.
Performance data quoted represents past performance;          NAV would be reduced. Investment performance reflects                Represents performance since inception of the Fund:
past performance does not guarantee future results. The       fee waivers, expenses and reimbursements in effect. In               November 30, 2011 through March 31, 2019. The quoted
investment return and principal value of an investment        the absence of such waivers, total return and NAV would              benchmarks do not reflect deductions for fees, expenses or
will fluctuate so that an investor’s shares, when             be reduced. The gross operating expense ratio for the                taxes. Benchmark performance is shown for illustrative
redeemed, may be worth more or less than their original       Class A, C, and Y Shares are 1.22%, 1.97%, 0.97%,                    purposes only and does not predict or depict the performance
cost. Current performance of the Fund may be lower or         respectively. The FTSE EPRA Nareit Developed Index is an             of any investment. There may be material factors relevant to
higher than the performance quoted. Performance data          unmanaged market-capitalization-weighted total-return index,         any such comparison such as differences in the volatility, and
current to the most recent month end may be obtained by       which consists of publicly traded equity REITs and listed            regulatory and legal restrictions between the indices shown
calling 855.244.4859. Performance shown including sales       property companies from developed markets. The Index is              and the Fund. See end of this presentation for additional
charge reflects the Class A maximum sales charge of           unmanaged and, unlike the Fund, is not affected by cash              disclosures and definitions.
4.75% and the Class C Contingent Deferred Sales Charge        flows, trading and expenses. It is not possible to invest directly
(CDSC) of 1.00%. Performance data excluding sales             in an index. Index performance is shown for illustrative                                                                     44
charge does not reflect the deduction of the sales charge     purposes only and does not predict or depict the performance
Brookfield Global Listed Real Estate Fund

                                                                                                    Fund Characteristics
Fund AUM                                     Fund Inception
                                                                                                                                 BLRAX            BLRCX           BLRYX        Benchmark

$1.9 billion Nov-11
                                                                                                   Distribution Rate1              3.78%            3.13%           3.99%               4.04%
Concentration in names and themes
                                                                                                   30 Day SEC Yield
• Best ideas globally: generally 40 to 70 securities
                                                                                                   (subsidized)2                   2.36%            1.74%           2.73%                  --
• Top 10 holdings represent approximately 30% to 40% of
  total portfolio                                                                                  30 Day SEC Yield
                                                                                                   (unsubsidized)2                 2.35%            1.72%           2.71%                  --

Individual holdings                                                                                Weighted Average
• High conviction/large cap 3% to 10%                                                              Market Cap                     $15.8B           $15.8B          $15.8B           $15.6B
• Other 1% to 3%
                                                                                                   Number of
                                                                                                   Holdings                            58               58              58                333
Active weights
                                                                                                   Top 10
•   Limited underweight positions
                                                                                                   Concentration                   32.3%            32.3%           32.3%               20.2%
•   Typical overweight per position 0.5% or 2.0%
•   Target portfolio active share generally ~65%                                                   Non-Benchmark
•   Benchmarked to the FTSE EPRA Nareit Developed Index                                            Exposure                         4.2%             4.2%             4.2%                 --
    (Net of WHT3)

As of March 31, 2019. As of December 31, 2018 the Fund estimates approximately 33.87% of its distributions is a return of capital. Targets are subject to change without notice.
The manager makes no warranty that the targets will be achieved. 1) The distribution rate is calculated as the annualized amount of the most recent quarterly distribution declared
divided by March 31, 2019 Net Asset Value per share. This calculation does not include any non-income items such as loan proceeds or borrowings. The Fund estimates that it
has distributed more than its net investment income and net realized capital gains; therefore, a portion of your distribution may be a return of capital. 2) Class A. As of March 31,
2019, 30 Day SEC Yield does not include income that is determined to be from return of capital. Assets are preliminary and subject to change. 3) Withholding Tax (WHT). Assets
reflect the Brookfield Global Listed Real Estate Fund. Benchmark performance is shown for illustrative purposes only and does not predict or depict the performance of any
investment. There may be material factors relevant to any such comparison such as differences in the volatility, and regulatory and legal restrictions between the indices shown
and the Fund. Past performance is not indicative of future results.

                                                                                                                                                                                          45
Disclosures

Must be preceded or accompanied by a current prospectus.             by a fund in lower-rated and non-rated securities presents a
                                                                     greater risk of loss to principal and interest than higher-rated
Mutual fund investing involves risk. Principal loss is possible.
                                                                     securities. Some securities held may be difficult to sell,
Investing in real estate securities involves different risks,
                                                                     particularly during times of market turmoil. If a fund is forced
including the loss of principal. The tax treatment of returns of
                                                                     to sell an illiquid asset to meet redemption, the fund may be
the asset classes listed above may differ given different tax
                                                                     forced to sell at a loss. Using derivatives exposes a fund to
treatment of income versus capital gain and other factors such
                                                                     additional risks, may increase the volatility of a fund’s net
as the capital structure of the investment. Unlike bonds, REIT
                                                                     asset value and may not provide the result intended. Since a
distributions are not fixed and may fluctuate (positively or
                                                                     fund will invest more than 25% of its total assets in securities
negatively) over time based on market conditions. Moreover,
                                                                     in the real estate industry, a fund may be subject to greater
the underlying property values of a REIT may increase or
                                                                     volatility than a fund that is more broadly diversified. Past
decline over time causing the value of the REIT to increase or
                                                                     performance is no guarantee of future results. Opinions
decline accordingly. Investors in bonds receive a principal
                                                                     expressed are subject to change at any time, are not guaranteed
payment are par value upon maturity, unless the bond defaults
                                                                     and should not be considered investment advice.
or is called. Below are real estate related risk disclosures that
apply to Brookfield real estate mutual funds. Property values        Diversification does not guarantee a profit or protect from loss in a
may fall due to increasing vacancies or declining rents              declining market.
resulting from unanticipated economic, legal, cultural or
                                                                     Fund holdings and sector allocations are subject to change and are
technological developments. REITs are dependent upon
                                                                     not recommendations to buy or sell any security. Current and future
management skills and generally may not be diversified. REITs
                                                                     portfolio holdings are subject to risk.
are subject to heavy cash flow dependency, defaults by
borrowers and self-liquidation . Of course, along with any           INDEX PROVIDER DISCLAIMER
benefits realized through the effects of rising inflation,           Brookfield Public Securities Group LLC does not own or participate
companies that own and operate real assets will likely               in the construction, or day-to-day management of the indices
experience rising operating costs associated with the goods          referenced in this document. The index information provided is for
and services they provide. As inflation rises, there is no           your information only and does not imply or predict that a Brookfield
assurance that they will have the pricing power to pass along        Public Securities Group LLC product will achieve similar results.
such costs to customers. There are also independent factors          This information is subject to change without notice.
that could hinder their ability to perform in periods of rising
inflation. For example, unfavorable changes in the regulatory        The Indices referenced in this document do not reflect any fees,
environment, rapidly rising interest rates or unforeseen             expenses, sales charges, or taxes. It is not possible to invest
imbalances in supply and demand could make it difficult for          directly in an index. The index sponsors permit use of their indices
real estate, infrastructure, natural resource, and commodity         and related data on an "As Is" basis, makes no warranties regarding
securities to keep pace with inflation. Please see important         same, does not guarantee the suitability, quality, accuracy,
disclosures at the end for additional risk considerations.A fund     timeliness, and/ or completeness of their index or any data included
may invest in small and mid-cap companies, which involve             in, related to, or derived therefrom, assumes no liability in
additional risks such as limited liquidity and greater volatility.   connection with the use of the foregoing. The index sponsors have
A fund may invest in foreign securities which involve greater        no liability for any direct, indirect, special, incidental, punitive,
volatility and political, economic and currency risks and            consequential, or other damages (including loss profits). The index
differences in accounting methods. Investing in emerging             sponsors do not sponsor, endorse, or recommend Brookfield Public
markets may entail special risks relating to potential               Securities Group LLC or any of its products or services.
economic, political or social instability and the risks of           There may be material factors relevant to any such comparison
nationalization, confiscation or the imposition of restrictions      such as differences in the volatility, and regulatory and legal
on foreign investment. Debt securities rated below investment        restrictions between the indices shown and the strategy.
grade are commonly referred to as “junk bonds” and are
considered speculative. Increases in interest rates can cause
the prices of fixed income securities to decline, and the level
of current income from a portfolio of fixed income securities
may decline in certain interest rate environments. Investment
                                                                                                                                             46
Disclosures

INDEX DEFINITIONS                                                         DEFINITIONS
The FTSE EPRA Nareit Developed Total Return Index is an                   FOMC is the Federal Open Market Committee; the monetary
unmanaged market-capitalization-weighted total-return index, which        policymaking body of the Federal Reserve System.
consists of publicly traded equity REITs and listed property
                                                                          Active Share is a measure of the percentage of stock holdings in a
companies from developed markets.
                                                                          manager's portfolio that differs from the benchmark index.
The FTSE EPRA Nareit Developed Index is calculated by the FTSE
                                                                          Alpha is a measure of the difference between a fund's actual
Group. Performance is calculated by price, total return and net total
                                                                          returns and its expected performance, given its level of risk as
return and the Index is calculated daily. Constituents must meet
                                                                          measured by beta.
minimum market capitalization, liquidity requirements, and real
estate activity requirements in order to be included within the Index.    Annualized Return is periodic returns rescaled to a period of one
North American and Asian companies must be of a minimum of                year.
US$200 million in market capitalization with liquidity of US$100          Bps = basis points.
million. European companies are bound by €50 million market cap
minimum and liquidity of €25 million. The Net version of the index is     Cash flows refer to the amount of cash generated and used by a
calculated net of applicable withholding tax, however does not            company over a given period.
reflect deductions for fees, expenses, or other taxes.                    Consumer Price Index (CPI) is a measure that examines the
The S&P Developed REIT Index serves as a benchmark of publicly            weighted average of prices of a basket of consumer goods and
traded equity REITs domiciled in developed markets.                       services, such as transportation, food and medical care. It is
                                                                          calculated by taking price changes for each item in the
The NCREIF Fund Index – Open End Diversified Core Equity (NFI-            predetermined basket of goods and averaging them.
ODCE) is a capitalization-weighted, gross of fee, time-weighted
return index with an inception date of December 31, 1977. Open-           Correlation, in the finance and investment industries, is a statistic
end funds are generally defined as infinite-life vehicles consisting of   that measures the degree to which two securities move in relation
multiple investors who have the ability to enter or exit the fund on a    to each other. Correlations are used in advanced portfolio
periodic basis, subject to contribution and/or redemption requests,       management, computed as the correlation coefficient, which has a
thereby providing a degree of potential                                   value that must fall between -1.0 and +1.0.

The MSCI World Gross Total Return Index is a free float-adjusted          Pice-to-book ratio, or P/B ratio, is a financial ratio used to
market-capitalization-weighted index that is designed to measure          compare a company's current market price to its book
the equity market performance of developed markets. investment            value.
liquidity
                                                                          R2 is a percentage measure of how often one variable changes
The ICE BofA Merrill Lynch Global Corporate Index is an                   when another variable changes. In statistical terms, it is a measure
unmanaged, commonly accepted measure of the performance of                of how correlated a group of actual observations are to a model’s
global investment grade corporate securities.                             predictions.
The above-mentioned indexes do not reflect deductions for fees,           Standard Deviation measures the degree to which an investment’s
expenses or taxes. The indexes are unmanaged and cannot be                return varies from its mean return.
purchased directly by investors. Index performance is shown for
                                                                          The SEC yield is based on a 30-day period ending on the last day
illustrative purposes only and does not predict or depict the
                                                                          of the previous month. It is computed by dividing the net investment
performance of any investment.
                                                                          income per share earned during the period by the maximum
The MSCI US REIT Index is a free float-adjusted market                    offering price per share on the last day of the period.
capitalization weighted index that is comprised of equity Real Estate
                                                                          Yield refers to the earnings generated and realized on an
Investment Trusts (REITs).
                                                                          investment over a particular period of time, and is expressed in
The S&P 500® Index is an unmanaged weighted index of 500 large            terms of percentage based on the invested amount or on the
company stocks that is widely-recognized as representative of the         current market value or on the face value of the security.
performance of the U.S. stock market. Indexes are not managed
                                                                          Quasar Distributors, LLC is the distributor of Brookfield Investment
and an investor cannot invest directly in an index.
                                                                          Funds and Brookfield Public Securities Group LLC is the Investment
                                                                          Advisor.                                                                47
You can also read