Mapletree Commercial Trust - Investor Presentation 20 November 2020
←
→
Page content transcription
If your browser does not render page correctly, please read the page content below
Mapletree Commercial Trust
           Investor Presentation
             20 November 2020

                                   0
Important Notice
This presentation is for information only and does not constitute an offer or solicitation of an offer to sell or invitation to
subscribe for or acquire any units in Mapletree Commercial Trust (“MCT”, and the units in MCT, the “Units”).

The past performance of MCT and Mapletree Commercial Trust Management Ltd., in its capacity as manager of MCT (the
“Manager”), is not indicative of the future performance of MCT and the Manager. The value of the Units and the income
derived from them may fall as well as rise. Units are not obligations of, deposits in, or guaranteed by, the Manager or any
of its affiliates. An investment in Units is subject to investment risks, including the possible loss of the principal amount
invested. Investors have no right to request the Manager to redeem their Units while the Units are listed. It is intended that
unitholders may only deal in their Units through trading on the Singapore Exchange Securities Trading Limited (“SGX-
ST”). Listing of the Units on the SGX-ST does not guarantee a liquid market for the Units.

This presentation may also contain forward-looking statements that involve assumptions, risks and uncertainties. Actual
future performance, outcomes and results may differ materially from those expressed in forward-looking statements as a
result of a number of risks, uncertainties and assumptions. Representative examples of these risks, uncertainties and
assumptions include (without limitation) general industry and economic conditions, interest rate trends, cost of capital and
capital availability, competition from similar developments, shifts in expected levels of property rental income, changes in
operating expenses (including employee wages, benefits and training costs), governmental and public policy changes and
the continued availability of financing in the amounts and the terms necessary to support future business. You are
cautioned not to place undue reliance on these forward-looking statements, which are based on the Manager’s current
view of future events.

Nothing in this presentation should be construed as financial, investment, business, legal or tax advice and you should
consult your own independent professional advisors. Neither the Manager nor any of its affiliates, advisers or
representatives shall have any liability whatsoever (in negligence or otherwise) for any loss howsoever arising, whether
directly or indirectly, from any use, reliance or distribution of this presentation or its contents or otherwise arising in
connection with this presentation. This presentation shall be read in conjunction with MCT’s business updates for the First
Half from 1 April 2020 to 30 September 2020 in the SGXNET announcement dated 22 October 2020.

                                                                                                                                  1
Content
Overview of SREITs Page 3
Overview of Mapletree Commercial Trust Page 6
Overcoming the COVID-19 Headwinds Page 25
Completed Acquisition of Page 29
Mapletree Business City II
Active Asset Management to Create Value Page 34
1H FY20/21 Business Updates Page 43
Other Information Page 54
2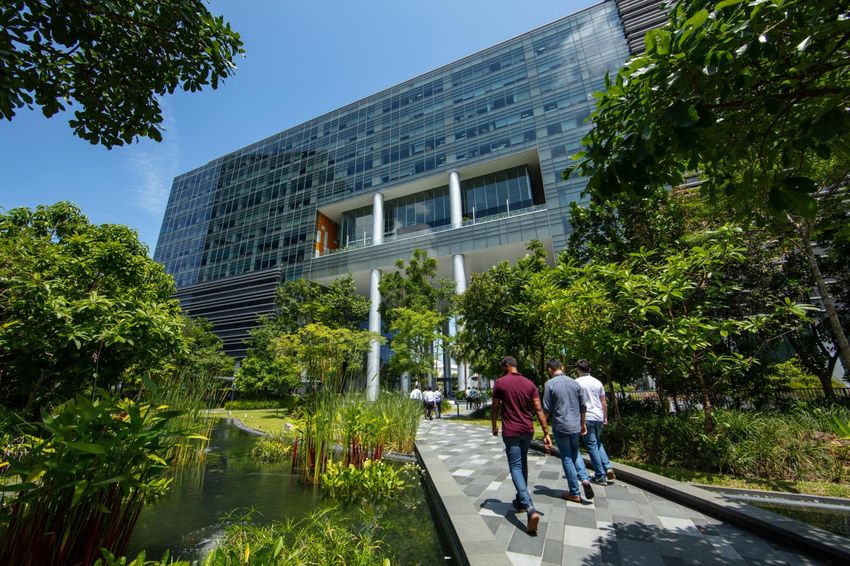
Overview of SREITs/Business Trusts
Total of 41 REITs and Business Trusts listed in Singapore
Combined market capitalisation of S$100.7 bil
Market Capitalisation by Sector
Healthcare, $2.7 bil, 3%
Retail, $11.1 bil, 11%
MCT
Industrial, $40.9 bil, 40% $6.6 bil, 6.6%
Diversified, $29.4 bil, 29%
Hospitality , $6.8 bil, 7% Office, $9.9 bil, 10%
Note: Based on data from Bloomberg as at 13 November 2020
3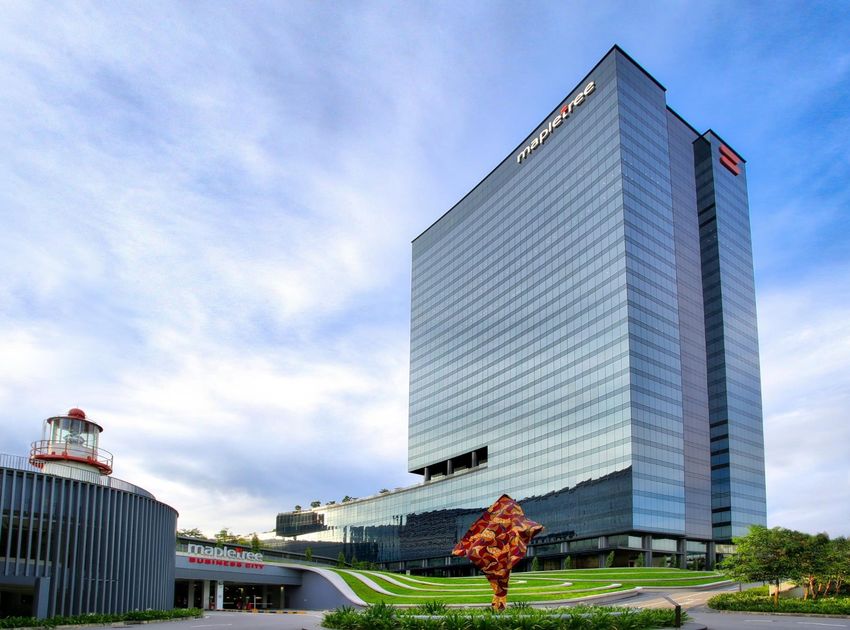
Overview of SREITs/Business Trusts

                                Market Capitalisation of the 15 Largest SREITs
          14.00
                                                    (S$ bil)
                   12.94

          12.00
                           11.01

          10.00

                                    7.99
           8.00                             7.08
                                                   6.63
           6.00
                                                            4.56   4.28
                                                                          3.90
           4.00                                                                  3.51
                                                                                        3.05   2.95
                                                                                                      2.37
                                                                                                             1.90   1.84   1.60
           2.00

              -

Note: Based on data from Bloomberg as at 13 November 2020

                                                                                                                                  4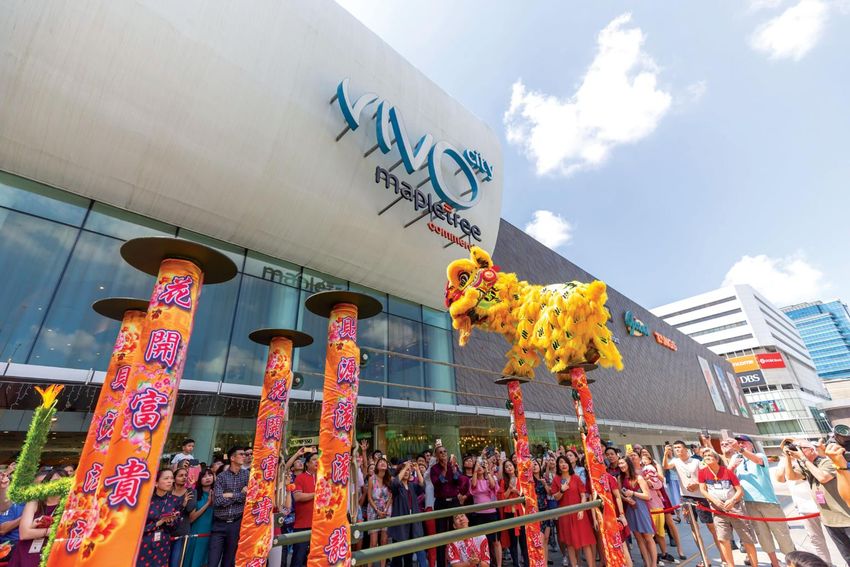
Overview of SREITs – Legislative Comparison
                        Malaysia                    South-Korea                South-Korea             Japan                 Singapore            Thailand              Hong Kong              Taiwan                  Philippines
                                                    (K-REITs)                  (CR-REITs)
Management              External                    Internal/External          Internal/External       External              External             External              Internal/External      Internal/External       External
Structure

Minimum Real            75%                         70%                        70%                     75%                   75%                  75%                   100%                   75%1                    75%
Estate
investments

Foreign Assets          OK                          OK                         OK                      OK                    OK                   OK                    OK                     OK(with Central         Up to 40%
                                                                                                                                                                                               Bank approval)          (with
                                                                                                                                                                                                                       approval)

Development             Up to 10% of total          Up to 30% of total         Prohibited              Prohibited            Up to 25% of         Up to 10% of          Up to 10% of           Up to 15% of net        Prohibited2
                        assets                      assets                                                                   deposited            net asset value       deposited              worth
                                                                                                                             property                                   property

Gearing Limit           50% of total asset          Maximum Debt               No gearing for          No restriction        50% of total         35% of total          45% of total           35% of total            35% of total
                        value                       equity ratio 2:1           investment                                    assets3              assets4               assets                 assets4                 assets4
                                                                               purpose

Payout                  If payout is > 90%,         > 90% of net               > 90% of net            > 90% of              90% of taxable       > 90% of net          > 90% of net           > 90% of taxable        > 90% of net
                        undistributed               income                     income                  taxable               income (no           profit                income after tax       income (post            profit
                        income is tax                                                                  income (post          depreciation)                                                     depreciation)
                        exempted                                                                       depreciation)

Tax                     Yes                         No                         No                      Yes                   Yes                  Yes                   Yes                    Yes                     Yes
Transparency

Tax Concession          Yes, final                  No                         No                      No                    10%                  Non resident          Yes6                   No                      No
for Investor5           withholding tax of                                                                                   withholding tax      individuals and
                        10% for individuals                                                                                  for non              companies are
                        and non-corporate                                                                                    resident             exempt from
                        investors, up to 31                                                                                  companies            Thai tax
                        Dec 2019                                                                                             until Dec 2025

Note 1: Includes cash, government bonds and ABS instruments. SREITs are required to invest 35% in real estate and at least 70% in real estate and real estate-related assets, such as shares of property companies
Note 2: Unless the REIT intends to hold such property post completion and provided that contract value/investment in such property development does not exceed 10% of property deposited
Note 3: MAS had on 16 Apr 2020 raised the leverage limit for REITs listed on SGX from 45% to 50% (up to 31 Dec 2021) and deferred to 1 Jan 2022, the requirement to have a minimum adjusted interest coverage ratio of 2.5 times
before the leverage limit can be increased from the then prevailing 45% limit (up to a maximum of 50%)
Note 4: May exceed 35% gearing cap if the REIT obtains and discloses a credit rating from a major rating agency
Note 5: Tax exemption at REIT level only applicable for distributed income to resident unitholders
Note 6: Exempt for all domestic unitholders, no specific exemption provided for foreign investors, but income from REIT distributions not taxed in practice

Source: UBS Global Research - Singapore Property Report and MAS Code on Collective Investment Schemes
                                                                                                                                                                                                                                     5
Overview of
Mapletree Commercial Trust

                             VivoCity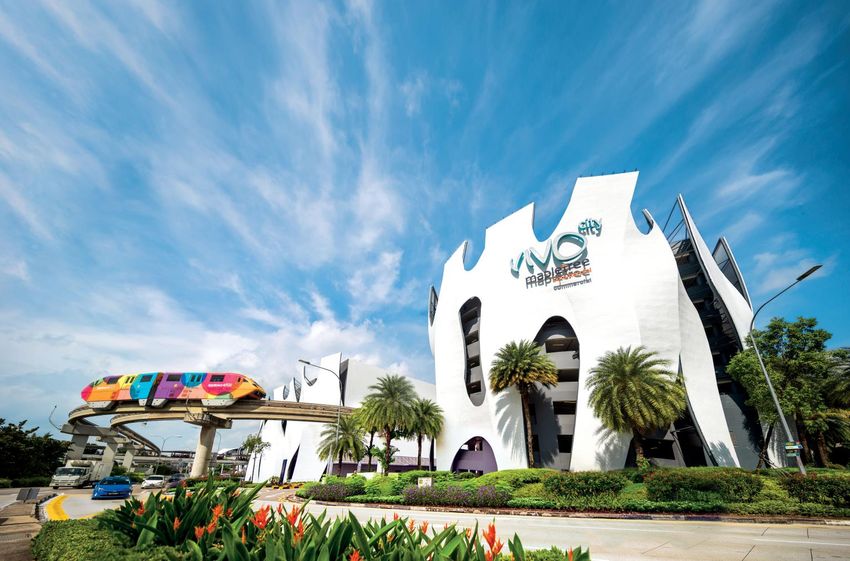
Mapletree Commercial Trust (“MCT”)
Public
Mapletree Commercial Trust Unitholders
MIPL
Mapletree Investments Pte Ltd
Sponsor
(“MIPL” or the “Sponsor”) 67.6% 32.4%1
Mapletree Commercial Trust Management Trustee –
Ltd. (“MCTM” or the “Manager”)
Manager DBS
— Wholly-owned subsidiary of the
Sponsor
Sponsor Stake 32.4%1
Manager –
Primarily retail and / or office assets MCTM
Investment Mandate
in Singapore
Portfolio
5 properties valued at S$8,717 mil Property
Portfolio
Approximately 5.0 mil square feet NLA VivoCity Manager –
Mapletree Business City (“MBC”) MCPM
Mapletree Commercial Property
Management Pte. Ltd. (“MCPM”) PSA Building
Property Manager
— Wholly-owned subsidiary of the Mapletree Anson
Sponsor
Bank of America Merrill Lynch HarbourFront
Trustee DBS Trustee Limited (the “Trustee”) (“MLHF”)
Credit Rating Moody’s – Baa1 (negative)
1. As at 30 September 2020
7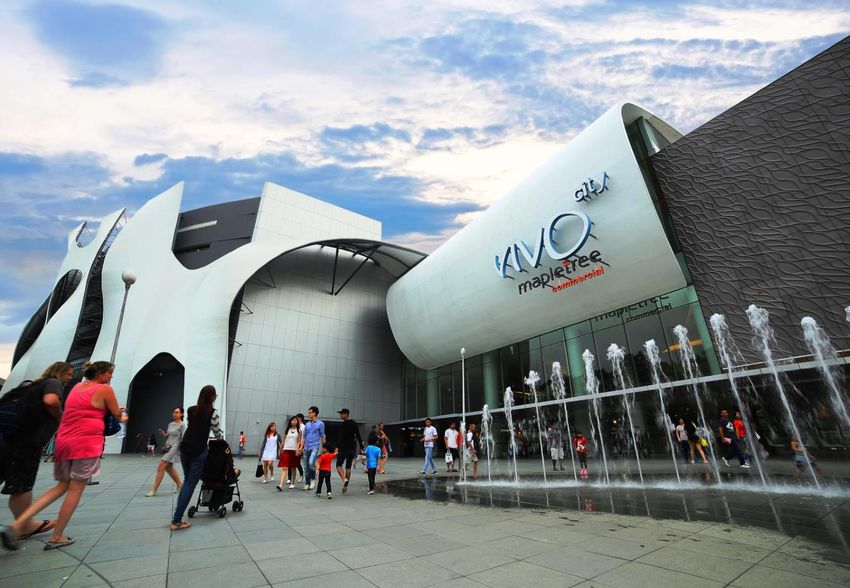
A Snapshot of MCT

           VivoCity                         MBC                       PSA Building                  Mapletree Anson                      MLHF

                  Key Indicators                                          At IPO                                    As at 30 September 2020

 NLA (‘000 sq ft)                                                          1,6681                                              5,033
                                                                                                    201.7%

 Investment Properties (S$ million)                                        2,822                                               8,717
                                                                                                    208.9%

 Net Asset Value Per Unit (S$)                                              0.91                                                1.71
                                                                                                     87.9%

 Market Capitalisation (S$ million)                                        1,6382                                             6,4293
                                                                                                    292.5%

 Free Float (S$ million)                                                    9494                                              4,3465
                                                                                                    355.4%

 Total returns since IPO (%)                                                  -                                               205.06

1.   Excluding PSA Building asset enhancement which was deemed to have an expected NLA of 102,505 square feet at the time of IPO
2.   Based on IPO Price of S$0.88 per unit and 1,861 million units in issue
3.   Based on Unit price of S$1.94 as at 30 September 2020 and 3,313.9 million units in issue
4.   Market capitalisation at IPO less the proportion deemed to be held by the Sponsor
5.   Market capitalisation on 30 September 2020 less the proportion deemed to be held by the Sponsor
6.   Comprises 120.5% in capital appreciation gains based on IPO Price of S$0.88 and Unit Price of S$1.94 at close of trading on 30 September 2020
     and 84.6% in distribution gains based on total distributions of 74.43 Singapore cents paid out/payable. Total does not add up due to rounding

                                                                                                                                                     8
Quality Portfolio of
Best-In-Class Commercial
Properties

                           VivoCity
Portfolio Location
Includes some of the best-in-class assets
10Portfolio Details (IPO Assets)
VivoCity PSA Building MLHF
Integrated development comprising a
Singapore’s largest mall located in the
40-storey office building and a A 6-storey premium office building with
HarbourFront Precinct. A 3-storey
3-storey retail centre known as the basement carpark located in the
shopping complex with 2 basement levels
Alexandra Retail Centre, located in the HarbourFront Precinct
and a 8-storey annexe carpark
Alexandra Precinct
NLA: 1,076,267 square feet NLA: 523,839 square feet NLA: 215,734 square feet
Number of leases: 352 Number of leases: 115 Number of leases: 3
Title: 99 years commencing from 1 Title: 99 years commencing from 1 Title: 99 years commencing from 1
October 1997 October 1997 October 1997
Market valuation: S$3,148 million Market valuation: S$761 million Market valuation: S$338 million
Note: All information, except NLA and number of leases, are as at 30 September 2020
11Portfolio Details (Assets Acquired After IPO)
Mapletree Anson MBC
MBC I MBC II
A 19-storey building in the Central Business MBC, comprising MBC I and MBC II, is a large scale integrated office and business park
District with Grade A office building development with Grade A building specifications. It comprises one office tower and seven
specifications business park blocks, supported by ancillary retail space
Acquisition Date: 4 February 2013 Acquisition Date: 25 August 2016 Acquisition Date: 1 November 2019
NLA: 328,852 square feet NLA: 1,707,202 square feet NLA: 1,184,704 square feet
Number of leases: 23 Number of leases: 39 Number of leases: 48
Title: 99 years commencing from 22 Title: Strata Lease commencing from 25 Title: 99 years commencing from 1
October 2007 August 2016 to 29 September 2096 October 1997
Market valuation: S$747 million Market valuation: S$2,189 million Market valuation: S$1,534 million
Note: All information, except NLA and number of leases, are as at 30 September 2020
12Portfolio Valuation
Portfolio revalued to S$8.7 bil mainly due to COVID-19 impact
Capitalisation rates remained unchanged
Valuation Valuation
as at 30 September 20201 as at 31 March 20201
S$ million S$ per sq ft NLA Capitalisation Rate (%) S$ million
VivoCity 3,148.0 2,924 psf 4.625% 3,262.0
Office: 3.90%
MBC I 2,189.0 1,282 psf 2,198.0
Business Park: 4.95%
Business Park: 4.90%
MBC II 1,534.0 1,295 psf 1,560.0
Retail: 4.75%
Office: 4.00%
PSA Building 761.0 1,453 psf 791.0
Retail: 4.85%
Mapletree Anson 747.0 2,269 psf 3.50% 762.0
MLHF 338.0 1,567 psf 3.90% 347.0
MCT Portfolio 8,717.0 8,920.0
1. The valuation for VivoCity was undertaken by Savills Valuation and Professional Services (S) Pte. Ltd., while the valuations for MBC I and II, PSA Building,
Mapletree Anson and MLHF were undertaken by CBRE Pte. Ltd.
13Established & Trusted
Track Record
Mapletree Business CitySustained Earnings from Healthy Asset Performance
Gross Revenue (S$ mil) Net Property Income (S$ mil)
377.9
347.6
338.8
482.8
443.9 292.3
433.5
377.7
220.7
211.7
195.3
282.5 287.8
267.2
171.5
156.0
219.5 218.7
177.3 124.0
FY11/12 1 FY12/13 FY13/14 FY14/15 FY15/16 FY16/17 FY17/18 FY18/19 FY19/20 1H FY11/12 1 FY12/13 FY13/14 FY14/15 FY15/16 FY16/17 FY17/18 FY18/19 FY19/20 1H
FY20/21 FY20/21
1. FY11/12 – For the period from Listing Date of 27 April 2011 to 31 March 2012
2. Refers to Compound Annual Growth Rate (“CAGR”) from FY11/12 (restated) to FY19/20. FY11/12 (restated) figures are restated from the period from Listing Date to 31 March
2012 to the full period of 1 April 2011 to 31 March 2012 for a comparable basis for CAGR calculation
15Long-term Sustainable Returns to Unitholders
Amount Available Distribution Per Unit
For Distribution (S$ million) (Singapore cents)
S$43.7 mil of distribution S$43.7 mil of distribution
retained in 4Q FY19/20 to retained in 4Q FY19/20 to
better position for COVID-19 better position for COVID-19
uncertainties. Of this, S$15.0 uncertainties. Of this, S$15.0
mil was released and included mil was released and included
in the 1H FY20/21 distribution in the 1H FY20/21 distribution
260.4 264.0 9.14
9.04
243.2 8.62
227.2 8.00 8.13 8.00
7.372
6.487
168.3 172.5
153.0 5.271
138.4
123.5
4.17
98.2
1 1
FY11/12 FY12/13 FY13/14 FY14/15 FY15/16 FY16/17 FY17/18 FY18/19 FY19/20 1H FY11/12 FY12/13 FY13/14 FY14/15 FY15/16 FY16/17 FY17/18 FY18/19 FY19/20 1H
FY20/21 FY20/21
1. FY11/12 – For the period from Listing Date of 27 April 2011 to 31 March 2012
2. Refers to Compound Annual Growth Rate (“CAGR”) from FY11/12 (restated) to FY19/20. FY11/12 (restated) figures are restated from the period from Listing Date to 31 March
2012 to the full period of 1 April 2011 to 31 March 2012 for a comparable basis for CAGR calculation
16Solid Track Record of Creating Value
Investment Properties Net Asset Value per Unit
(S$ million) (S$) 1.75
1.71
5
8,9203 1.60
8,717 4
1.49
1.38
1.30
7,039 1.24
6,682 1.16
6,337 2
1.06
0.95
4,342
4,034 4,199
3,8311
2,945
FY11/12 FY12/13 FY13/14 FY14/15 FY15/16 FY16/17 FY17/18 FY18/19 FY19/20 1HFY20/21
1H FY11/12 FY12/13 FY13/14 FY14/15 FY15/16 FY16/17 FY17/18 FY18/19 FY19/201H FY20/21
FY20/21
1. Reflects acquisition of Mapletree Anson, completed on 4 February 2013
2. Reflects acquisition of MBC I, completed on 25 August 2016
3. Reflects acquisition of MBC II, completed on 1 November 2019
4. Portfolio revalued to S$8.7 bil mainly due to COVID-19 impact, but capitalisation rates remained unchanged
5. NAV per Unit eased to S$1.71 mainly due to revised valuation of investment properties
17Daily Closing price as a % of Closing Price on 27 April 2011
0.00%
50.00%
100.00%
150.00%
200.00%
250.00%
300.00%
350.00%
Apr-11
Jul-11
Oct-11
Jan-12
S$0.88
at IPO:
Apr-12
Unit Price
Jul-12
Oct-12
Jan-13
Apr-13
Jul-13
Oct-13
Jan-14
Apr-14
Jul-14
MCT
Oct-14
Jan-15
MCT Unit Price Performance
Apr-15
STI
Jul-15
Oct-15
Jan-16
Apr-16
FSTREI
Jul-16
Oct-16
Jan-17
Apr-17
FSTRE Jul-17
Oct-17
Jan-18
Apr-18
Jul-18
Oct-18
Jan-19
Apr-19
Jul-19
Oct-19
(Relative Price Performance from MCT’s Listing on 27 April 2011 to 13 November 2020)
Jan-20
Apr-20
Jul-20
Oct-20
STI -14.8%
S$2.00
STI RE +6.1%
MCT +127.3%
13 Nov 2020:
Unit Price on
18
STI REIT +23.0%Benchmarking Investment Yields
4.00% 3.77%4
3.50%
3.00%
2.50% 3
2.50%
2.00%
1.50%
1.00% 0.81% 2
0.50% 0.28%1
0.00%
Singapore Dollar 12-Months Singapore 10-year Bond Yield Singapore CPF Interest Rate Mapletree Commercial Trust
Deposit Rate (Ordinary Account)
Premium to 12-month Singapore Dollar Deposit Rate ~3.5%
Premium to Singapore 10-Year Bond Yield ~3.0%
Premium to Singapore CPF Interest Rate (Ordinary Account) ~1.3%
1. Source: MAS website, Bank fixed deposit rate (12 months) as at 31 October 2020
2. Source: MAS website, Average buying rates of government securities dealers (10-year bond yield) as at 31 October 2020
3. Source: CPF website, based on CPF interest rate for Ordinary Account (effective for the period 1 October 2020 to 31 December 2020)
4. Based on actual DPU (on a rolling basis for the period 1 October 2019 to 30 September 2020) and the Unit Price of S$2.00 at close of trading on 13 November 2020
19Disciplined Capital
Management Builds
Robust Balance Sheet
Mapletree Business City I 20Disciplined Capital Management Builds Robust Balance Sheet
S$ mil 31 Mar 12 31 Mar 13 31 Mar 14 31 Mar 15 31 Mar 16 31 Mar 17 31 Mar 18 31 Mar 19 31 Mar 20 30 Sep 20
Gross Debt 1,129 1,591 1,591 1,551 1,551 2,328 2,328 2,349 3,003 2,999
Cash 50 47 70 55 64 54 45 49 66 132
Net Debt 1,079 1,554 1,521 1,496 1,487 2,274 2,283 2,300 2,937 2,867
Aggregate
37.6% 40.9% 38.7% 36.4% 35.1% 36.3% 34.5% 33.1% 33.3% 33.8%
Leverage1
Average Debt
2.4 3.3 2.5 3.6 3.4 4.0 3.9 3.6 4.2 4.5
Maturity (years)
% Fixed Debt 85.0% 70.4% 64.3% 68.2% 73.8% 81.2% 78.9% 85.0% 78.9% 71.5%
All-in Average
Annualised
1.96% 2.18% 2.17% 2.28% 2.52% 2.66% 2.75% 2.97% 2.94% 2.57%
Interest Cost
(p.a.)
Interest
Coverage Ratio 5.4X 5.4x 5.0x 5.3x 5.0x 4.9x 4.8x 4.5x 4.3x 4.0x2
(YTD)
1. Aggregate leverage is defined as total gross borrowings divided by total deposited property.
2. The interest coverage ratio is based on a trailing 12-months basis
21Long-Term Focus on
Resilience & Stability
Bank of America Merrill Lynch HarbourFront
22Long-Term Focus on Resilience And Stability
2015
2014 June
2013 • Completed VivoCity’s 1st
2012 February
November
• Moody’s upgraded AEI to create 15,000 sq ft
2011 August • Raised S$225.0 mil MCT’s Issuer Rating of retail space on
through private to Baa1 (stable) Basement 1
• Set up S$1.0 bil
April multicurrency MTN equity placement • Issued aggregate
• Listed on Main Board of programme • Completed S$250.0 mil MTNs
SGX-ST on 27 April 2011 • Issued Maiden Mapletree Anson (between Nov 2014
S$160.0 mil 3.6% MTN acquisition to Mar 2015) due
November due 2020 Nov 2019, Feb 2023
• PSA Building and Mar 2023 to
enhancements were December refinance existing
completed. • Proposed acquisition of debt, and prepay
• Added 15,000 sq ft of office Mapletree Anson debt
space and 89,600 sq ft of
retail space to MCT’s
portfolio
December
• ARC was opened to public
on 15 December 2011
23Long-Term Focus on Resilience And Stability (cont’d)
2020
2016 2017 2018 2019
March-September
July July March January • Provided rental assistance to
• Proposed acquisition of MBC I • Completed 3rd AEI • Issued S$120.0 mil, • Completed VivoCity’s 4th AEI offset on average more than 4
at VivoCity to 3.28% Fixed Rate to create 24,000 sq ft of retail months of fixed rent for eligible
August convert 9,200 sq ft of Notes Due 2024 space on Basement 1 and a tenants
• Raised S$1.04 bil through equity Level 1 anchor (rated Baa1) for public library on Level 3
fund raising space into specialty refinancing September
• Completed MBC I acquisition space May-September • Successful reconfiguration of
• Moody’s affirmed MCT’s Baa1 June • 24,000 sq ft of recovered mini-anchor space on Level 2
rating on MBC I acquisition August • Increased MTN anchor space progressively
• Issued S$175.0 mil, 3.11% Fixed • Issued S$100.0 mil, Programme limit opened with new specialty Work-in-progress
Rate Notes Due 2026 (rated 3.045% Fixed Rate from S$1.0 bil to stores. FairPrice Xtra • Reconfiguration of Level 1
Baa1) Notes Due 2027 S$3.0 bil officially launched its largest promenade-facing F&B cluster to
(rated Baa1) for outlet in Singapore on 6 improve layout and offerings.
September refinancing August 2019. Completed
• Completed VivoCity’s 2nd AEI to VivoCity’s 5th AEI with
improve layout and widen F&B October widened retail and F&B
offerings at Basement 1 and • Announced 4th AEI offerings at Basement 2 and
Level 3 to add Public Library Level 1 in September 2019
and extend
November Basement 1 in
• Issued S$85.0 mil, 2.795%, VivoCity
Fixed Rate Notes Due 2023
(rated Baa1) for refinancing
24Overcoming the COVID-19 Headwinds
Overcoming the
COVID-19 Headwinds
Exercising extra prudence while keeping focus on the long term
• Added boost of resilience from newly-acquired MBC II
Enlarged exposure to burgeoning technology sector from 5.1% to 19.3% 1
Diversification of income streams
Long-term
resilience • Well-diversified portfolio expected to continue to derive stable cashflows from
high quality tenants
Top tenants contribute ~28.2%1 of gross rental income
Best-in-class assets will continue to appeal well to high quality and reputable MNC tenants
• Managing costs proactively and responsibly
Re-prioritising capital expenditures and enhancement works
Proactive asset
Enhancing operational efficiencies
management
• Committed to the long-term health of the retail eco-system by rolling out one of the
most comprehensive tenant support packages
• Prioritising financial flexibility and liquidity
Enhanced S$43.7 million of distribution retained by way of capital allowance claims and capital distribution in
financial 4Q FY19/20 as additional reserve for rainy days
flexibility Secured new facilities to refinance all borrowings due in FY21/22
More than S$600 million of cash and undrawn committed facilities in place as at 30 September
2020
1. As at 30 September 2020
26Assisting Our Tenants to Weather the COVID-19 Headwinds
Rendered timely and meaningful rental assistance
To help eligible retail tenants offset on average more than 4 months 1 of their fixed rents
Average quantum of rental rebate/waiver
Period
for eligible tenants
March 2020 ~0.5 month
1Q FY20/21 ~2.8 months
July 2020 ~0.5 month
August 2020 ~0.2 month2
September 2020 ~0.2 month2
February March April May June July
7 February 2020 23 March 2020 7 April – 1 June 2020 2 June 2020 From 19 June 2020
Government raised No entry or transit Circuit breaker period Easing of circuit breaker Further easing of circuit breaker
DORSCON level through Singapore • All non-essential industries and retail Phase One: Phase Two: Safe Transition –
from yellow to for all short-term shall be closed Safe Re-opening – most businesses allowed to resume
orange visitors • The public is required to stay at home majority of business operations
unless for essential services continued to be closed Measures such as border closures
and work-from-home directives
remain
1. Refers to assistance for eligible retail tenants granted and/or announced to date, and includes the passing on of property tax rebates, cash grants from the
government and other mandated grants to qualifying tenants
2. The assistance for each tenant is calibrated based on their respective actual sales performance and subject to tenant’s acceptance
27VivoCity – Progressive Recovery in Shopper Traffic and Tenant Sales
Rebound in tenant sales has outpaced shopper traffic
But COVID-19 protocols continue to be in place and pose disruptions
Monthly Shopper Traffic and Tenant Sales
(rebased against 2019)
100%
Heightened
90% safe distancing
measures
80% Closure of
International
borders Phase Two of re-opening.
70%
Measures such as border
closures and work-from-
60% home directives remain
50% Start of
circuit breaker
40%
30%
20%
10%
0%
Mar 2020 Apr 2020 May 2020 Jun 2020 Jul 2020 Aug 2020 Sep 2020
Shopper Traffic Tenant Sales
28Completed Acquisition of MBC II
Alexandra PrecinctMapletree Business City (Phase 2) and the
Common Premises
Premium campus-style environment with
Grade A building specifications
Closest business park to the CBD
Attractive to modern and high quality
tenants
Stable cashflows with embedded rental
growth
Prime beneficiary of the Greater Southern
Waterfront Development
Completes MCT’s control over the entire
Alexandra Precinct
30Added Another Best-In-Class Asset
to MCT’s Portfolio
Property Overview
Mapletree Business City (Phase 2) located at
40, 50, 60, 70 and 80 Pasir Panjang Road, including the Year of 2016
common property (carpark, landscape areas, driveways Completion (Common Premises were completed in 2010)
and walkways)
The Property
Common Premises comprising the common carpark, multi-
purpose hall, retail area and common property (including Agreed Property
the landscape areas, driveways and walkways) located at S$1,550 million
Value
10, 20, 30 Pasir Panjang Road
Savills: S$1,552 million CBRE: S$1,560 million
Business Park: Business Park:
Valuation
S$1,520 million S$1,530 million
Retail: S$32 million Retail: S$30 million
99 years leasehold commencing
Land Tenure
1 October 1997
1,184,704 sq ft
Net Lettable Area
Business Park: 1,167,106 sq ft
(“NLA”)
Retail: 17,598 sq ft
Average Passing
S$6.15 psf per month1
Rent
Committed
99.4%1
Occupancy
Weighted
Average Lease 2.9 years2
Expiry (“WALE”)
Land Area of Mapletree Business Licensed Premises 1. As at 31 August 2019
Mapletree Business City City (Phase 2) to MCT 2. By Gross Rental Income as at 31 August 2019
31Added Strength and Diversification to
MCT’s Earnings Profile
Financially accretive acquisition received strong support from investors
Enhanced index representation and inclusion into the widely benchmarked
MSCI Singapore Index1 further boosted trading liquidity
NPI Yield NAV per Unit
(%) 1.8 (S$)
1.75 5
1.75
5.13
1.714
4.7 2 1.7
1.65
1.6
1.55
3 1.5
Existing Properties MBC II Existing Properties Enlarged Portfolio
1. MCT was added into the MSCI Singapore Index on 26 November 2019
2. Based on NPI for the financial year ended 31 March 2019 over the value of the existing properties as at 31 August 2019
3. Based on the annualised NPI (for financial year ended 31 March 2020) without taking into account the effect of amortisation of rental income for fit-out periods
and the agreed property value of S$1,550.0 million
4. Based on the NAV as at 31 March 2019 and adjusted for the change in valuation of the existing properties from 31 March 2019 to 31 August 2019
5. As at 31 March 2020
32Key Benefits Achieved from MBC II Acquisition
1 Adds another Best-in-Class Asset to MCT’s portfolio
2 Beneficiary of Decentralisation and Flight to Quality
3 Further Stabilises and Enhances MCT’s Income Streams
4 Financially Accretive
5 Increases Free Float and Liquidity, and Enhances Index Representation
33Active Asset Management to
Create Value
VivoCityVivoCity – Tenant Sales
VivoCity Annual Tenant Sales (S$ million)
1200.0
Largely due to
COVID-19 impact
in 4Q FY19/20
1000.0 951.8 958.2
939.2 939.1
905.9 908.9 907.1
858.1
827.5
800.0 761.1
677.4
Impacted by ten
weeks of
600.0 mandatory COVID-
19 business
closures and
continued
restrictions
400.0
259.9
200.0
0.0
FY09/10 FY10/11 FY11/12 FY12/13 FY13/14 FY14/15 FY15/16 FY16/17 FY17/18 FY18/19 FY19/20 1H FY20/21
35VivoCity – Shopper Traffic
VivoCity Annual Shopper Traffic (million)
Largely due to
COVID-19 impact
in 4Q FY19/20
60.0
55.8 55.0 55.2
53.2 53.9 53.2 53.2
51.6 51.5
50.0
44.7
40.1
40.0
Impacted by ten
30.0 weeks of
mandatory COVID-
19 business
closures and
continued
20.0 restrictions
9.6
10.0
0.0
FY09/10 FY10/11 FY11/12 FY12/13 FY13/14 FY14/15 FY15/16 FY16/17 FY17/18 FY18/19 FY19/20 1H FY20/21
36Continued Enhancements at VivoCity
5th AEI:
• Completed changeover of 91,000 sq
3rd AEI: ft of hypermarket space
1st AEI: • Converted 9,200 sq • Converted 24,000 sq ft of anchor
• Created 15,000 sq ft ft of lower to higher- space to accommodate
of higher-yielding yielding spaces on new/expanding tenants
retail space on B1 L1 & L2 • Delivered positive rental uplift and
VivoCity’s Opening of • Yielded ~25% ROI on • Yielded ~29% ROI ~40% ROI based on S$2.2 mil of
Official Opening Resorts World Sentosa S$5.5 mil of capex1 on S$3.0 mil capex1 capex1
2006 2007 2010 2011 2015 2016 2017 2018 2019 2020
Opening of Sentosa 2nd AEI: 4th AEI: Space Reconfiguration:
Express monorail on L3 • Rejuvenated B2, • Added a 32,000 sq ft • Reconfigured mini-
Opening of Circle Line at
increased F&B library on L3 anchor space to
HarbourFront Station
kiosks from 13 to • Added 24,000 sq ft of accommodate online-to-
21 and NLA to extend B1 offline fashion retailer on
• Added popular • Added new escalator L2 and achieved >30%
steamboat connecting B1, B2 ROI on S$1.3 mil capex1
restaurant on L3 and L1 + other M&E • Work in progress on
• Yielded ~20% ROI works Level 1 F&B cluster,
on S$5.7 mil of • Yielded over 10% ROI expected to deliver
capex1 on S$16.0 mil capex1 ~30% ROI on S$700k
capex1
1. Return on Investment (“ROI”) on capital expenditure (“capex”) on a stabilised basis
37VivoCity – Reconfigured Mini-Anchor Space on Level 2
Recovered prime frontage to accommodate home-grown online-to-offline fashion retailer
Achieved more than 30% ROI on a stabilised basis1
Before After
Best Denki reconfigured layout and doubled
shopfront width Lobby L Before Lobby L
Love, Bonito, took up 4,300 square feet of Love,
Best Denki Bonito
recovered prime space
Best Denki
Centre (new layout)
Reconfiguration delivered financial benefits and Management
Office
added an exciting concept to VivoCity
Doubled
shopfront width
Prime space conversion facing Lobby L from
Best Denki to Love, Bonito Doubled shopfront width for Best Denki
1. Based on estimated capital expenditure of approximately S$1.3 million
38VivoCity – Work in Progress to Further Drive Performance
Revitalising Level 1 promenade-facing F&B cluster to improve layout and offerings
Entire exercise to deliver ~30% ROI on stabilised basis1
Reconfiguration of cluster to optimise space efficiency
New cluster will house four new F&B tenants:
Afuri Ramen (opened on 30 September 2020)
Green Common, Hoshino Coffee and Shake Shack
Revitalised F&B cluster expected to deliver financial benefits
and further enhance VivoCity’s appeal as destination mall
Target to complete by 3Q FY20/21
Before After
Artisan
Boulangerie
Co
Starbucks
Jamie’s
Italian
Afuri Ramen – Well-known Japanese ramen shop
featuring their signature yuzu-based broth
1. Based on estimated capital expenditure of approximately S$700,000
39VivoCity – Refreshing Tenant Mix
New and popular concepts added in 1H FY20/21
Beyond Coffee – Trendy café offering quality Butter Bean – Nanyang coffee-based beverages Fragrance – Well-loved for its
and innovative coffee-based beverages and baked goods with a modern twist signature barbecued meat
Ben & Jerry’s – Ice cream parlour with fun Well Bred – New wave clothing line with a Everbest – Home-grown shoe brand known
original flavours strong cult following for their comfortable designs
Note: The above only represents a portion of tenants that were introduced in 1H FY20/21
40Singapore’s Largest Multi-Dimensional Retail
and Lifestyle Destination
A multiple-award winning destination mall
Expat Living Reader’s Choice 2020 – Singapore Retail Association 2016 – Best Retail Event
Best Shopping Centre – Silver of the Year for “Star Wars: The Force Awakens” event –
Finalist
BCA Green Mark Certification – Platinum
AsiaOne’s People’s Choice Awards 2016 –
Marketing-Interactive PR Awards 2019 – Best Shopping Centre – Finalist
Best Event-Led PR Campaign for “Disney Tsum Tsum
Mid-Autumn Celebration of Love” event – Silver BCA Green Mark Certification 2016 – Gold
Expat Living Reader’s Choice 2019 – Her World x Nuyou Mall Awards 2016 – Best Mall
Best Shopping Centre – 2nd Place (South)/ Best Dining Mall (South)/ Best Lifestyle Mall
Trip Advisor 2017 – Certificate of Excellence Singapore Mother & Baby Award 2015 – Most Family-
Friendly Shopping Mall
41Resilient Office/Business Park Properties
Active management to create value
Proactive retention and early engagement of quality tenants to secure renewals with strong
emphasis on preserving cashflows
Active management to retain attractiveness of buildings
Completed upgrading of common areas and toilets at office floors
Upgrades at PSA Building:
Before: Lift Lobby After: Lift Lobby
Newly-installed
Before: Toilets After: Toilets Self Registration Kiosks
421H FY20/21
Results Highlights
VivoCityKey Highlights
Financial Performance
1H FY20/21 gross revenue and net property income (“NPI”) down 2.5% and 2.6%
respectively mainly due to COVID-19 rental rebates but offset by contribution from
Mapletree Business City (“MBC”) II
1H FY20/21 Distribution per Unit (“DPU”) totalled 4.17 Singapore cents
Valuation of investment properties revised to S$8.7 billion due to COVID-19 impact
Portfolio Performance
VivoCity’s 1H FY20/21 shopper traffic and tenant sales impacted by ten weeks of
mandatory business closures and prolonged COVID-19 restrictions
Progressive recovery at VivoCity since Phase Two of Singapore’s re-opening whereby
rebound in tenant sales has outpaced shopper traffic
Portfolio achieved 97.7% committed occupancy
MBC continues to be an anchor of stability
44Key Highlights
Value Creation at VivoCity
Completed reconfiguration of mini-anchor space on Level 2 and recovered prime
space to accommodate home-grown online-to-offline fashion retailer
Work in progress to revitalise Level 1 promenade-facing F&B cluster, targeting to
complete by 3Q FY20/21
Capital Management
Proactive and prudent capital management that continues to focus on financial
flexibility and liquidity
Facilities in place to complete all refinancing due up till FY21/22
Well-distributed debt maturity profile with no more than 21% of debt due for
refinancing in any financial year
451H FY20/21 Financial Scorecard
COVID-19 impact cushioned by MBC II and higher contribution from Mapletree Anson
Gross Revenue Property Expenses Net Property Income
2.5% 1.8% 2.6%
224.2
218.7
10.0 9.9
176.11
14.7 171.5
17.0 8.0 8.0
25.4 11.4
21.2 13.7
19.3 15.6
52.0 48.11 47.2
42.1 48.0
65.2 2.0 1.9 33.8
44.0 3.3 3.3 54.0
40.0 6.1 5.6
36.0
(S$ mil) 63.7 (S$ mil)
32.0 8.4 (S$ mil)
11.1
28.0 53.0
24.0 10.6
108. 20.0
9 16.0 83.3
64.8 12.0 25.5
8.0 17.4 47.4
4.0
0.0
1H FY19/20 1H FY20/21 1H FY19/20 1H FY20/21 1H FY19/20 1H FY20/21
VivoCity MBC I MBC II PSA Building Mapletree Anson MLHF
1. Total does not add up due to rounding differences
46Balance Sheet
NAV per Unit eased to S$1.71 mainly due to revised valuation of investment properties
As at As at
S$’000 unless otherwise stated
30 September 2020 31 March 2020
Investment Properties 8,717,000 8,920,000
Other Assets 163,789 87,073
Total Assets 8,880,789 9,007,073
Net Borrowings 3,001,699 3,008,020
Other Liabilities 214,719 212,105
Net Assets 5,664,371 5,786,948
Units in Issue (’000) 3,313,936 3,307,510
Net Asset Value per Unit (S$) 1.71 1.75
47Key Financial Indicators
Maintained robust balance sheet
Every 25 bps change in Swap Offer Rate estimated to impact DPU by 0.06 cents p.a
As at As at As at
30 September 2020 30 June 2020 30 September 2019
Total Debt Outstanding S$2,998.9 mil S$3,068.2 mil S$2,349.0 mil
Gearing Ratio 33.8%1 33.7% 31.7%
Interest Coverage Ratio
4.0 times 4.1 times 4.5 times
(12-month trailing basis)
% Fixed Rate Debt 71.5% 73.5% 82.6%
Weighted Average All-In Cost
2.57%3 2.61%4 3.00%5
of Debt (p.a.)2
Average Term to Maturity of
4.5 years 3.9 years 3.1 years
Debt
Unencumbered Assets as %
100% 100% 100%
of Total Assets
MCT Corporate Rating
Baa1 (negative) Baa1 (negative) Baa1 (stable)
(by Moody’s)
1. Based on total gross borrowings divided by total assets. Correspondingly, the ratio of total gross borrowings to total net assets is 52.9%
2. Including amortised transaction costs
3. Annualised based on 1H ended 30 September 2020
4. Annualised based on the quarter ended 30 June 2020
5. Annualised based on 1H ended 30 September 2019
48Debt Maturity Profile (as at 30 September 2020)
Financial flexibility from more than S$600 mil of cash and undrawn committed facilities
Well-distributed debt maturity profile with no more than 21% of debt due in any financial year
Total gross debt: S$2,998.9 mil
Redeemed S$160.0 mil of Fixed Rate Notes in August 2020 and refinanced S$369.3 mil of term loans ahead
of expiry
Subsequent to the reporting period, S$98.0 mil* of bank debt was refinanced, thus completing refinancing of
all bank debts due up till FY21/22
625.0 625.0
Bank Debt
Medium Term Note (“MTN”)
Gross Debt (S$ mil)
180.0
464.0 Refinanced Debt/MTN
280.0
New Bank Debt/MTN
450.0
325.0 505.0
264.0
369.3 325.0 170.0
240.0 441.9
160.0
250.0
200.0 175.0
98.0* 85.0 120.0 100.0
70.0
FY20/21 FY21/22 FY22/23 FY23/24 FY24/25 FY25/26 FY26/27 FY27/28 FY28/29 FY29/30
% of
3% 2% 16% 11% 21% 15% 21% 3% - 8%
Total Debt
49Portfolio Occupancy
Achieved healthy portfolio committed occupancy of 97.7%
MBC continues to provide stability
September 2020
September 2019 June 2020
Actual Committed1
VivoCity 99.8% 98.3% 96.0% 97.9%
MBC I 98.9% 96.4% 97.9% 98.2%
MBC II - 99.4% 100% 100%
PSA Building 91.3% 88.7% 69.7%2 87.9%
Mapletree Anson 75.1% 100% 100% 100%
MLHF 100% 100% 100% 100%
MCT Portfolio 96.1% 97.1% 95.3% 97.7%
1. As at 30 September 2020
2. Mainly due to the expiry of a major tenant’s short-term lease at PSA Building on 31 August 2020
50Lease Expiry Profile (as at 30 September 2020)
Portfolio resilience supported by manageable lease expiries
WALE Committed Basis
Portfolio 2.5 years1
Retail 2.1 Years
Office/Business Park 2.8 years
As % of Gross Rental Revenue
19.5%
13.0% 13.2% 12.9%
9.8%
8.0% 7.4%
5.8% 6.4%
4.1%
FY20/21 FY21/22 FY22/23 FY24/25 FY24/25…
FY24/25
& Beyond
Retail Office/Business Park
1. Portfolio WALE was 2.1 years based on the date of commencement of leases
Note: The above percentages do not add up to 100% due to rounding
51FY20/21 Leasing Update
Portfolio rental reversion impacted by uncertain COVID-19 outlook
Number of Leases Retention Rate % Change in
1
Committed (by NLA) Fixed Rents
Retail 71 79.1% -8.9%2
Office/Business Park 20 77.5% -1.6%3
MCT Portfolio 91 77.7% -3.7%3
1. Based on the average of the fixed rents over the lease period of the new leases divided by the preceding fixed rents of the expiring leases. Rent reviews are
typically not included in the calculation of rental reversions
2. Includes the effect from trade mix changes and units subdivided and/or amalgamated
3. Mainly due to the expiry of a major tenant’s short-term lease at PSA Building on 31 August 2020. Excluding the effect of this lease, the rental reversion for
MCT Portfolio and Office/Business Park would be -0.9% and 2.9% respectively
52VivoCity – Shopper Traffic and Tenant Sales
1Q FY20/21 impacted by ten weeks of mandatory business closures 1
Progressive recovery in 2Q FY20/21 since Phase Two of re-opening from 19 June 2020
Shopper Traffic (mil) Tenant Sales (S$ mil)2
64.6% 41.5%
500
450
444.3
28 27.1
400
23 350
235.0
14.0 300
18 259.93
250
13 200
9.6 183.3
150
8
13.1 6.8 100 209.3
3 50 76.5
2.8
0
-2 1H FY19/20 1H FY20/21 1H FY19/20 1H FY20/21
1Q 2Q
1. Refers to circuit breaker from 7 April to 1 June 2020 and Phase One easing of circuit breaker from 2 to 18 June 2020 during which the majority of
businesses were closed
2. Includes estimates of tenant sales for a small portion of tenants
3. Total does not add up due to rounding differences
53Other Information
VivoCity 54Overall Top 10 Tenants (as at 30 September 2020)
Top tenants contributed 28.2%1 of gross rental income
Tenant % of Gross Rental Income
1 Google Asia Pacific Pte. Ltd. 10.5%
2 Merrill Lynch Global Services Pte. Ltd. 3.1%
3 (Undisclosed Tenant) -
4 The Hongkong and Shanghai Banking Corporation Limited 2.9%
5 Info-Communications Media Development Authority 2.3%
6 SAP Asia Pte. Ltd. 2.0%
7 Unilever Asia Private Limited 2.0%
8 NTUC Fairprice Co-operative Ltd 1.9%
9 Samsung Asia Pte. Ltd. 1.8%
10 Mapletree Investments Pte. Ltd. 1.7%
Total 28.2%1
1. Excluding the undisclosed tenant
55Portfolio Tenant Trade Mix (as at 30 September 2020)
Trade Mix % of Gross Rental Income
1 IT Services & Consultancy 19.3%
2 F&B 13.4%
3 Banking & Financial Services 11.3%
4 Fashion 7.5%
5 Government Related 6.3%
6 Fashion Related 4.1%
7 Hypermarket / Departmental Store 3.8%
8 Shipping Transport 3.7%
9 Consumer Goods 3.5%
10 Real Estate 3.4%
11 Beauty 3.0%
12 Electronics1 3.0%
13 Pharmaceutical 2.7%
14 Lifestyle 2.2%
15 Electronics2 2.1%
16 Sports 2.1%
17 Others3 8.8%
Total MCT Portfolio 100%4
1. Refers to tenants in office/business park
2. Refers to tenants in retail
3. Others includes Trading, Energy, Entertainment, Retail Bank, Optical, Insurance, Education, Consumer Services, Medical, Services and Convenience
4. Total does not add up to 100% due to rounding differences
56Sentosa
HarbourFront
HarbourFront
Towers 1 & 2
Centre
VivoCity
St James
Power Station
MLHF
57PSA
Building
MBC
58Maxwell
MRT Station
(Expected
Completion 2021)
Downtown MRT
Station
Shenton Way
MRT Station
(Expected
Completion 2021)
Tanjong Pagar
MRT Station
Mapletree Anson
Marina Bay
Station
Prince Edward
MRT Station
(Expected
Completion 2025)
59
Source: www.onemap.com.sg (as at Jul 2020)Pipeline of ROFR Properties
HarbourFront Precinct
1
HarbourFront Tower Two
NLA: 153,000 sq ft
6
2
1 2
3 4 5
HarbourFront Tower One
NLA: 368,000 sq ft
3
Investment Criteria for ROFR and Third-Party Acquisitions
Value Accretions
Yield Thresholds
Asset Quality (e.g. location, enhancement potentials, building
SPI Development Site1
specifications, tenant and occupancy profile)
GFA: 344,000 sq ft
Alexandra Precinct
4 5 6
HarbourFront Centre St James Power Station PSA Vista
NLA: 715,000 sq ft NLA: 119,000 sq ft NLA: 145,000 sq ft
Note: GFA and NLA are as published in Mapletree Investment Private Limited’s Annual Report 2019/2020 and rounded to the nearest thousand sq ft
1. Known as Proposed Mapletree Lighthouse in MCT’s IPO Prospectus 60Thank You
For enquiries, please contact:
Teng Li Yeng
Investor Relations
Tel: +65 6377 6836
Email: teng.liyeng@mapletree.com.sg
61You can also read