Frasers Commercial Trust - SGX-REITAS Education Series in Singapore 8 May 2019
←
→
Page content transcription
If your browser does not render page correctly, please read the page content below
Frasers Commercial Trust
SGX-REITAS Education Series in Singapore

8 May 2019
Important notice
Certain statements in this Presentation constitute “forward-looking statements”, including forward-looking financial information. Such forward-looking
statement and financial information involve known and unknown risks, uncertainties and other factors which may cause the actual results, performance
or achievements of Frasers Commercial Trust (“FCOT”) or the Manager, or industry results, to be materially different from any future results,
performance or achievements expressed or implied by such forward-looking statements and financial information. Such forward-looking statements and
financial information are based on numerous assumptions regarding the Manager’s present and future business strategies and the environment in
which FCOT or the Manager will operate in the future. Because these statements and financial information reflect the Manager’s current views
concerning future events, these statements and financial information necessarily involve risks, uncertainties and assumptions. Actual future
performance could differ materially from these forward-looking statements and financial information.
The Manager expressly disclaims any obligation or undertaking to release publicly any updates or revisions to any forward-looking statement or financial
information contained in this Presentation to reflect any change in the Manager’s expectations with regard thereto or any change in events, conditions
or circumstances on which any such statement or information is based, subject to compliance with all applicable laws and regulations and/or the rules of
the SGX-ST and/or any other regulatory or supervisory body or agency.
The value of Units in FCOT and the income derived from them, if any, may fall or rise. Units are not obligations of, deposits in, or guaranteed by, the
Manager or any of its affiliates. An investment in Units is subject to investment risks, including the possible loss of the principal amount invested.
Investors should note that they have no right to request the Manager to redeem their Units while the Units are listed. It is intended that Unitholders may
only deal in their Units through trading on the Singapore Exchange Securities Trading Limited (“SGX-ST”). Listing of the Units on the SGX-ST does not
guarantee a liquid market for the Units.
This document is for information only and does not constitute an invitation or offer to acquire, purchase or subscribe for the Units. The past performance
of FCOT and the Manager is not necessarily indicative of the future performance of FCOT and the Manager.
This Presentation contains certain information with respect to the trade sectors of the Trust’s tenants. The Manager has determined the trade sectors in
which the Trust’s tenants are primarily involved based on the Manager’s general understanding of the business activities conducted by such tenants.
The Manager’s knowledge of the business activities of the Trust’s tenants is necessarily limited and such tenants may conduct business activities that
are in addition to, or different from, those shown herein.
This Presentation includes market and industry data and forecast that have been obtained from internal survey, reports and studies, where appropriate,
as well as market research, publicly available information and industry publications. Industry publications, surveys and forecasts generally state that the
information they contain has been obtained from sources believed to be reliable, but there can be no assurance as to the accuracy or completeness of
such included information. While the Manager has taken reasonable steps to ensure that the information is extracted accurately and in its proper
context, the Manager has not independently verified any of the data from third party sources or ascertained the underlying economic assumptions relied
upon therein.
This advertisement has not been reviewed by the Monetary Authority of Singapore.

                                                                                                                                                          2
Contents

                                               Pg

 FCOT Overview                                 4

 Portfolio Review                              14

 Strengthening and Reshaping the Portfolio     20

 Appendix: Asset details and market overview   32

 Appendix: Sustainability                      43

                                                    3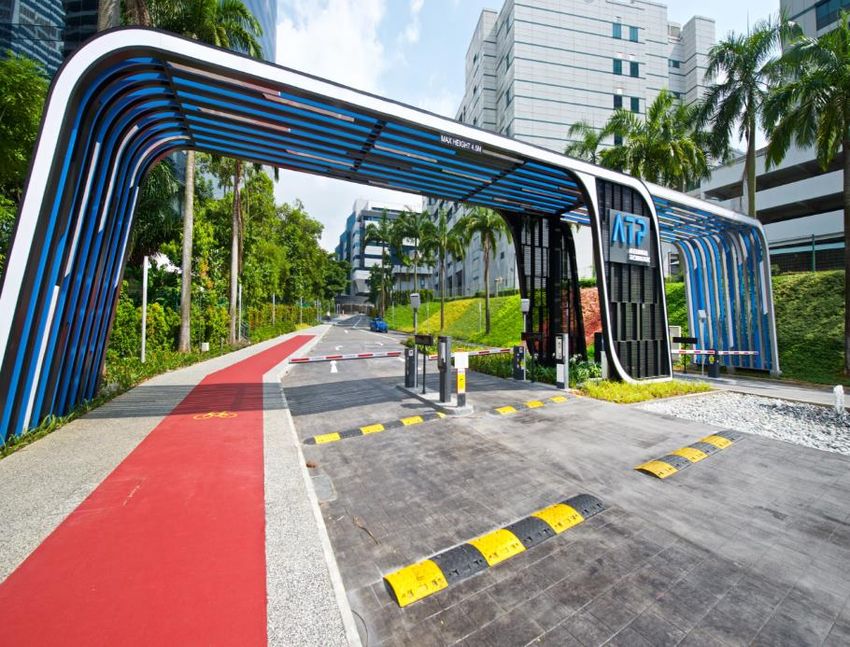
FCOT Overview

                357 Collins Street, Melbourne, Australia
Frasers Commercial Trust (“FCOT”) Overview
Commercial property REIT sponsored by Frasers Property Limited (“Frasers Property”)
Portfolio comprises primarily office/business space/business park properties in Singapore, Australia and
the UK
Expanded investment mandate to Europe and acquired 50% interest in Farnborough Business Park, UK,
in Jan 2018
Sponsor of 1
4 S-REITs
Listed on SGX- March 2006
Market capitalisation: S$5.4 billion (listed on SGX-ST)
ST: (Stock code: Frasers Com Tr)^
Total assets: S$33 billion
Market S$1.3 billion
Presence: Over 80 cities capitalisation:
Frasers Property 2QFY19 total assets by geography
Total assets: S$2.1 billion
Free float: 75% (25% held by Frasers Property and its
subsidiaries)
Others*,
19% Presence: 6 office and business space/park properties (total
3.4 mil sf) in Singapore, Australia and the UK
Singapore,
39%
Europe,
18%
Australia,
2 3 4
24%
(retail properties)
As at 31 March 2019.
Sources: Bloomberg, Frasers Property 2QFY19 Results Presentation.
* Includes China, Vietnam, Thailand, Malaysia, Japan, Philippines, Indonesia and New Zealand.
^ Formerly known as Allco REIT, the Trust was renamed to Frasers Commercial Trust after Frasers Property acquired a stake in the Trust in August 2008.
5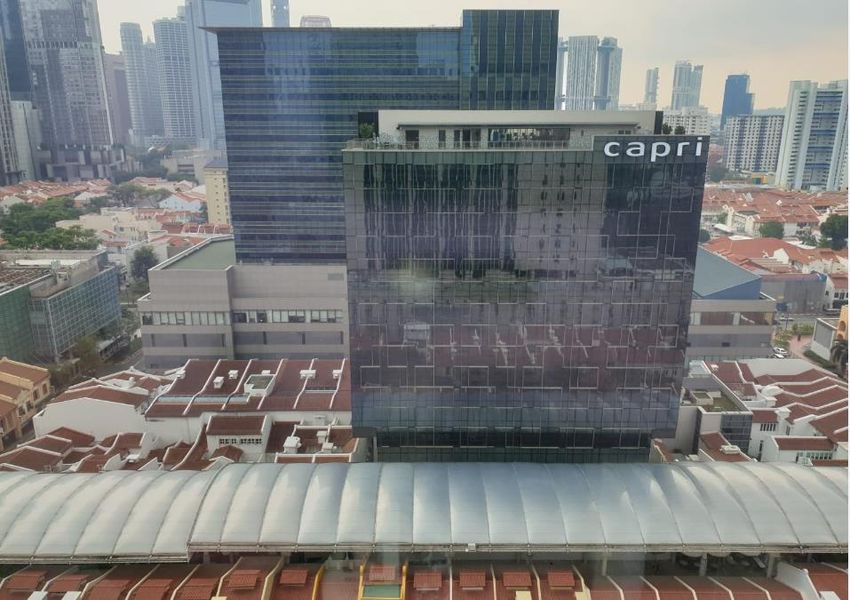
Portfolio Review Asset values
Diversified portfolio with no single property accounting for more than 28% of portfolio value
100% of portfolio has more than 75 years’ land tenures, including 34% with freehold tenures
Asset values Land tenure1
Farnborough Business
United Kingdom Park, UK*, 7%
357 Collins Street,
Singapore Melbourne, 14% Freehold,
China Square
Canberra Central, 28% 34%
Perth
Melbourne Caroline Chisholm
Centre, Canberra, 11% Leasehold
(all >75
Alexandra years), 66%
Central Park, Technopark, 26%
Perth*, 14%
Asset values as at 31 March 2019
Singapore $ 1,150.5 mil 54%
Australia $ 820.0 mil 39%
United Kingdom $ 155.0 mil 7%
Portfolio asset value $ 2,125.5 mil 100%
* In relation to FCOT’s 50% interests. In addition, Farnborough Business Park is held as a joint venture and equity-accounted in the financial statements.
1 Based on asset values as at 31 March 2019. 6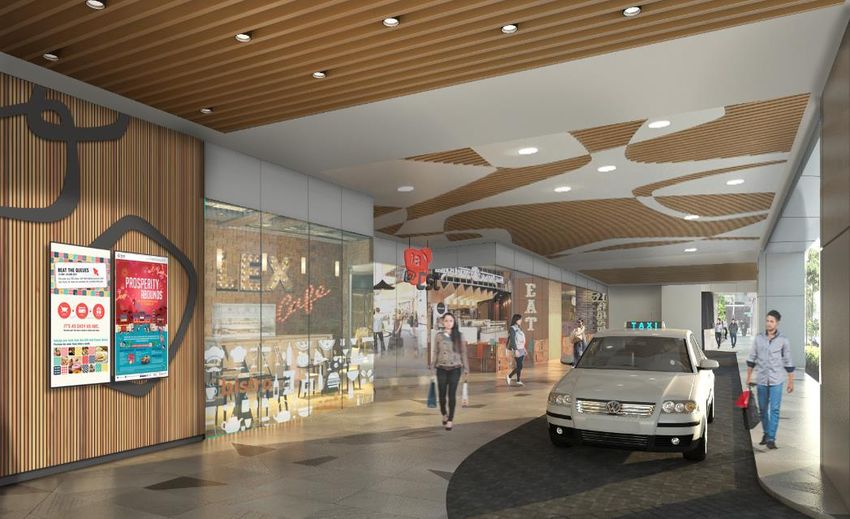
FCOT Overview Accolades
FCOT has won various awards for good corporate governance, investor relations practices and
sustainability reporting
Runner-up 2013, 2014 and
Inaugural Sustainability Report in ▪ Gold, Best Governed and ▪ Gold, Best Annual Report
2015 in the Singapore 2015 was a finalist for Asia’s Best Most Transparent Company 2017 in the Singapore
Corporate Governance Award First Time Sustainability Report Corporate Awards (REITS
(REITs and Business Trusts ▪ Gold, Best Corporate
at the Asia Sustainability and Business Trusts
Category) at the SIAS Investors Communications and Investor
Reporting Awards 2016 Category)
Choice Award1 Relations
1. There was no such category for REITs and Business Trust in 2016. 7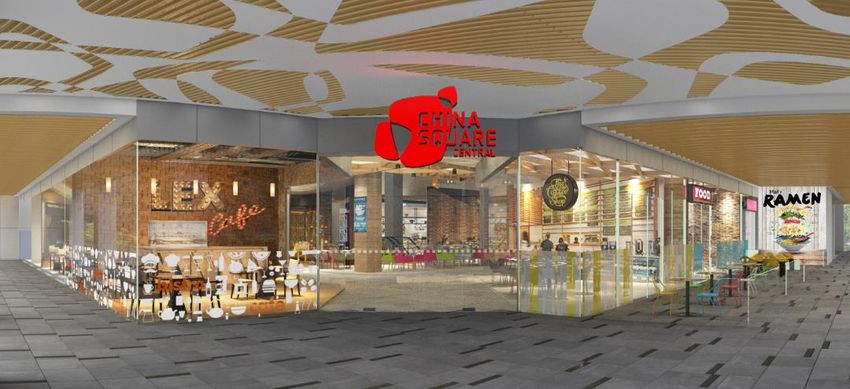
8
Record Annual Distribution Income in FY18
FCOT has been listed for 12 years since 30 March 2006 (initially as Allco Reit)
Became part of Frasers Property Group in Aug 2008
5-year total return of 63.3% exceeded the FTSE Straits Times Index’s total return of 22.1%1
Distribution income to
Unitholders (S$m)2
30 March 2006
77.6 78.6 82.7 No. of properties: 2
67.8
57.3
34.5 36.3 43.1 51.4 Portfolio value: S$0.7 billion4
17.1
FY09 FY10 FY11 FY12 FY13 FY14 FY15 FY16 FY17 FY18
DPU (Cents)2
30 September 2018
9.71 9.82 9.82 9.60 No. of properties: 6
7.83 8.51
5.60 5.75 6.69 Portfolio value: S$2.1 billion
2.80
FY09 3 FY10 3 FY11 3 FY12 FY13 FY14 FY15 FY16 FY17 FY18
1. 5-year up to September 2018. Assumes dividends are reinvested. Source: Bloomberg.
2. On 26 August 2009, Frasers Commercial Trust changed its financial year end from 31 December to 30 September. As a result, FY09 comprised a 9-month period from 1 January to 30 September 2009.
3. Adjusted for Unit consolidation.
4. As set out in the prospectus dated 23 March 2006. 8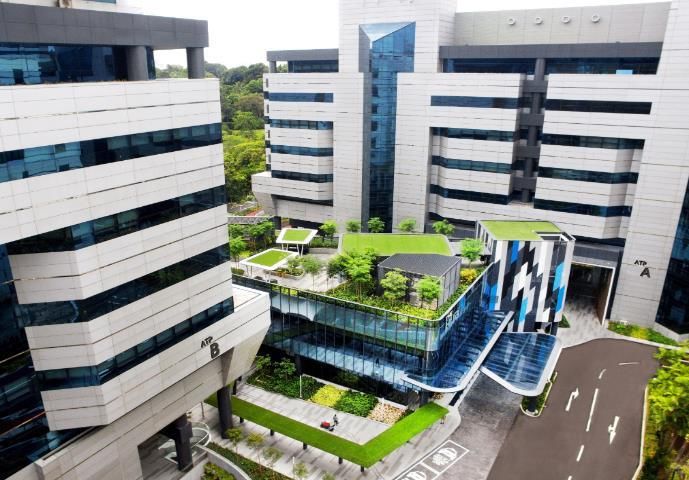
DPU profile
2QFY19 DPU was stable both Q-o-Q and Y-o-Y
DPU (Cents)1
2.40 2.40 2.40 2.40 2.40 2.40
1QFY18 2QFY18 3QFY18 4QFY18 1QFY19 2QFY19
FY18: 9.60 cents
1. 100% management fees were paid in Units in 2QFY19, 1QFY19 and all four quarters of FY18.
9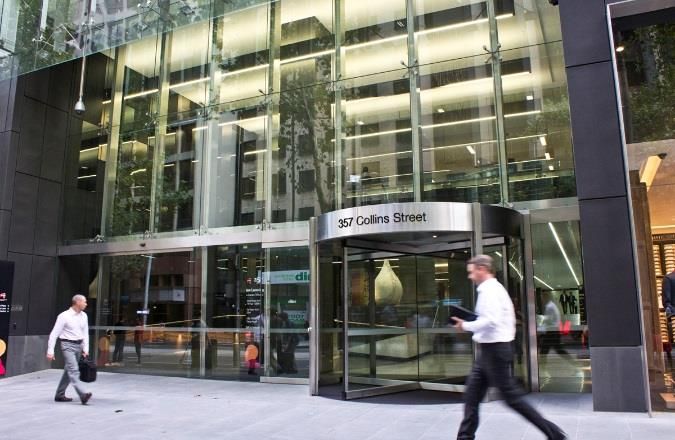
10
Attractive yield
FCOT offers an attractive yield and currently trades around 430 basis points above the 10-year
Singapore government bond
Yield (%)
6.5%
4.8% 4.6% 3.9%
2.5% 2.2% 0.6%
FCOT* Office SREITs^ FTSE REIT FTSE Straits CPF Ordinary 10-year Singapore Bank 12-months
Index^^ Times Index^^ Account # government fixed deposit rate~
bond~
Yield (%)
Preferential tax rates for investors Taxable dividends received**
Individuals Gross
Qualifying unitholders (Singapore incorporated and tax-resident companies) Gross, but income tax payable at own applicable tax rates
Foreign unitholders (non-individual) Net of 10.0% withholding tax
* Based on FCOT’s closing price of $1.48 per Unit as at 30 April 2019 and annualised FY19 DPU of 9.63 cents.
^ Based on closing prices as at 30 April 2019 and annualised DPU. Source: Bloomberg. Weighted average (based on market capitalisation) and comprised Frasers Commercial Trust, Keppel
REIT, CapitaLand Commercial Trust and Suntec REIT.
^^ As at 30 April 2019. Source: Bloomberg.
# Based on the interest rate paid on the Central Provident Fund (CPF) Ordinary Account from Jan 2019 to Mar 2019. Source: www.cpf.gov.sg.
~ As at April 2019. Source: www.mas.gov.sg.
** Subject to declaration of tax status, and advice by investors’ own tax advisors. 1011
Discount to NAV
Trading premium/discount to NAV per Unit (%)
Overall SREITs^
Office SREITs^ 8.9%
(3.9%) (2.7%)
Office SREITS^ Overall SREITS^^
FCOT*
Trading discount from NAV per Unit Trading premium from NAV per Unit
* Based on FCOT’s closing price of $1.48 per Unit as at 30 April 2019.
^ Based on closing prices as at 30 April 2019. Source: Bloomberg. Weighted average (based on market capitalisation) and comprised Frasers Commercial Trust, Keppel REIT, CapitaLand
Commercial Trust and Suntec REIT.
^^ Based on closing prices as at 30 April 2019. Source: Bloomberg. Weighted average figures (based on market capitalisation) for all Singapore REITs and real estate trusts. 11Capital structure and debt statistics
Prudent gearing of 29.1% affords financial flexibility for accretive investments and other growth
opportunities
Healthy interest coverage ratio of 4.7 times
Borrowings in local currencies provide natural hedges Borrowings and assets by currency
1,400
Statistics As at 31 Mar 2019
Total Assets (S$’000) 2,158,238 1,200 1,151
Gross Borrowings (S$’000)
S$ million
627,593
1,000
Units on Issue and Issuable entitled to distribution 902,911,651 820
NAV per Unit (ex-DPU) (S$) 1 1.54 800
Gearing 2 29.1%
600
Interest coverage ratio (times) 3 4.68
375
400
Average borrowing rate 4 2.98% p.a.
191
FCOT Issuer rating by Moody’s 5 Baa2 200 155 6
62
-
Singapore Australia United Kingdom
Properties Debt
1. Based on issued Units for the financial quarter ended 31 March 2019.
2. Gross borrowing as a percentage of total assets.
3. Net income before changes in fair values of investment properties, interest, other investments and derivative instruments, income tax and distribution, and adding back certain non-recurring
items/cash finance costs for the quarter ended 31 March 2019.
4. For quarter ended 31 March 2019.
5. Moody’s affirmed FCOT’s Baa2 ratings (with a negative outlook) in its credit opinion report dated 28 February 2019.
6. S$60.0 million five-year senior unsecured notes issued in February 2018 was swapped into Sterling Pound. 12Prudent capital management
Well-spread debt maturity profile
No major refinancing need until FY20
All debts are unsecured
87.4% of gross borrowings on fixed rates
Debt maturity Debt composition – floating vs. fixed interest rates
Total borrowings: S$628 million
Weighted average term to maturity: 2.6 years Floating,
12.6%
250
200
S$ million
150 130
61
100
1
150 60
50 100 80
2 45
0
FY19 FY20 FY21 FY22 FY23+ Fixed, 87.4%
SGD bank borrowings SGD MTN
AUD bank borrowings GBP bank borrowings
1. S$60.0 million senior unsecured notes issued in February 2018 and swapped into Sterling Pound.
2. Data (including exchange rates) as at 31 March 2019. 13Portfolio Review
Alexandra
Central
Technopark,
Park, Perth,
Singapore
Australia
Artist’s impression of entrance to Alexandra Technopark, SingaporePortfolio Review Occupancy & WALE
Average committed occupancy rate rises to 81.5%1
Committed WALE of 4.7 years1,2
Key portfolio statistics Actual Committed
Geographical occupancy1 and NPI2 contribution
as at 31 March 2019 occupancy occupancy1
98.0%
100% 94.0%
Ave Occupancy 78.8% 81.5%
Portfolio WALE by gross 80% 4
4.3 years 4.7 years 67.5%
rental income2
60%
Portfolio WALB by gross 49.6%
4.1 years 4.4 years
rental income2,3 39.0%
40%
20% 11.4%
0%
Ave committed occupancy as at 31 % NPI contribution for 2QFY19
Mar 2019
Singapore Australia UK
1. The total NLA of the portfolio used in the computation of occupancy rate has excluded 18 Cross Street retail podium (NLA c. 64,000 sf) which is currently closed for asset enhancement works.
2. Excludes lease incentives and retail turnover rents, if any. For Farnborough Business Park, reimbursements of rent free incentives and rent guarantee for certain unlet units, among others, by
the vendor in accordance with the terms of the acquisition (refer to announcement dated 14 December 2017 for details) are included.
3. WALB - weighted average lease to break, reflecting contractual rights for tenants to pre-terminate leases in certain cases.
4. Mainly affected by exits of Hewlett-Packard Enterprise Singapore Pte Ltd and Hewlett-Packard Singapore Pte Ltd from Alexandra Technopark (refer to the announcements dated 22 September
2017 and 3 November 2017 for further details). 15Portfolio Review Lease expiry profile
Well-spread lease expiry profile provides income stability and defensiveness
Portfolio lease
expiry by gross Lease expiries in FY19 and FY20 reduced
rental income with committed leases secured
50%
40%
30%
52.5%
20% 16.6%
10.0% 3.2%
10%
7.6% 13.4% 12.9%
8.0%
0% 2.4%
FY19 FY20 FY21 FY22 FY23 and beyond
Portfolio lease expiry by gross rental income1
Number of leases expiring 36 43 45 29 91
NLA (sq ft) expiring 174,750 350,113 265,061 169,029 1,207,173
Expiries as % total NLA 6.2% 12.5% 9.4% 6.0% 42.9%
Expiries as % total Gross
10.0% 16.6% 12.9% 8.0% 52.5%
Rental Income
Data as at 31 March 2019. Exclude lease incentives and retail turnover rents, if any. For Farnborough Business Park, reimbursements of rent free incentives and rent guarantee for certain unlet units, among
others, by the vendor in accordance with the terms of the acquisition (refer to announcement dated 14 December 2017 for details) are included.
1. The total NLA of the portfolio used in the computation has excluded 18 Cross Street retail podium (NLA c. 64,000 sf) which is currently closed for asset enhancement works. 16Portfolio Review Lease expiry profile for FY19
Proactive management of leases with forward commitments
Lease expiries at China Square Central, Alexandra
Technopark and Central Park reduced with committed
leases secured
6.2%
Lease Expiries in
FY19 as a Proportion
of Portfolio Gross 4.8%
Rental Income 2.0%1
1.4%
1.4% 1.8% 0.9% 0.2% 0.2%
0.2% 0.5%
China Square Central Alexandra Central Park 357 Collins Street Farnborough
Technopark Business Park
Net of commitments secured Commitments secured
As at 31 March 2019
7 (office)
Number of leases expiring1 1 3 (retail) 1 (office) 5
2 (retail)
Average passing rents for expiring
S$6.42 (office)
leases (excluding those with S$3.90 A$991 (retail) A$605 (office) £22.7
S$5.36 (retail)
forward commitments secured)2
1. Adjusted for forward commitments secured.
2. Excludes lease incentives and retail turnover rents, if any. Figures for Singapore properties are on a gross rent per square foot per month basis, figures for Australian properties
are based on net face rent per square metre per annum basis while figures for Farnborough Business Park is based on net rent per square foot per annum basis. 17Portfolio Review Step-up rents 18
47% of FY19 leases by gross rental income % of portfolio gross rental income
incorporate rents escalations with rent escalations2
GROSS RENTAL 50%
INCOME1
% of portfolio gross rental income
Average % of % of
Property Leases step-up Property Portfolio 40%
China Square
7 2.6% 31.4% 5.5%
Central
30%
Alexandra 47.0% 47.2%
1 5.0% 0.1% Negligible 44.9%
Technopark
38.6%
Caroline
Chisholm 1 3.0% 100.0% 16.4% 20%
Centre
Central Park 30 3.1% 86.5% 14.0%
10%
357 Collins FY19 FY20 FY21 FY22
27 3.9% 93.1% 11.0%
Street
Weighted
Farnborough average
1 14.4% 1.0% 0.1% 2.6% 2.7% 2.5% 2.4%
Business Park fixed step-
ups
1. Excludes lease incentives and turnover rent, if any.
2. Based on leases as at 30 September 2018. 18Portfolio Review Top-10 tenants
Diversified tenant base
Top-10 tenants contributed 52% of portfolio gross rental income with a WALE of 5.81 years as at 31
March 2019
Top 10 tenants by gross rental income (as at 31 March 2019)
% Gross Rental
Tenant Property Sector Lease Expiry
Income2
Commonwealth of Australia Caroline Chisholm Centre Government Jul-25 16.5%
Rio Tinto Shared Services Pty
Central Park Mining & resources Jun-30 8.8%
Ltd
Commonwealth Bank of Banking, insurance & financial
357 Collins Street Dec-22 6.9%
Australia services
Consultancy & business
GroupM Singapore Pte Ltd China Square Central Jul-23 3.6%
services
Multimedia &
Service Stream Ltd 357 Collins Street Dec-193/ Dec-24 3.5%
telecommunications
Microsoft Operations Pte Ltd Alexandra Technopark IT products & services Jan-204 3.1%
Fluor Limited Farnborough Business Park Engineering May-195/ Jun-25 3.0%
Suntory Beverage & Food
China Square Central Food & beverage May-20 2.4%
Asia Pte Ltd
Nokia Solutions and Networks Multimedia &
Alexandra Technopark Feb-21/ Jun-21 2.1%
(S) Pte Ltd telecommunications
Olympus Singapore Pte Ltd Alexandra Technopark Medical/ pharmaceutical Oct-24 1.9%
Total 51.8%
1. The WALB (after accounting for rights to break) is 5.5 years.
2. Excludes lease incentives and retail turnover rents, if any. For Farnborough Business Park, reimbursements of rent free incentives and rent guarantee for certain unlet units, among others, by the vendor in
accordance with the terms of the acquisition (refer to announcement dated 14 December 2017 for details), are included.
3. Constitutes 0.3% of portfolio gross rental income.
4. During 2QFY19 tenant exercise its right to reduced lease tenure by two years to Jan 2020.
5. Constitutes 0.1% of portfolio gross rental income.
19Strengthening and
Reshaping the
Portfolio
Alexandra
AlexandraTechnopark,
Technopark,Singapore
Singapore
Artist’s impression of entrance to Alexandra Technopark, SingaporeStrengthening and reshaping the portfolio for long-term growth
Accretive Acquisitions
Expanded investment mandate to Europe (including
UK) in January 2018 for portfolio diversification and
long-term growth
Enhanced alignment with Sponsor’s top 3 geographical
markets (Singapore, Australia and Europe)
Accretive
Completed income-accretive acquisition of 50.0%
acquisitions interest in Farnborough Business Park on 29 Jan 2018
Current gearing of 29.1% provides financial flexibility to
pursue investment opportunities
Capital Recycling through Strategic Divestments
Strengthen and To improve portfolio quality and long-term performance
reshape portfolio To recycle capital for other growth opportunities
for long-term Divested 55 Market Street on 31 Aug 2018 and realised
growth a net gain of approximately S$75.7 million1
Recycling Asset
capital enhancement Asset Enhancement Initiatives
initiatives Enhance long-term performance and competitiveness
of properties and elevate tenants’ and visitors’
experiences
Alexandra Technopark repositioned as a
contemporary, vibrant and engaging business campus
following a S$45 million AEI which was fully
completed in 2QFY19
AEI for the retail podium of 18 Cross Street, China
Square Central is currently underway and expected to
complete in the second half of 2019
1. Net of transaction expenses and fees. 21Expansion of Investment Mandate
Synergistic alignment to Sponsor’s top 3 markets for GROWTH and DIVERSIFICATION
Announced expansion of investment mandate to Europe/UK
in Dec 2017
Granted right of first refusal for Frasers Property’s relevant Alignment with Frasers Property’s top 3
office/business space/business park assets in Europe geographical markets
(including UK)
Enhanced potential for future growth and diversification
Frasers Property’s assets by geography1
New FCOT market
since Dec 2017
Others
19%
UK
Singapore
(1 asset) 39%
New FCOT Europe and
market since UK
Dec 2017 18%
Singapore
(2 assets) Australia
24%
Existing FCOT
markets
Australia
(3 assets)
1. As at 31 March 2019.
22Acquisition of Farnborough Business Park, UK
Strengthening portfolio for LONG-TERM GROWTH
Acquisition of 50% interest in Farnborough Business Park (“FBP”) at a property value of £87.5 million 1 on 29 January 2018
FBP is an award-winning business park with solid fundamentals in a well-connected location in Thames Valley
7.3 98.0% 35
46.5 h ~548k sf
freehold land NLA years occupancy quality
long WALE2 rate3 tenants
90.4%
90% of leases
expiring beyond
FY2022
1.6% 2.4% 4.4% 1.2%
FY2019 FY2020 FY2021 FY2022 FY2023 and
beyond
All data are as at 31 March 2019.
1. In respect of 50.0% interest in FBP. Refer to the announcement dated 14 December 2017.
2. By gross rental income and included reimbursements of lease incentives, rent guarantees for certain unlet units and other commercial arrangements performed by the vendor, in accordance
with the terms of the acquisition (refer to announcement dated 14 December 2017 for details). The WALB (after accounting for rights to break) is 5.3 years.
3. After adjusting for leases for which the tenants have exercised their rights to break. 23Acquisition of Farnborough Business Park, UK (cont’d)
FBP is part of Frasers Property’s 3.3m sf NLA
1 portfolio in Thames Valley 2 Resilient UK business park market supported by
cost-efficient positioning
Synergistic network effect and portfolio scale
Frasers Property Group’s Thames Valley Business Parks Cost-efficient alternative to CBD and London locations
Prime rents1 (£ psf pa)
£105.00
£80.00 £69.50
£38.00 £36.00 £29.00 £27.00
Farnborough
Reading
(London)
Bracknell
Slough
Mayfair and
Mid-town
St James
City
Rents continued growing post-Brexit referendum
Prime rents1 £ psf pa in Farnborough Area
27.5 27.5 28.0 29.0 29.0
4Q 2017 1Q 2018 2Q 2018 3Q 2018 4Q 2018
Regarded as the principal high-tech region in the UK
Home to over 200 of UK’s top 300 companies
Thames Valley is the Well-established key business clusters including in manufacturing,
3 principal high-tech financial & business services, hi-tech, TMT and aerospace
region in the UK Access to quality workforce and talent pool from well-known
universities
Convenient transport linkages to London and Heathrow airport
Source: Market Overview Thames Valley and Farnborough Area, UK dated 30 November 2018, JLL Research, FCOT 2018 Annual Report, CBRE London Submarkets Snapshots Q4 2018, CBRE Market View,
Thames Valley & M25 Office.
1. Prime rents is defined as the top open-market rent that could be expected for a notional office unit of the highest quality and specification in the best location in a market. It represents JLL’s market view and
is based on an analysis/review of actual transactions for prime office space, excluding any unrepresentative deals in a given time period. 24Divestment of 55 Market Street
Completed divestment of 55 Market Street to an unrelated third party for S$216.8 million on 31 Aug 2018
Sale price was almost triple of initial purchase price1
Significant value unlocked with a net gain of S$75.7 million 2 over book value2
Divestment proceeds used to repay debts, significantly reducing gearing to 28.3% as at 30 September 2018 (30 June
2018: 35.4%)
Created substantial debt headroom and financial flexibility to pursue future growth opportunities initiatives
S$216.8 mil c. 3X S$75.7 mil 1.6%
or
S$3,020 psf of S$72.5 mil net gain over Implied exit NPI
original S$139.9 mil book yield3
purchase price value1
sale consideration in 2006
1. Acquired in 2006 for S$72.5 million.
2. Net of transaction expenses and fees.
3. Based on the annualised net property income of 55 Market Street for 3QFY18. 25Alexandra Technopark AEI fully completed
$45 million AEI fully completed
Contemporary business campus with a more vibrant, stimulating and engaging environment
Generous offering of wellness, lifestyle, social and other amenities
Well received by tenants and other stakeholders
New entrance gateway to Alexandra Technopark
26Alexandra Technopark A contemporary Business Campus
Wide range of wellness, lifestyle, social and other amenities
New BBQ pits New shower facilities and lockers
New amenity hub New cycling paths New car free zone for exercises/events
New bicycle racks New nursing rooms New futsal courts New convenience store
New landscaped roof garden New function room for tenants’ use Various outdoor exercise equipment Childcare centre
27China Square Central New hotel to enhance vibrancy
New 16-storey Hotel1 at China Square Central (“CSC”) obtained Temporary Occupation Permit
The 304-room Capri by Fraser, China Square hotel is expected to commence operations in 2Q 2019 and
will bring increased activity and vibrancy to CSC and benefit retail tenants
View of the Hotel
China Square Central Capri by Fraser, China Square
1. Undertaken and owned by an entity of Frasers Property Limited. Refer to the Circular to Unitholders dated 3 June 2015 for details. 28China Square Central Revamping 18 Cross Street retail podium
S$38 million AEI in progress and expected to complete in 2H20191
Retail podium NLA to potentially increase to c.80,000 sf1 from c.64,000 sf pre-AEI
Close to half of NLA pre-committed to-date
JustCo to occupy the entire 2nd level of the retail podium and certain adjoining spaces
Artist’s impression of the retail podium for illustration only Artist’s impression for illustration only
1. Based on provisional scheme and may be subject to change. 29Central Park Enhancing experience and functionality
Plans for Central Park to undergo a S$23 million AEI (FCOT’s 50% share: S$11.5 million) to upgrade
lobby and forecourt areas to consolidate its position as a premium grade building in Perth CBD
The AEI aims to create a contemporary, dynamic and community-friendly business environment with a
higher quantum of amenities and flexible spaces
Works are currently expected to commence in 2Q 2019 and complete in 3Q 2020
Community-friendly features:
- Contemporary lobby with modern finishes and
more natural lighting
- Flexible work spaces supported by F&B amenities
to cater to contemporary working styles
- Flexible public spaces to host art, community and
wellness events
- Business pods with meeting facilities Artist’s impression for illustration only
- Lush landscaping and greenery
- Handicap-friendly access and toilet facilities
- Enhanced openness and connectivity to the
54,000 sf landscaped park adjacent the property
Artist’s impression for illustration only Artist’s impression for illustration only
30Appendix
China Square Central, Singapore
China Square Central, SingaporeAppendix: Asset Details and Market Overview
Portfolio Update Singapore assets
                                             China Square Central –                                                     Alexandra Technopark – rejuvenation and
                                              healthy occupancy                                                              repositioning fully completed

 Occupancy                       95.3% 1,2 (office tower: 96.8%1,2)                                                  59.2% 2
 WALE                            1.7 years                                                                           2.1 years
 WALB                            1.7 years                                                                           2.0 years
 Recent new                      Grasshopper Pte Ltd, Elitaire Law LLP, Reps                                         Zuse Holdings Pte Ltd, Power Automation Pte Ltd,
 leases and                      Holdings Pte Ltd, Vincent Lim & Associates LLC,                                     SAP Asia Pte Ltd, Omron Asia Pacific Pte Ltd
 renewals                        Gravitea Private Limited, Ichikokudo Hokkaido
 (selected)                      Ramen, Harry’s Bar, Ground Zero

 Tenants
 (selected)

 Data as at 31 March 2019.

 1.   Excluding 18 Cross Street retail podium (NLA c 64,000 sq ft) which is currently closed for asset enhancement works.
 2.   Committed occupancy as at 31 March 2019.                                                                                                                          33
Portfolio Update Australia assets
Central Park – Caroline Chisholm Centre – 357 Collins Street – high
long WALE of 7.7 years1 fully occupied with long WALE occupancy in a strong market
of 6.3 years
Occupancy 83.5%1 100.0% 97.3%
WALE 7.7 years 6.3 years 3.1 years
WALB 7.6 years 6.3 years 3.1 years
Recent new WeWork, IOOF Service Co Pty Ltd Property occupied until July 2025 Analytical Systems Pty Ltd, Fresh Fulham
leases and by a single tenant, the Commonwealth of Place Melbourne Pty Ltd
renewals Australia (AAA rated2)
(selected)
Tenants
(selected)
Data as at 31 March 2019.
1. Committed occupancy as at 31 March 2019.
2. Based on Standard and Poor’s rating in September 2018.
34Portfolio Update United Kingdom asset
Farnborough Business Park –
long WALE and healthy
occupancy
Occupancy 98.0%1
WALE 7.3 years 2
WALB 5.3 years 2
Recent new -
leases and
renewals
(selected)
Tenants
(selected)
Data as at 31 March 2019.
1. After adjusting for leases for which the tenants have exercised their rights to break.
2. Include reimbursements of lease incentives and rent guarantee for certain unlet units, among others, by the vendor in accordance with the terms of the
acquisition (refer to announcement dated 14 December 2017 for details). 35Singapore office rents
General outlook for the office market is positive
Singapore Grade A and Grade B office rents1
Grade A CBD Core 3.2% qoq to S$11.15 psf
Grade B CBD Core 3.0% qoq to S$8.55 psf
Grade B Islandwide 2.6% qoq at S$7.90 psf
$12 11.2011.4011.30 11.15
10.60 10.95 10.90 10.80
11.00 10.60
$11 10.30 10.60 11.06 10.10 10.25 10.40
10.10
10.45
9.90 9.75 9.90 9.70
9.80 9.58 9.55 9.55 9.55 9.50 9.30
$10 9.10 8.95 8.95 9.10
9.40
9.00
$9 8.34
8.00
$8
7.90 8.00 8.05 8.00 7.80 7.70 7.70 7.90
$7 7.55 7.70 7.50
7.12 7.15 7.37 7.34 7.25 7.21 7.17 7.11 7.10 7.10 7.10 7.25 7.25 7.10 7.25 7.45
6.81 6.95 6.85 6.85 6.85 7.00 7.10
$6 6.35
$5 5.63 5.84
$4
$3
$2
2010Q1
2010Q2
2010Q3
2010Q4
2011Q1
2011Q2
2011Q3
2011Q4
2012Q1
2012Q2
2012Q3
2012Q4
2013Q1
2013Q2
2013Q3
2013Q4
2014Q1
2014Q2
2014Q3
2014Q4
2015Q1
2015Q2
2015Q3
2015Q4
2016Q1
2016Q2
2016Q3
2016Q4
2017Q1
2017Q2
2017Q3
2017Q4
2018Q1
2018Q2
2018Q3
2018Q4
2019Q1
Grade A Grade B Islandwide
Source: CBRE Research
1. CBRE, Singapore Market View, Q1 2019 36Demand, supply and outlook for Singapore CBD office market
Office supply-demand dynamics1 CBRE reported that the overall market continued to
look robust with tightening vacancy, healthy
absorption levels and increasing rents
Island-wide office vacancy rate reduced to 5.3% as
at March 2019 compared to 5.8% as at December
2018
Tenant demand was mainly driven by the
technology sector and co-working space operators,
while the majority of leasing activities comprised of
small and medium sized transactions
According to CBRE, the positive outlook for rents is
supported by the tapering new supply in the
Office vacancy rates1
medium term
CBRE also expects a potential medium-term
reduction in the existing supply due to
redevelopment activities.
1. CBRE, Singapore Market View, Q1 2019 37Singapore business park rents1
City fringe and rest of the island business park average rents remain stable2
Singapore Business Park (city fringe) rents2
$6.0 5.80 5.80 5.80
5.60 5.65 5.70
5.25 5.49 5.50 5.50 5.50 5.50 5.50 5.50 5.50 5.50 5.50 5.55
$5.5 5.35 5.35 5.30 5.30 5.30 5.40 5.40 5.40 5.40 5.40 5.40
5.10 5.10 5.05 5.05 5.05 5.05
5.05
$5.0 4.80
$4.5
$4.0 3.80 3.80 3.80 3.85 3.85 3.85 3.84 3.80 3.80 3.80
3.70 3.70 3.70 3.65 3.65 3.70 3.65 3.65 3.65 3.65 3.65 3.65 3.70 3.70 3.70 3.70 3.70 3.70 3.70 3.70 3.75
3.55 3.60 3.60 3.60
$3.5 3.20 3.20
$3.0
$2.5
2010Q1
2010Q2
2010Q3
2010Q4
2011Q1
2011Q2
2011Q3
2011Q4
2012Q1
2012Q2
2012Q3
2012Q4
2013Q1
2013Q2
2013Q3
2013Q4
2014Q1
2014Q2
2014Q3
2014Q4
2015Q1
2015Q2
2015Q3
2015Q4
2016Q1
2016Q2
2016Q3
2016Q4
2017Q1
2017Q2
2017Q3
2017Q4
2018Q1
2018Q2
2018Q3
2018Q4
2019Q1
Business Park (city fringe) Business Park (Rest of the Island)
1. Alexandra Technopark is a high-specification B1 industrial development located at the city-fringe, with certain physical attributes similar to business parks. Due to limited availability
of market research information directly relating to the asset class of Alexandra Technopark, market research information for business parks is provided for indicative reference.
2. CBRE, Singapore Market View, Q1 2019
38Demand, supply and outlook for Singapore business park market1
Business park supply-demand dynamics2
Island-wide vacancy decreased from 13.7% as at
December 2018 to 12.8% as at March 2019, partly
due to a decrease in stock
Net absorption was weak given the limited
availability of quality space
According to CBRE, the outlook for business park
space in the city fringe remains positive
Business park future pipeline2
1. Alexandra Technopark is a high-specification B1 industrial development located at the city-fringe, with certain physical attributes similar to business parks. Due to limited availability
of market research information directly relating to the asset class of Alexandra Technopark, market research information for business parks is provided for indicative reference.
2. CBRE, Singapore Market View, Q1 2019
39Perth CBD office supply and rents
Improving business sentiment in Western Australia’s economy continued to benefit Premium Grade and A Grade CBD
office segments
Total market vacancy reduced from 19.8% in January 2018 to 18.5% in January 2019
Prime Grade average net face rent was A$540 to A$640 per sqm per annum as at January 2019, with average lease
incentives between 40% and 50%
Knight Frank expects Prime Grade net effective rents to continue growing as the level of incentives decline
Perth CBD office vacancy (%) Perth CBD office face rents (A$ psm pa) and incentives (%)
Source: Knight Frank Research/PCA Source: Knight Frank Research
Source: Knight Frank Research, Perth CBD Office Market Overview, March 2019. 40Melbourne CBD office supply and rents
Melbourne CBD office market continued to be strong, on the back of strong economic performance in the state of Victoria
and rising demand for flexible working space
Market vacancy reduced from 4.5% in January 2018 to 3.2% in January 2019, the lowest level recorded in ten years
Prime Grade office average net face rent was A$638 per sqm per annum as at January 2019, with lease incentives
between 22% to 28%
Knight Frank projects net face rents to rise by 9.0% in 2019
Melbourne CBD Prime Grade office incentives (%) and net face
Melbourne CBD office vacancy rate (%) rents (A$ psm pa)
Source: Knight Frank Research Source: Knight Frank Research
Source: Knight Frank Research, Melbourne CBD Office Market Overview, March 2019. 41Thames Valley office supply and rents
Rents generally remained stable in 2018, with prime office rents in the majority of locations achieving all-time highs
For the Farnborough area, the indicative prime office headline rent was £29.0 psf per annum as at December
2018, while lease incentives were generally around 17.5% (for typical 10-year lease terms)
CBRE Research forecasts rents in the Farnborough area to increase and incentives to remain stable in the next
twelve months
Key Thames Valley Prime Grade office rents (£ per sf per annum) Thames Valley take up, Q4 2018
70
59.0
60 54.0
£ per sf per annum
50
39.0 38.0 36.5 36.0
40 35.0 35.0 33.0
29.0 27.0
30
20
10
0
Reading OOT
Slough
Staines
Bracknell
Farnborough
Hammersmith
Reading IT
Chiswick
Uxbridge
Maidenhead IT
Maidenhead OOT
Prime rent (£ per sf per annum)
Source: CBRE Research, Q4 2018 Source: CBRE Research, Q4 2018
Source: CBRE Market View, Thames Valley & M25 Office, 2H 2018. 42Appendix: Sustainability
Sustainability
Sustainability is one of the key aspects contributing to our aspirations of becoming a leading owner of quality
commercial real estate properties and the preferred choice for businesses and investors and to deliver long-term
growth to our Unitholders
FCOT’s sustainability strategies and action plans are based on the Frasers Group’s Sustainability Framework,
which sets out sustainability priorities until 2030
Key highlights of sustainability performance in FY2018 include:
FCOT is constituents of the iEdge Singapore ESG Leader and iEdge Singapore ESG Transparency
indices
All FCOT properties in Singapore are BCA Green Mark certified
All FCOT properties in Australia have National Australian Built Environment Rating System (NABERS)
Energy base building rating of at least 5.0-star
Acting
Farnborough Business Park won the prestigious Green Flag Award 2018 which recognises well-
Progressively
managed parks and green spaces globally
No known breaches of environmental laws and regulations and no confirmed cases with regards to
bribery and corruption reported
No known incidents of non-compliance with regulations and voluntary codes in relation to marketing
communications
11.1% year-on-year improvement in
51.1 hours of training per employee,
average building energy intensity
27.8% higher than the target of 40.0
7.5% year-on-year improvement in
hours
Consuming greenhouse gas (GHG) emissions intensity Focusing
No major safety incidents across our
Responsibly 12.0% year-on-year improvement in on People
portfolio
average building water intensity
More than S$900,000 community
10.0% year-on-year decrease in building
investments raised and donated
waste generated
Source: FCOT 2018 Annual Report
44Frasers Commercial Asset Management Limited 438 Alexandra Road | #21-00| Alexandra Point | Singapore 119958 Tel: +65 6276 4882| Fax: +65 6276 8942| Email: fcot@frasersproperty.com www.fraserscommercialtrust.com
You can also read