PROMOTORA DE INFORMACIONES, S.A - 3Q2020 Results October, 28th, 2020
←
→
Page content transcription
If your browser does not render page correctly, please read the page content below
January – September 2020 Results. Promotora de informaciones S.A.

                  3Q2020 Results

PROMOTORA DE INFORMACIONES, S.A.

                                                                        October, 28th, 2020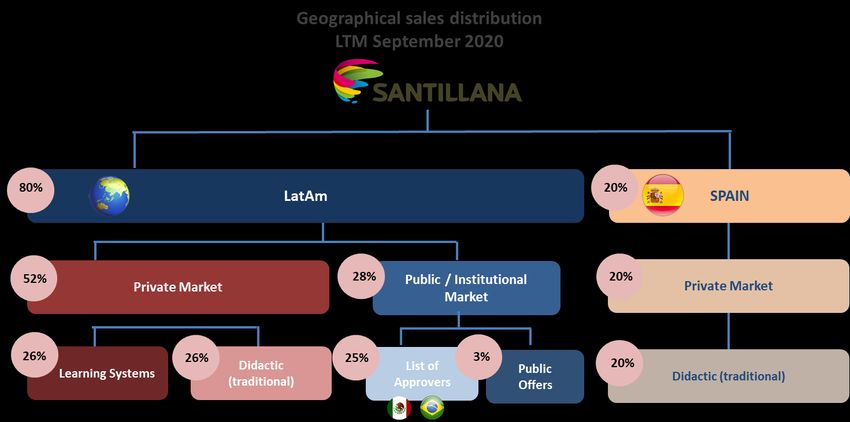
January – September 2020 Results. Promotora de informaciones S.A.

                          INDEX

  General Overview                              3

  Covid-19 Impact                               5

  Education                                     6

  Radio                                        12

  News                                         15

  Total Group                                  18

  Appendix                                     24

                               2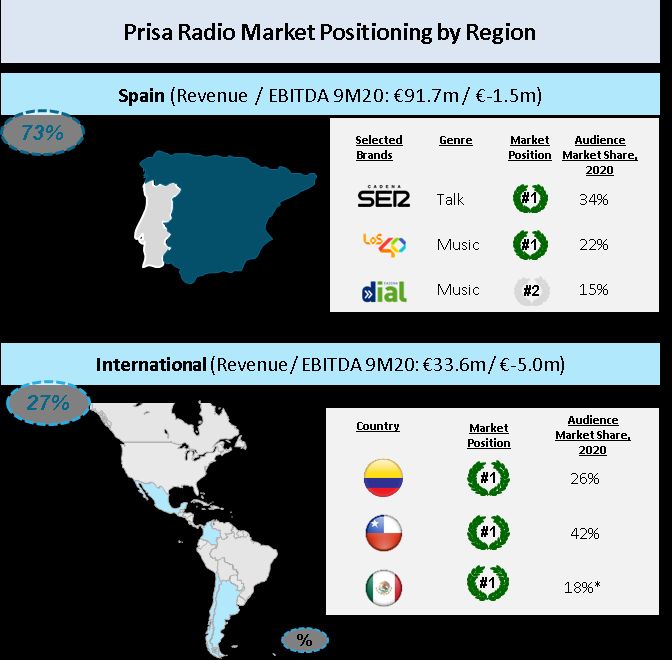
January – September 2020 Results. Promotora de informaciones S.A.

                                           GENERAL OVERVIEW
Prisa accelerates its strategic transformation, reinforces its flexibility and financial strength and
               boots its digital business transformation with subscription models

 ❑     Prisa refinances its debt until 2025 and agrees Santillana Spain disposal for an EV 465 million euro.

 ❑     The refinancing agreement reduces the Group's net debt by more than 30% and increases its liquidity. The
       company will have more than 275 million euros to meet its liquidity needs and to develop its strategic
       business plans.

 ❑     These agreements provide PRISA with considerable flexibility to accelerate the group's strategy sheet
       focused on Ed-Tech subscription models in Latin America and on the digital development and subscription
       models of its media businesses.

 ❑     PRISA sets the framework for a future separation of the Education and Media businesses

Perimeter effect: The results of the 9 months of 2020, include Media Capital as a discontinued operation. The company
has agreed the sale of the remaining 64.47% of Media Capital stake to a group of Portuguese investors for an amount
of 36.9 million euros. The operation has obtained the necessary approvals from the creditors and expects to
materialize before the end of the year. Santillana Spain remains within the scope of the results of the first 9 months of
the year. After the announced sale operation, it will be registered as discontinuity from October, 2020 with retroactive
effect to January, 2020.

 ❑ In January-September period, the Covid-19 had an estimated negative impact on the group's revenues of -166
   million euros and on EBITDA of -119.4 million euros.

 ❑ The education business shows resilience by maintaining margins in a difficult environment marked by Covid-19
   where schools in most countries where Santillana is present have not yet opened face-to-face assistance.
   Revenue falls in local currency by 6.5% (-14.9% in euros) with digital revenues representing 26% of the total
   and 53% of total private sales in LatAm. The number of students on subscription models grew by 20% in the first
   nine months of the year to reach 1,726,000 students. The good behavior of the subscription models and public
   sales, mainly in Brazil, offsets partially the fall of LatAm’s didactic business and Spain (being 2020 a year without
   significant novelties). Highlights in the period, the maintenance of margins despite the fall in revenue and the
   performance of Brazil, which increases its EBITDA by more than 4x to reach 23.6 million euros, due to the sales of
   the PNLD19 that were recorded on Q12020 and for the registration in 3Q2020 of the replacement sales that last
   year were recorded in the 4T.

 ❑ Media business has been particularly affected by Covid-19 crisis, showing falls in revenue over the period of -
   37.6% in Radio (1Q -21.1%; 2Q -54.3%; 3Q -33.7%) and of -25.8% in News (1Q -15%; 2Q -38.9%; 3Q -21.7%) due
   to the declines in the advertising market and print copies sale. Both business reduces its costs.

          ❑ Radio makes progress in its strategy of creating new digital audio content, multichannel distribution
            and product innovation that is reflected in the growth of the consumption of streaming hours and
            podcast downloads that have reached in September 61.2 million (+12%) and 25.4 million (+63%),
            respectively.

          ❑ News boost the transformation of its digital model with the launch in early May of the EL PAÍS
            payment system. It now has 117,421 subscribers, of which 71,021 are digital exclusives with an ARPU
            close to 9. The payment model is proving to be a model that works economically and with great
            potential for future development. This puts the focus on the growth of subscription income that will
            allow the consolidation of the digital business developed in recent years, making it more robust and
            scalable. 41% of News revenues are already digital.

                                                             3
January – September 2020 Results. Promotora de informaciones S.A.

                                         GENERAL OVERVIEW
❑ Compliance with the 40 million euro contingency plan implemented in all business units to reduce the negative
  effects of the Covid-19. By September, over 80% of expected plan has been executed.

❑ FX has had negative effect on revenues of -44.0 million euros and on EBITDA of -5.4 million euros mainly due to
  devaluations in Mexico, Argentina and Brazil.

❑ Net result affected mainly by impairments from the sale of Media Capital amounting to 77 million euros, by the
  impairment of all the outstanding tax credits in Spain amounting to 64.5 million euros and by impairments to
  radio assets in Mexico and Chile amounting to 21.9 million euros.

❑ Net Bank Debt at the end of the period stands at EUR 1,107 million compared to EUR 1,061 as of December
  2019. Which means a Net Debt/EBITDA ratio of 7.8x. The pro-forma debt ratio for the announced operations is
  6.7x.

                                                           4
January – September 2020 Results. Promotora de informaciones S.A.

                            COVID-19 IMPACT ON 9M2020 RESULTS

 ❑   COVID-19 is having an unprecedented impact on the economy and society, harming industries and businesses
     around the world. The virus is significantly affecting the countries where Grupo PRISA is present.

 ❑   At Grupo PRISA, the media are suffering the most, while the education business is currently proving to be
     more resilient, despite the fact that the campaigns have been affected by the difficulties of an environment
     where schools in most of the countries where Santillana is present have not yet begun their face-to-face
     activity.

 ❑   Since the crisis began, PRISA, as a business group focused on two sectors as essential as education and the
     media, has given the highest priority to the continuity of its activities, taking the necessary measures to
     protect health and safety of its employees, suppliers and customers; and, at the time, has reaffirm its social
     commitment by offering access to comprehensive and rigorous information, quality entertainment and
     online educational services in support of families and schools in Spain and Latin America.

 ❑   In January-September period, Covid-19 has had in the group an estimated negative impact on revenues of -
     166 million euros and on EBITDA of -119.4 million euros.

 ❑   The Company has put in place a 40 million contingency plan (March-December) to reduce the negative
     impacts of Covid-19, which includes cost reductions in all items and that it is being rigorously fulfilled. As of
     September, over 80% of the planned plan has been executed and it is expected that by the end of the year,
     the savings plan will surpass the 40 million committed.

 ❑   Consequences for the Group's future operations continue to be uncertain and will depend to a large extent
     on the evolution and spread of the pandemic in the coming months, as well as on the responsiveness and
     adaptation of all impacted economic agents.

 ❑   On 1Q2020 Results release and given the uncertainty that existed to that date, the company invalidated the
     2020 Outlook communicated to the market at the end of February. It is not yet possible to estimate impacts,
     and it is premature to carry out a detailed assessment or quantification of the possible impacts that Covid-19
     will have on the Group in the coming months, due to the uncertainty of its consequences in the short, medium
     and long term, and especially with regard to the risk of changes in certain financial aggregates and the risk of
     valuation of the assets and liabilities on the balance sheet. For Q4, it is expected that Media advertising will
     continue with similar falls as the market and that Education will be affected by FX evolution, by the lack of
     novelties in the public purchase of Ensino Medio in Brazil and by the beginning of the South campaign, which
     could be affected by the lack of opening of schools in person.

ESTIMATED IMPACT ON 9M2020 REVENUE                               ESTIMATED IMPACT ON 9M2020 EBITDA

     Santillana   Radio    News     GROUP                                  Santillana   Radio    News    GROUP

                                                                             -28.4
        -55.1

                                                                                         -58.7
                   -70.7                                                                         -32.3    -119.4

                           -40.2   -166.0

                                                            5
January – September 2020 Results. Promotora de informaciones S.A.
EDUCATION
Business description and market position
Peimeter effect: On October 19th 2020, the company has agreed to sell Santillana Spain's business to Sanoma for
an EV of 465 million euros. The figures as of September include the business of Santillana Spain in the perimeter. As
from October 2020 with retroactive effect to January 2020, Santillana Spain's business will be accounted for as a
discontinued operation.
The sale of Santillana Spain's business, allows Santillana to focus its efforts on boosting subscription models in
Latin America, where it has a unique value proposition, being the only Pan-LatAm platform that is leading the
expansion of subscription models outside Brazil. With 1,726,000 students in subscription models, it has the
competitive advantage of being the only global operator in all markets. Santillana is focused on the K-12
education market, which is the largest in size, most attractive and most resilient due to its compulsory education
nature.
Within the K-12 market, Santillana, once sold the business of Santillana Spain, develops its activities in 2 areas with
different market dynamics:
A LatAm’s Private Market: 52%* of total Santillana sales (65% proforma Santillana Spain disposal). Focused
on transformation into subscription model.
B LatAm’s Public / Institutional Market: 28%* of total Santillan sales (35% proforma Santillana Spain
disposal). With established programs in Brazil and Mexico and share growth.
Perimeter subject to the announced transaction
Leadership in the K-12, with special focus on subscription models and with the opportunity to
transform students of traditional education (didactic) into subscription models
* Data for LTM September 2020
6January – September 2020 Results. Promotora de informaciones S.A.
EDUCATION
Business description and market position
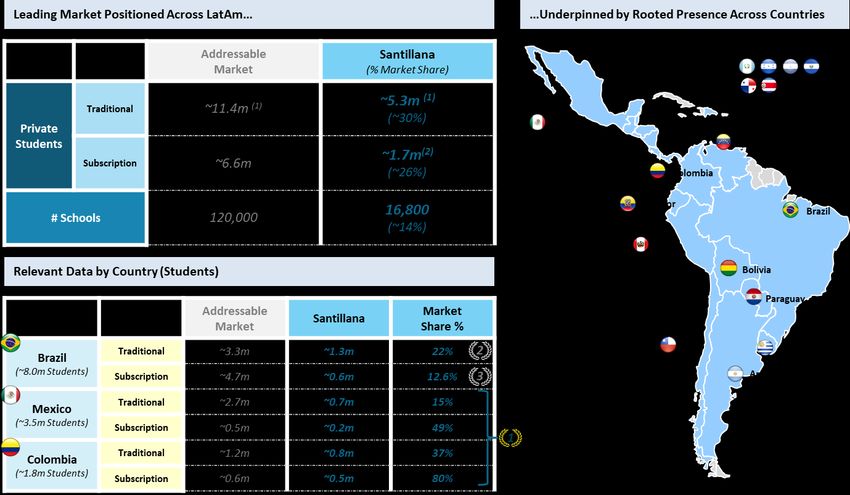
A LatAm’s private Market K-12+
A 52%* of Santillana’s revenue are generated on LatAm’s private market. (65% proforma Santillana Spain disposal).
In the LatAm’s private market within the K-12, there are 18 million students of which approximately 11.4 million
study through didactic methodology and 6.6 million through subscription models.
A big transformation in the educational development of all Latin American countries is taking place, education is
being transformed from a didactic/traditional book sales model to a contents and services sale through improve
technology (subscription model). This model provides business improvement to Schools and companies, as well
as educational improvement to students.
LatAm's private market sharing between didactic/traditional education and subscription model and Santillana's
global positioning is shown below:
1. Students users of Santillana books. From 1 subject to full curriculum. Not Santillana’s exclusively.
2. Santillana’s exclusively students
Santillana is the only Pan-LatAm education operator present in all Latin American countries with an undisputed
leadership position in most of them. It is the only Pan-LatAm operator that has developed subscription models
outside Brazil.
Santillana develops a key role in the technological development of educational systems of the countries in which
it operates through the implementation and development of the technology in the educational learning system.
Santillana has created a scalable technological platform for any user in any region. Its offer includes a
comprehensive service aimed at schools, teachers and students, which incorporates technology, training and
counseling. Subscription models (UNO, Compartir, Farias Brito, Educa and English subscription model) account for
26%* of Santillana's total revenues and 50%* of total private education revenue in LatAm. Santillana’s subscription
models are present in 15 Latin America countries.
Santillana, today, has its full focus on the transformation and growth of subscription models. Its leadership and
undisputed positioning in the didactic business in most Latin American countries and its achievements in
positioning its subscription models, provides Santillana a privileged position to successfully accelerate this
transformation.
* Data for LTM September 2020.
7January – September 2020 Results. Promotora de informaciones S.A.
EDUCATION
Business description and market position
SUBSCRIPTION MODELS
The subscription model business offers more revenue visibility vs. didactic model, with signed contracts for 3
and 4 years period with an average revenue per student higher than the average price per student of the
didactic model. The average renewal rate on such systems is close to 90% with an EBITDA margin approx. of
30%.
The evolution of subscription models since its launching has been as follows:
Revenue (€Mn) Students (000´s)
% Revenue
LatAm Priv
10% 16% 37% 40% % %
166 1726
142
126
78
14
2011 2013 2018 2019 2020E
SUBSCRIPTION MODELS IN THE COVID-19 ENVIRONMENT
Santillana's subscription models have shown during this pandemic and economic crisis that we are experiencing
due to Covid-19, greater resistance and its comprehensive pedagogical proposal has been more reinforced by
adapting much better to an online education with a blended offer formed of printed and digital content and a
wide range of services that we have been able to offer to schools without interruption through our
technological platforms.
Santillana has achieved in the first nine months of 2020 a growth in students of 20% to reach 1,726,000
students. In this environment of crisis that we are experiencing, there has been, since April, a drop in
enrollment in schools linked to our subscription models of southern campaign by 4% and northern campaign by
10%, with special emphasis on early childhood education. This drop is already reflected in the figure of
1,726,000 students
In Brazil, Santillana has been the Company which has grown the most in students in 2020 compared to the
main competitors, from 427,000 students in 2019 to 591,000 by 2020 (+39%)
In the context of the exceptional circumstances caused by Covid-19, with the temporary closure of schools,
Santillana has guaranteed its customers the school activity in total normality, through its platforms and digital
resources. Interactions in its education systems have increased by more than 482%.
Covid-19 is representing a fundamental change in education, accelerating the digital transformation of both
students and teachers.
8January – September 2020 Results. Promotora de informaciones S.A.
EDUCATION
Business description and market position
B LatAm’s Public/Institutional Market K-12
Santillana participates in LatAm’s Public Market through different governments tenders where Brazil and Mexico are the
most relevant countries. Revenue coming from Public Sales accounts for 28%* of Santillana's total sales. (35% proforma
Santillana Spain disposal).
In Brazil, which is the most relevant country, government purchases through PNLD** program and follows a purchasing
schedule of Fundamental I, Fundamental II, and Ensino Medio, with a system of novelties and repositions every 3 or 4
years.
Santillana has managed in recent years to significantly increase its share in Brazilian government orders thanks to the
commercial effort and its product offering. In 2019, the share achieved in FII stood at 32.5%, leading the program and
doubling the share compared to previous cycle.
Government buying dynamics, especially in Brazil, usually generate both temporal and volume variations between the
various years of the educational cycle. Despite this fact, it is a very profitable business with growth prospects with long-
term inflation.
By 2020, no novelties are expected and FI, FII and Ensino Medio repositions are expected. By 2021, novelties on Ensino
Medio interdisciplinary books and subject books are expected, as well as FI and FII repositions.
As of September 2020, orders for FII and Ensino Medio (subject books) for 2020 have already been issued, being the
amounts in line with what is expected. FI Respositions (whose amount is also in line with expectations and whose
registration will take place according to the government’s collection schedule) are pending, and may fluctuate from 4Q
2020 to 1Q 2021. (The total amount amounts to 123 million Reais).
* Data for LTM September 2020.
* * PNLD refers to Programa nacional do Libro Didáctico in Brazil.
9January – September 2020 Results. Promotora de informaciones S.A.
EDUCATION
9M 2020 Main Headlines
❑ In the current macro context and in view of difficulties faced in most schools that have not yet opened
face-to-face assistance by Covid-19, education sales show resilience with a 6.5% drop in local currency (-
14.9% in euros). The good performance of subscription models and public sales especially in Brazil
partially compensates for the decline experienced in the didactic business. Digital revenue represents
26% of the total and 50% of total private income in LatAm in the period.
❑ Subscription models grow in revenue by 15% in local currency (1% in Euros) to reach 103 million
euros with a growth in students of 20% to surpass 1,726,000 students. Santillana's technology
platform has achieved a record of connectivity and content usage since the beginning of
confinement guaranteeing its customers the school activity normally. During this period, Santillana
opened its technology platforms to all its students in Spain and Latin America in order to help and
support the continuity of the educational process.
❑ Didactic business sales in LatAm show a fall of 35% in local currency (41% in euros) explained by
(i) sales from some South area countries (mainly Argentina, Chile, Ecuador and Peru) that have
been affected by the lock down of the supply chain before campaigns are completed, (ii) sales
from some North area countries (mainly Mexico, Dominican Republic and Puerto Rico) where
the campaign has suffered from the difficulties of the macroeconomic environment and the non-
face-to-face start of classes and (iii) the transition of students to subscription models.
❑ Public sales reach 68.3 million euros with growth of 44% (75% in local currency) mainly
explained by the outstanding sales of Brazil's 2019 PNLD that have been recorded in 1Q2020 and
and by the advance of reposition sales that have been recorded in the 3Q while last year they
were registered in 4Q.
❑ Spain shows revenue fall, as 2020 is a year without significant novelties in line with
expectations.
❑ EBITDA reaches EUR 110.1 million compared to EUR 129.2 million in the same period of 2019. Fall in local
currency of 9.4% (-14.8% in euros).
❑ Margins maintenance thanks to the savings made mainly in staff expenses and external services.
❑ Negative FX impact on revenues of €-38.8 Mn and €-7.0 Mn on EBITDA by currency devaluation mainly in
Argentina, Brazil and Mexico.
❑ Covid-19 impact on Santillana’s first 9 months results has had an estimated negative impact on revenues
of €-55.1Mn and on EBITDA of €-28.4Mn.
❑ For the 4Q of the year, remain as pending, returns of the North area campaigns (Mexico mainly), the
beginning of the South area campaign and the registration of Brazil’s reposition public sales (FI) whose
final amount to be registered in 2020 (123 million Reais) will depend on i) the government's collection
schedule, which may occur between Q4 2020 and Q1 2021 and ii) FX evolution.
10January – September 2020 Results. Promotora de informaciones S.A.
EDUCATION
Revenue Breakdown
JANUARY - SEPTEMBER JULY - SEPTEMBER
€ Millions 2020 2019 % Chg. 2020 2019 % Chg.
Operating Revenues: breakdown
Education sales 389,1 457,3 (14,9) 146,3 204,0 (28,3)
Private Latam 195,5 258,8 (24,5) 41,3 69,4 (40,5)
Didactic 92,3 156,7 (41,1) 15,4 38,4 (59,8)
Learning systems 103,2 102,0 1,1 25,8 31,0 (16,7)
Public sales 68,3 47,4 44,1 20,4 28,8 (29,2)
Spain* 125,2 151,1 (17,1) 84,7 105,8 (20,0)
Other revenues 3,3 3,8 (14,7) 1,5 1,1 28,9
Operating Revenues 392,3 461,1 (14,9) 147,8 205,2 (28,0)
Operating Revenues at constant currency: breakdown
Education sales 427,7 457,3 (6,5) 160,0 204,0 (21,6)
Private Latam 219,3 258,8 (15,3) 45,7 69,4 (34,1)
Didactic 101,9 156,7 (35,0) (4,2) 38,4 ---
Learning systems 117,3 102,0 15,0 50,0 31,0 61,2
Public sales 83,2 47,4 75,4 29,5 28,8 2,6
Spain* 125,2 151,1 (17,1) 84,7 105,8 (20,0)
Other revenues 3,5 3,8 (8,3) 1,5 1,1 32,8
Operating Revenues 431,2 461,1 (6,5) 161,5 205,2 (21,3)
P&L
JANUARY - SEPTEMBER JULY - SEPTEMBER
€ Millions 2020 2019 % Chg. 2020 2019 % Chg.
Reported Results
Operating Revenues 392,3 461,1 (14,9) 147,8 205,2 (28,0)
Spain business 121,5 147,9 (17,9) 81,7 102,6 (20,3)
International business 269,4 311,6 (13,5) 65,4 102,2 (36,0)
Global Educational IT & HQ 1,4 1,6 (8,1) 0,7 0,3 109,5
Expenses 282,3 331,9 (15,0) 92,3 137,8 (33,1)
Spain business 63,8 77,9 (18,1) 35,4 46,3 (23,6)
International business 201,5 236,3 (14,7) 51,2 85,7 (40,2)
Global Educational IT & HQ 16,9 17,7 (4,8) 5,6 5,7 (2,0)
EBITDA 110,1 129,2 (14,8) 55,5 67,4 (17,5)
Spain business 57,6 70,0 (17,7) 46,3 56,3 (17,7)
International business 67,9 75,3 (9,9) 14,2 16,5 (14,2)
Global Educational IT & HQ (15,4) (16,2) 4,4 (4,9) (5,4) 8,7
EBITDA Margin 28,1% 28,0% 37,6% 32,8%
EBIT 71,0 86,4 (17,8) 40,6 51,9 (21,7)
Spain business 49,0 61,1 (19,7) 39,7 49,5 (19,7)
International business 40,9 45,4 (10,1) 7,7 9,6 (19,9)
Global Educational IT & HQ (18,8) (20,1) 6,4 (6,9) (7,3) 6,2
EBIT Margin 18,1% 18,7% 27,5% 25,3%
2020 2019 % Chg. 2020 2019 % Chg.
Results at constant currency
Operating Revenues on constant currency 431,2 461,1 (6,5) 161,5 205,2 (21,3)
Spain business 121,5 147,9 (17,9) 81,7 102,6 (20,3)
International business 308,3 311,6 (1,1) 79,1 102,2 (22,7)
Global Educational IT & HQ 1,4 1,6 0,7 0,3 109,5
EBITDA on constant currency 117,1 129,2 (9,4) 57,0 67,4 (15,4)
Spain business 57,6 70,0 (17,7) 46,3 56,3 (17,7)
International business 74,9 75,3 (0,6) 15,6 16,5 (5,5)
Global Educational IT & HQ (15,4) (16,2) (4,9) (5,4) 8,7
EBITDA Margin 27,2% 28,0% 35,3% 32,8%
EBIT on constant currency 73,7 86,4 (14,7) 40,6 51,9 (21,7)
Spain business 49,0 61,1 (19,7) 39,7 49,5 (19,7)
International business 43,5 45,4 (4,3) 7,7 9,6 (20,2)
Global Educational IT & HQ (18,8) (20,1) (6,9) (7,3) 6,2
EBIT Margin 17,1% 18,7% 25,1% 25,3%
* Spain's figure includes 5.2Mn in 2020 and 4.6 Mn in 2019 for Portugal and others
11January – September 2020 Results. Promotora de informaciones S.A.
RADIO
Business description and market position
PRISA Radio is the largest Spanish language radio platform. As of September 2020 it has presence in 10 countries, over
21 million listeners, 61.2 million of streaming hours consumption, 25.4 million Podcasts download (including Podium
podcast) and with excellent market positioning in the main Spanish-speaking radio markets. PRISA Radio is the absolute
leader in Spain, Colombia and Chile.
In Spain, we highlight the competitive strength of radio business through its brands (Cadena Ser, Los40, Cadena Dial,
Los40Classic and Radiolé). According to the latest EGM survey, Cadena Ser maintains absolute leadership in the market
with 4.113 thousand listeners (market share of 34% of Spain’s generalist radio). Los40 ranks 2nd position in Spain after
SER and holds first place in the music radio market with audience shares of 22%.
In Chile and Colombia, the group's radios are leaders with respective audience share of 42% and 26%, respectively. In
Mexico (equity accounted), ranks for the first time first position in Mexico City with an audience share of 18%.
Spain figures include Headquarters
*
* Audience leadership in Mexico City, most relevant market
Diversified business portfolio by geography and nature
12January – September 2020 Results. Promotora de informaciones S.A.
RADIO
Business description and Market position
DIGITAL POSITIONING
PRISA radio is the leading global platform in Spanish with a focus on becoming the largest producer and distributor of audio in
Spanish.
Advances in its strategy of creating new digital audio content, multichannel distribution, and product innovation are reflecting
the growth of streaming hours and podcast downloads that reached 61.2 million and 23.8 million respectively in September.
Additionally, Podium Podcast, our leading platform with unique sound catalog in Spain and LatAm has reached 1.6 million
downloads.
JANUARY - SEPTEMBER SEPTIEMBRE
Millions 2020 2019 % Chg. 2020 2019 % Chg.
TLH TLH
Spain 27,4 23,3 18% 28,4 24,7 15%
International 31,0 30,7 1% 32,8 30,1 9%
TOTAL 58,3 54,0 8% 61,2 54,8 12%
PODCASTS DOWNLOADS PODCASTS DOWNLOADS
Spain 15,7 7,8 102% 17,4 8,9 96%
International 5,7 5,3 8% 6,4 5,5 15%
TOTAL 21,4 13,1 64% 23,8 14,4 65%
PODIUM PODCAST PODIUM PODCAST
TOTAL 1,5 1,1 35% 1,6 1,2 39%
TLH: Total listened hours
13January – September 2020 Results. Promotora de informaciones S.A.
RADIO
9M2020 Main Headlines
❑ Progress towards its strategy of creating new digital audio content, multichannel distribution and product
innovation that is having its reflection in the growth of the consumption of streaming hours and podcast
downloads that have reached in September the figure of 61.2 million and 25.4 million respectively.
❑ Leadership in Spain, Colombia and Chile, and for the first time in Mexico City.
❑ Radio results in 9M2020 have been affected by Covid-19 impact, as there have been significant falls in the
advertising market and being the advertising its main source of revenue both in Spain and LatAm. Revenues
in the period amount to €122.5 Mn vs. €196.4 Mn in the same period of the previous year, a fall of 37.6% (-
35.1% in local currency).
❑ Advertising both national and local has experienced similar declines in the period. With similar behavior to
market excluding revenue coming from events.
❑ In Spain Q3 shows a fall on revenue of -17% with better behavior than Q2 where revenue fall by -50%.
❑ EBITDA reaches €-6.2 Mn vs. €41.8 Mn in the same period of the previous year, fall of €48Mn (€-49 Mn in local
currency).
❑ FX has had an impact on revenues of €-5.1 Mn and on EBITDA of €+1Mn.
❑ Covid-19 has had an estimated negative impact on revenues of -70.7 Mn and -58.7 Mn on EBITDA.
P&L
JANUARY - SEPTEMBER JULY - SEPTEMBER
€ Millions 2020 2019 % Chg. 2020 2019 % Chg.
Reported Results
Operating Revenues 122,5 196,4 (37,6) 41,1 61,9 (33,7)
Spain 91,7 133,2 (31,2) 30,8 37,2 (17,1)
Latam 33,6 66,2 (49,2) 11,1 25,7 (56,7)
Adjustments & others (2,8) (3,0) 6,1 (0,9) (0,9) 7,3
Reported Expenses 128,7 154,6 (16,7) 42,1 48,2 (12,7)
Spain 93,2 108,1 (13,8) 30,8 33,7 (8,4)
Latam 38,6 49,3 (21,6) 12,1 15,4 (21,6)
Adjustments & others (3,1) (2,8) (10,2) (0,9) (0,9) 5,3
EBITDA (6,2) 41,8 --- (1,0) 13,7 ---
Spain (1,5) 25,0 --- (0,0) 3,5 ---
Latam (5,0) 16,9 --- (1,0) 10,2 ---
Adjustments & others 0,3 (0,1) --- (0,0) (0,0) 94,3
EBITDA Margin -5,1% 21,3% -2,5% 22,1%
EBIT (39,2) 28,4 --- (5,4) 9,4 ---
Spain (10,3) 16,6 --- (2,9) 0,7 ---
Latam (25,7) 11,9 --- (2,5) 8,7 ---
Adjustments & others (3,2) (0,1) --- (0,0) (0,0) 94,3
EBIT Margin -32,0% 14,4% -13,2% 15,1%
2020 2019 % Chg. 2020 2019 % Chg.
Results at constant currency
Operating Revenues on constant currency 127,5 196,4 (35,1) 42,8 61,9 (30,9)
Spain 91,7 133,2 (31,2) 30,8 37,2 (17,1)
Latam 38,7 66,2 (41,6) 12,8 25,7 (50,0)
Adjustments & others (2,8) (3,0) 6,1 (0,9) (0,9) 6,3
EBITDA on constant currency (7,2) 41,8 --- (1,0) 13,7 ---
Spain (1,5) 25,0 --- (0,0) 3,5 ---
Latam (6,1) 16,9 --- (1,0) 10,2 ---
Adjustments & others 0,3 (0,1) --- (0,0) (0,0) 94,3
EBITDA Margin -5,7% 21,3% -2,3% 22,1%
EBIT on constant currency (43,3) 28,4 --- (5,6) 9,4 ---
Spain (10,3) 16,6 --- (2,9) 0,7 ---
Latam (29,8) 11,9 --- (2,7) 8,7 ---
Adjustments & others (3,2) (0,1) --- (0,0) (0,0) 94,3
EBIT Margin -33,9% 14,4% -13,0% 15,1%
14January – September 2020 Results. Promotora de informaciones S.A.
NEWS
Business description and market position
EL PAÍS
EL PAÍS is the largest global news platform in Spanish and continues to advance its strategic roadmap of growth and
consolidation.
Having successfully completed a first stage of geographical expansion and strong global growth, in July 2019 the
company ushered in a new era with the implementation of a new "Customer Strategy" where the following important
milestones have been met:
▪ Read under log-on launch on July 24, 2019.
▪ Activation of the digital subscription model on May 1, 2020.
REGISTRATION MODEL
Navigation under logging is the cornerstone on which the customer strategy is built. Through it, it is possible (i)
extract knowledge from readers, to rely on it, develop models of propensity for registration and subscription, among
other use cases and (ii) to obtain first-party data, essential for the development of the advertising model especially in a
context aimed at the disappearance of cookies. It is to highlight since the reading-under-registration initiative, the
number of registered readers has experienced strong growth reaching 3,118,451 readers in September 2020. During
the first 9M2020, 2,421,669 people have navigated EL PAÍS in an identified way consuming 14% of the total page
views on a monthly average.
REGISTERED READERS LOG-IN NAVIGATION
LOG-IN NAVIGATION READERS* % LOG-IN NAVIGATION COMSUPTION
+100,9
% 3.118.451
2.421.669 14%
X 7,7
1.552.105
315.814 1,20%
Acumulado Septiembre Acumulado Septiembre
2019 2020 9M2019 9M2020 9M2019 9M2020
* Number of different readers who have navigated in an identified way in El País in the period eliminating duplication
SUBSCRIPTION MODEL
The most relevant milestones in the launch of El País subscription model have been the following:
▪ Launch of the communication campaign occurred on 1st March 2020 "Suscríbete a los hechos" as a
preview of the activation of the payment model initially planned for 15 March.
▪ In the exceptional circumstances caused by the coronavirus, EL PAÍS decided to continue to offer its
readers free digital access according to its public service mission. For this reason, activation of the
subscription model was postponed to May 1st.
▪ Finally, the launch of the subscription model occurred on May 1, 2020, while essential information from
the coronavirus is freely accessible
El País has opted for the launch of a metered subscription model, more flexible than a hard paywall model, where
unlike this, the site is left open for all users until they have read 10 free articles per month. The launch price is 10 euros
per month, with a promotion of the first month at 1€ for the monthly format and with a 20% discount for annual
subscriptions.
El País has reached as of today 71,021 digital-only subscribers (out of a total base of 117,421 subscribers) with an
ARPU close to 9 euros. 28% of digital –only subscriptions are annual while 22% come from outside Spain
15January – September 2020 Results. Promotora de informaciones S.A.
NEWS
Business description and market position
DIGITAL ADVERTISING
EL PAÍS’s digital advertising has been experiencing a strong growth in recent years to represent in the 9M2020, 67.2% of its total
advertising. The greatest weight on EL PAÍS digital advertising comes from branded content and direct advertising whose revenue is
not affected by the launch of the payment model, since the determinant factor of advertising investment is marked by the strength
of the El País brand and the positioning of the product. The remaining advertising corresponding to the indirect one will be affected
in part mainly by the disappearance of certain formats. Therefore, the % of advertising affected by the launch of the payment model
is estimated to be less than 5% of the total.
DIGITAL ADVERTISING * EL PAIS DIGITAL ADVERTISING* EL PAIS BY CONCEPT
% Digital AD / Total AD
49,3% 55,7% 67,2%
28,9 5,6 24,6
€Mn
€Mn 24,9 24,6 10,4
8,6
Branded Direct Indirect Total 9M20
9M2018 9M2019 9M2020
* Data for gross advertising having been affected 9M2020 results by COVID-19 impact
** The estimate of advertising affected includes the following assumptions: 1) Branded content does not close;2) direct advertising has great cover weight that does not close;3)
indirect advertising will be affected of around 20/25% by the disappearance of certain formats and smaller print copies by the abandonment of non-subscribers once the paywall
appears to them
Company's focus is on the development of digital advertising products of differential value and compatible with the digital
subscription model enhancing (i) the branded content that is experiencing strong growth as differential content, (ii) direct
agreements with leveraged advertisers on the brand safety of the site and the data itself (iii) the joint reach of the WEMASS market
place to product develop and offer advertisers direct agreements based on audiences (and later on own data).
BRAND STRENGTH
EL PAÍS leadership and the growth of its audiences has been built in recent years around a brand strength whose recognition and
prestige globally represents a solid foundation for the future development of the digital model.
The latest data on a study of brand indicators conducted to press readers in Spain after the campaigns carried out in 2019 "Y tú qué
piensas" and in 2020 "Subscríbete a los hechos", show very positive results that recognize the strength and loyalty of the brand.
TOP OF MIND NET PROMOTER SCORE
% of people who name the brand spontaneously in the first place Reader loyalty and degree of recommendation on a scale of 0 to 10
45% 7
5
40%
January 19 March 20 January 19 March 20
AS
Diario As, the sports newspaper almost 100% digital, strengthens its growth and international expansion with the achievement of
leadership as a Spanish-speaking sports newspaper worldwide according to Comscore as of June 2020, where it has reached 108
million unique browsers. The sports newspaper already has 90% digital advertising with a large international presence.
AS DIGITAL ADVERTISING * AS GLOBAL PRESENCE
% Digital AD / Total AD
Mexico
EEUU España
77% 81% 89%
€Mn Colombia
17,2 17.1
15.3
Chile
1H2018 1H2019 1S2020 As Arabia is also present in countries in the Middle East and North Africa
* Data for gross advertising, with 1H2020’s results affected by
Covid-19 impact
16January – September 2020 Results. Promotora de informaciones S.A.
NEWS
9M 2020 Main Headlines
❑ After the launching in early may the paywall model, El País reaches 71,021 digital-only subscribers
with an ARPU close to 9 euros, proving to be an economic model that works, and with great
potential to be developed. Focus on the growth of subscription revenue that will consolidate the
digital business developed in recent years, making it more robust and scalable.
❑ EL PAÍS already has 3,118,451 registered readers, showing great growth since the launch of the
paywall.
❑ News results affected by Covid-19 crisis, conditioning both advertising revenues that fall by 28.1%
and sale of print copies revenues falling by 22%.
❑ Q3 shows a fall on revenue of -21.7% improving Q2 behavior where the fall was of -38.9%
❑ Digital revenue already represent 41%* of News' total revenue, growing its contribution by 25%.
❑ EBITDA in the period reaches EUR-17 Mn vs. EUR +1.1 Mn in the same period of the previous year,
which means fall of €18.1 million.
❑ Covid-19 has had an estimated negative impact in revenues of EUR-40.2 million and EUR-32.3
million on EBITDA.
* % of total revenues excluding PBS & IT
P&L
JANUARY - SEPTEMBER JULY - SEPTEMBER
€ Millions 2020 2019 % Chg. 2020 2019 % Chg.
Reported Results
Total Press Operating Revenues 113,5 152,9 (25,8) 37,9 48,4 (21,7)
PRESS Operating Revenues 100,3 136,4 (26,5) 33,8 42,2 (19,9)
Advertising 51,9 72,2 (28,1) 16,8 20,8 (19,2)
Circulation 36,2 46,5 (22,0) 13,2 15,7 (16,2)
Add-ons and Others 12,1 17,7 (31,6) 3,8 5,7 (32,7)
PBS & IT 13,2 16,5 (20,4) 4,1 6,2 (34,4)
Total Press Reported Expenses 130,4 151,8 (14,1) 41,2 48,9 (15,7)
PRESS Reported Expenses 117,2 134,5 (12,9) 37,4 43,0 (13,0)
PBS & IT Reported Expenses 13,2 17,3 (23,3) 3,8 5,9 (35,6)
Total Press Reported EBITDA (17,0) 1,1 --- (3,3) (0,5) ---
PRESS Reported EBITDA (16,9) 1,8 --- (3,6) (0,8) ---
EBITDA Margin -16,9% 1,3% -10,7% -2,0%
PBS & IT (0,1) (0,7) 89,8 0,3 0,3 (11,7)
Total Press Reported EBIT (26,0) (6,2) --- (5,9) (3,0) (97,1)
PRESS Reported EBIT (24,5) (4,1) --- (5,7) (2,8) (102,7)
EBIT Margin -24,5% -3,0% -16,8% -6,6%
PBS & IT (1,5) (2,1) 29,9 (0,2) (0,2) (9,9)
Advertising breakdown
JANUARY - SEPTEMBER JULY - SEPTEMBER
€ Millions 2020 2019 % Chg. 2020 2019 % Chg.
Reported Results
Advertising 51,9 72,2 (28,1) 16,8 20,8 (19,2)
Digital 36,0 41,1 (12,4) 11,9 12,6 (6,2)
El País 21,5 25,1 (14,4) 6,4 7,6 (14,9)
As 13,3 14,4 (7,1) 5,1 4,6 10,9
Others 1,2 1,6 (28,4) 0,4 0,5 (29,9)
Print 15,9 31,1 (48,9) 4,9 8,1 (39,5)
El País 12,2 24,6 (50,4) 3,6 6,5 (43,7)
As 1,9 4,1 (53,1) 0,6 1,2 (45,6)
Others 1,7 2,3 (25,2) 0,6 0,5 35,4
17January – September 2020 Results. Promotora de informaciones S.A.
TOTAL GROUP
9M 2020 Main Operating Headlines
❑ Progress towards on the Company's roadmap with the refinancing and sales agreement for Santillana Spain, which
gives PRISA considerable flexibility to accelerate the group's strategic plan focused on Ed-Tech subscription models
in Latin America and on the digital development and subscription models of its media businesses.
❑ Perimeter effect: Media Capital is recorded as discontinuity operation. The company has sold the remaining 64.47%
of Media Capital stake to a group of Portuguese investors for an amount of 36.9 million euros. The operation has
obtained the necessary approvals from the creditors and expects to materialize before the end of the year.
Santillana Spain remains within the scope of the results of the first 9 months of the year. After the announced sale
operation, it will be accounted as discontinuity since October, 2020 with retroactive effect to January, 2020.
❑ Santillana shows resistance despite having been affected the didactic business by the lock down of the supply chain
and difficulties in a physically closed school environment in most countries. Media business have been impacted by
significant declines in the advertising market.
❑ Focus on the growth and expansion of digital subscription models and on the boost of digital advertising and audio.
The group's digital revenues grows its contribution by 26%.
❑ Costs savings during the period complying with the contingency plan of €40 million put in place to reduce the
negative impacts that Covid-19 crisis may have on the business. Compliance of over 80% of the plan.
❑ Negative FX impact on revenues of -44.0 million and -5.4 million on EBITDA mainly due to devaluations in
Argentina, Brazil and Mexico.
❑ Net result affected mainly by impairments from the sale of Media Capital amounting to 77 million euros, by the
impairment all the outstanding tax credits in Spain amounting to 64.5 million euros and by impairments to radio
assets in Mexico and Chile amounting to 21.9 million euros.
P&L
JANUARY - SEPTEMBER JULY - SEPTEMBER
€ Millions 2020 2019 % Chg. 2020 2019 % Chg.
Reported Results
Operating Revenues 616,0 796,9 (22,7) 223,2 311,2 (28,3)
Reported EBITDA 82,1 114,2 (28,1) 50,0 79,6 (37,1)
EBITDA Margin 13,3% 14,3% 22,4% 25,6%
Reported EBIT (0,1) 49,6 --- 27,7 56,9 (51,3)
EBIT Margin 0,0% 6,2% 12,4% 18,3%
Financial Result (59,7) (61,4) 2,9 (21,9) (22,0) 0,3
Interests on debt (52,9) (44,2) (19,8) (19,0) (15,7) (21,4)
Other financial results (6,8) (17,3) 60,8 (2,9) (6,3) 54,1
Result from associates (6,8) 1,1 --- 0,1 0,5 (77,8)
Profit before tax (66,6) (10,7) --- 5,9 35,5 (83,3)
Income tax expense 80,4 29,6 172,1 4,5 16,4 (72,9)
Results from discontinued activities (76,5) (69,9) (9,5) (1,4) (76,9) 98,2
Minority interest (14,2) 0,3 --- (2,6) 1,1 ---
Net Profit (209,3) (110,4) (89,5) 2,8 (58,9) ---
MC impairment 77,3 76,4 0,0 76,4 (100,0)
Mediapro ruling 40,8 0,0 0,0 ---
Tax impairments 64,5 0,0 0,0 ---
Radio Assests impairments 21,9 0,0
Comparable Net Profit (45,6) 6,8 --- 2,8 17,5 (84,3)
€ Millions 2020 2019 % Chg. 2020 2019 % Chg.
Comparable Results
Operating Revenues 616,0 796,9 (22,7) 223,2 311,2 (28,3)
EBITDA 82,1 165,3 (50,3) 50,0 79,6 (37,1)
EBITDA Margin 13,3% 20,7% 22,4% 25,6%
EBIT 18,9 100,6 (81,2) 27,7 56,9 (51,3)
EBIT Margin 3,1% 12,6% 12,4% 18,3%
2020 2019 % Chg. 2020 2019 % Chg.
Comparable Results at constant currency
Operating Revenues on constant currency 660,0 796,9 (17,2) 238,6 311,2 (23,3)
EBITDA on constant currency 87,6 165,3 (47,0) 50,9 79,6 (36,1)
EBITDA Margin 13,3% 20,7% 21,3% 25,6%
EBIT on constant currency 17,0 100,6 (83,2) 26,9 56,9 (52,8)
EBIT Margin 2,6% 12,6% 11,3% 18,3%
Adjustments between reported results and comparable results are due to the 2019 adjustment of Mediapro’s ruling described on page 26,
the adjustments of the Media Capital impairments ( 2019 and 2020) and Tax credits and radio assets impairments.
18January – September 2020 Results. Promotora de informaciones S.A.
TOTAL GROUP
Cash Flow Statement
Sep.
€ Million 2020 Sep. 2019 Chg. 20/19
Abs. %
EBITDA 82,1 165,3 -83,1 -50,3%
Redundancies expenses 4,8 8,2 -3,5 -42,0%
EBITDA (excluding redundancies) 86,9 173,5 -86,6 -49,9%
Change in working capital -11,3 -66,5 55,2 83,0%
Redundancies paid -4,8 -11,5 6,6 57,8%
Taxes paid -15,3 -22,4 7,1 31,6%
Other cash flows and adjustments from operations -4,4 0,7 -5,1 ---
Capex -41,0 -48,3 7,3 15,0%
Financial investments -0,1 1,1 -1,2 ---
CASH FLOW BEFORE FINANCING ACTIVITIES 10,0 26,6 -16,6 -62,5%
Interests paid -23,7 -20,9 -2,8 -13,5%
Dividends received 10,9 0,1 10,9 ---
Dividends paid -1,1 -5,6 4,5 80,5%
Other cash flows from financing activities -25,8 -30,5 4,6 15,1%
- NIIF 16 -22,9 -24,5 1,6 6,5%
-Others -3,0 -6,0 3,0 50,6%
CASH FLOW FROM FINANCING ACTIVITIES -39,7 -56,9 17,2 30,2%
Fx impact, perimeter effect and others 0,0 ---
CASH FLOW BEFORE DIVESTMENTS -29,8 -30,3 0,5 1,8%
Divestments 8,2 3,7 4,6 125,3%
CASH FLOW BEFORE OPERATIONS -21,5 -26,6 5,1 19,2%
CASH FLOW BEFORE OPERATIONS EX. WK -10,2 39,9 -50,1 ---
Capital increase 0,0 197,5 -197,5 -100,0%
Media Capital sale 7,2 10,0 -2,8 -28,4%
25% Santillana acquisition 0,0 -313,2 313,2 100,0%
Dividends paid to DLJ 0,0 -29,5 29,5 100,0%
3iAcquisition 0,0 -36,1 36,1 100,0%
Mediapro 0,0 -51,0 51,0 100,0%
Cash flow from discontinued operations (Media Capital) 0,0 -0,5 0,5 ---
CASH FLOW -14,3 -249,5 235,2 94,3%
* Cash Flow excludes FX effect in Cash of Balance Sheet
19January – September 2020 Results. Promotora de informaciones S.A.
TOTAL GROUP
Financial Net Debt
TOTAL FINANCIAL DEBT
Sep.
Dec. 2019
2020
€ Million Chg. 20/19
Abs. %
- Financial debt 1.324,0 1.215,1 109,0 9,0%
- Non- current financial debt 1.172,2 1.164,9 7,4 0,6%
- Current financial debt 151,8 50,2 101,6 202,5%
Short term financial investments -6,4 -4,7 -1,7 -35,0%
Cash & cash equivalents -223,7 -166,6 -57,1 -34,3%
Fair value 13,1 17,4 -4,3 -25,0%
TOTAL BANK DEBT EXCLUDING MEDIA CAPITAL 1.107,0 1.061,1 45,9 4,3%
IFRS 16 liabilities 129,5 140,7 -11,2 -8,0%
TOTAL BANK DEBT w/IFRS16 1.236,5 1.201,8 34,7 2,9%
TOTAL FINANCIAL DEBT BY BUSINESS UNIT*
Sep. Chg. 20/19
Dec. 2019
2020
€ Million Abs. %
Prisa Holding+ Prisa Gestión Financiera+PAE+Otros 1.076,8 1.067,0 9,7 0,9%
- Financial debt 1.290,6 1.193,6 97,0 8,1%
- Cash, Short term financial investments and interco debt-213,8 -126,6 -87,3 -68,9%
Santillana -27,1 -38,4 11,3 29,3%
Radio -1,8 3,8 -5,5 ---
Press 59,2 28,7 30,4 106,0%
TOTAL BANK DEBT 1.107,0 1.061,1 45,9 4,3%
* Includes intragroup debt
9M2020 Bank net debt evolution is shown below:
7.8x
Debt proforma Santillana Spain disposal and refinancing
20January – September 2020 Results. Promotora de informaciones S.A.
TOTAL GROUP
Balance
ASSETS
€ Million 09/30/2020 (*) 12/31/2019
FIXED ASSETS 462,99 652,46
Property, plan and equipment 167,57 190,73
Goodwill 109,61 151,07
Intangible assets 108,48 125,01
Long term financial investments 15,81 20,67
Investment in associates 24,69 48,71
Deferred tax assets 36,83 116,25
Other non current assets 0,02 0,03
CURRENT ASSETS 814,96 919,70
Inventories 57,92 84,42
Accounts receivable 293,99 383,35
Short term financial investments * 7,92 4,74
Cash & cash equivalents 223,70 166,58
Assets held for sale 231,43 280,61
TOTAL ASSETS 1.277,95 1.572,16
LIABILITIES
€ Million 09/30/2020 (*) 12/31/2019
SHAREHOLDERS EQUITY -686,23 -411,60
Issued capital 70,87 666,13
Reserves -621,03 -965,19
Income attributable to the parent company -209,30 -182,30
Minority interest 73,23 69,76
NON CURRENT LIABILITIES 1.323,98 1.331,84
Long term financial debt 1.172,24 1.164,87
Other long term financial liabilities 112,72 117,21
Deferred tax liabilities 17,88 24,99
Provisions 18,22 22,14
Other non current liabilities 2,92 2,64
CURRENT LIABILITIES 640,21 651,92
Short term financial debt 151,80 50,19
Other current financial liabilities 17,01 23,75
Trade accounts payable 185,94 270,52
Other short term liabilities * 84,87 107,42
Accrual accounts 31,13 35,77
Liabilities held for sale 169,45 164,28
TOTAL LIABILITIES 1.277,95 1.572,16
*Media Capital's assets and liabilities have been reclassified as assets and liabilities held for sale.
IFRS16 Impact
As of September 2020, the financial liability resulting from the application of the rule amounts to EUR 129.5 million
21January – September 2020 Results. Promotora de informaciones S.A.
CLOSING FACTS
MEDIA CAPITAL SALE
As of May 14th 2020, PRISA and Pluris Investments, S.A. (“Pluris”) a Portuguese company whose ultimate beneficial
owner is Mr. Mario Ferreira, have executed the acquisition by Pluris of shares amounting to 30.22% of the issued share
capital of Prisa's Portuguese listed subsidiary Grupo Media Capital SGPS, S.A. (“Media Capital”) (the “Transaction”).
The Transaction has been carried out through a block trade transfer of the shares for a price of EUR 10,500,000.
The implicit valuation of the Transaction is of an enterprise value of EUR 130Mn, based on the financial position of
Media Capital as of closing of the first quarter of the year. This valuation is above the last market estimates made by
analysts, which include considerations on the potential impact of Covid-19 on media assets. Likewise, it implies higher
multiples than those of FTA companies, which are trading at around 6x/7x.
This transaction will result in an accounting loss in Prisa's individual and consolidated accounts of approximately EUR
29Mn euros.
The Transaction is part of the divestment policy initiated by Prisa, to which end, it has been undertaken by the Parties
to seek, in a coordinated manner, for new potential investors that could facilitate Prisa's additional divestment in
Media Capital, and to this end the Parties have agreed on certain conditions for the transfer of its shares.
Prisa reiterates that it considers Pluris a suitable investor for Media Capital, considering its commitment to promote a
forward-looking project that strengthens Media Capital’s position in the market, as well as its competitiveness and
efficiency, providing financial support, if needed, and supporting the management team with its experience.
After carrying out, through a financial institution, a market sounding process to search for potential investors, Vertix,
SGPS, S.A. (“Vertix”), a wholly owned subsidiary of Prisa, has signed on the date hereof with a plurality of investors
independent agreements for the sale of shares of the Portuguese listed company Grupo Media Capital SGPS, S.A.
("Media Capital"), which together represent the entire shareholding (64.47%) held by Vertix in Media Capital (the
"Transaction").
The Transaction, which has been authorized by Pluris Investments, S.A. ("Pluris") within the framework of the
shareholders' agreement signed with Vertix, is conditional on obtaining a waiver from certain financial creditors of
Prisa, as well as the authorization of the Portuguese regulatory authorities that may be necessary.
The Transaction is expected to be carried out simultaneously through independent block transfers of the shares for a
total price of € 36,850,047.74, which implies an implicit valuation (enterprise value) of € 150Mn based on the Media
Capital's financial position at the end of the second quarter of this year and a premium of 63% compared to the price
per share offered by the entity Cofina SGPS, SA in its voluntary public offer on the shares of Media Capital published on
August 12.
According to the Company's estimates, this transaction will mean an accounting loss in Prisa's individual and
consolidated accounts of approximately € 48.5Mn.
The Operation is part of the non-essential asset divestment policy initiated by Prisa a few months ago and is in line with
the already announced roadmap for targeting its strategic education and media assets.
AGREEMENT WITH LENDERS
In April 2020 Prisa agreed with the financial creditors of the Override Agreement and the Super Senior Credit Policy,
among other aspects, a flexibility in compliance with the financial ratios (covenants) to which the Group is subject and
for a period that runs until March 2021. Therefore, this agreement gives Prisa greater flexibility in the fulfilment of its
financial obligations.
22January – September 2020 Results. Promotora de informaciones S.A.
CLOSING FACTS
SANTILLANA SPAIN DISPOSAL
Prisa, through its subsidiary Grupo Santillana Educación Global, S.L.U. (“Santillana”), has signed an agreement with the
Sanoma Corporation, a European learning and Finnish media company, for the sale of the Spanish educational business
of Santillana addressed at pre K12 and K-12 segments (the “Transaction”).
Santillana's activity in public and private markets in Latin America has been excluded from the Transaction and will
continue to be developed by Prisa through Santillana. Furthermore, Santillana will maintain the ownership of all its
brands, and will execute, on the closing date of the Transaction, an exclusive license agreement in favor of Sanoma for,
among other rights, the use of the “Santillana” and “Loqueleo” trademarks in the European Union, excluding Portugal,
and the “Richmond” trademark in Spain.
The Transaction was unanimously approved by the Company's Board of Directors meeting held yesterday, 18 October
2020.
The price of the Transaction has been set at an amount of 465 million euros and will be fully paid in cash on the closing
date of the Transaction, once the net debt of the business subject of the Transaction at 30 June 2020 has been
discounted, estimated at 53 million euros. Such closing is subject to (i) obtaining the required authorization from the
Spanish competition authoritity (or confirmation that such authorization is not required); (ii) obtaining the necessary
consents from the Company’s creditors with the majority of whom (representing 79.7%) an agreement of principles has
been reached (Term Sheet) on the date hereof and which has been the subject of the Inside Information published
today; and (iii) the mandatory approval at Prisa’s General Shareholders Meeting pursuant to article 160.(f) of the
Spanish Companies’ Act
AGREEMENT WITH LENDERS
Prisa has entered into a lock-up agreement (the “Lock-up Agreement”) which contains a term sheet that sets out,
among other aspects, the essential terms on which the group’s syndicated financial debt will be restructured.
The agreement, negotiated with a representative group of its main financial creditors, concerns the debt arising from
the syndicated facility agreement currently totalling €1,148m, dated 11 December 2013 (as amended on various
occasions since then), that will be totally restructured in the coming months (the “Restructuring”).
The Lock-up Agreement came into effect in respect of the banks that signed or acceded to it, which represent 79.7% of
the syndicated indebtedness to be restructured. Following this, the Company will seek support for the Lock-up
Agreement from the rest of the creditors (including the senior-ranking debt), or at least the minimum number needed
to ensure that the arrangement can be implemented in terms that are binding for all creditors.
The terms of the Restructuring were also unanimously approved at the Company board meeting held yesterday, 18
October 2020.
The basic terms of the Restructuring consist in: (i) partial repayment of the debt to be restructured in an amount of
€400 million; (ii) a significant time extension for the maturity of the remaining financial debt, until 2025; and (iii)
adaptation of the financial conditions of the debt to the group’s new position in terms of generating cash. On top of
these essential terms, the agreed Restructuring allows Prisa to incur further senior-ranking debt to strengthen its
liquidity position in the future, and to complete certain actions of business reorganisation. Finally, the basic terms
include a relaxation of certain financial covenants and Prisa’s commitment to achieving a leverage cap in December
2023.
The agreed Restructuring will therefore make the Group’s financial indebtedness more flexible and give it a financial
structure that allows the Group to fulfil its financial commitments, ensuring the Group’s stability in the short and
medium term.
The Restructuring is conditional on successfully completing the selling of certain Santillana K-12 and pre K-12 business
assets in Spain. The Restructuring also needs to be binding on all creditors owed the financial debt to be restructured. In
the event, therefore, that it is not possible to get those creditors’ full support for the arrangement, the Company will
take legal or judicial action to enable it to take effect generally. In view of the law applicable to this debt, an English-law
scheme of arrangement is foreseen as the possible procedure for this.
23January – September 2020 Results. Promotora de informaciones S.A.
APPENDIX
1. FX Evolution 25
2. Revenue breakdown and adjustments 26
24January – September 2020 Results. Promotora de informaciones S.A.
TOTAL GROUP
FX Evolution
The Group's results in Latin America have been affected by FX Evolution in the region, mainly in Argentina,
Brazil and Mexico.
FX impact on the Group's revenue and EBITDA in 9M2020 has been negative. The impact has been of -44.0
million euros on revenue and of -5.4 million euros on EBITDA.
225
205
185
165
145
125
105
85
BRL MXN COP CLP ARG
BRL MXN COP CLP ARG
1Q2019 4,28 21,81 3.560,74 758,39 44,29
2Q2019 4,40 21,47 3.642,38 767,90 49,36
3Q2019 4,41 21,61 3.718,19 785,13 55,95
4Q2019 4,56 21,32 3.768,78 836,72 65,70
1Q2020 4,91 22,06 3.907,73 886,42 67,82
2Q2020 5,92 25,67 4.229,51 905,36 74,48
3Q2020 6,29 25,82 4.365,30 912,46 85,71
Source: Bloomberg
25January – September 2020 Results. Promotora de informaciones S.A.
TOTAL GROUP
Breakdown of operating revenue and comparable EBITDA by B.U.
JANUARY - SEPTEMBER JULY - SEPTEMBER
€ Millions 2020 2019 % Chg. 2020 2019 % Chg.
Operating Revenues
GROUP 616,0 796,9 (22,7) 223,2 311,2 (28,3)
Education 392,3 461,1 (14,9) 147,8 205,2 (28,0)
Radio 122,5 196,4 (37,6) 41,1 61,9 (33,7)
Press Total - includes PBS&IT 113,5 152,9 (25,8) 37,9 48,4 (21,7)
Others (12,3) (13,6) 9,4 (3,5) (4,2) 15,9
0
JANUARY - SEPTEMBER JULY - SEPTEMBER
€ Millions 2020 2019 % Chg. 2020 2019 % Chg.
Comparable EBITDA
GROUP 82,1 165,3 (50,3) 50,0 79,6 (37,1)
Education 110,1 129,2 (14,8) 55,5 67,4 (17,5)
Radio (6,2) 41,8 --- (1,0) 13,7 ---
Press Total - includes PBS&IT (17,0) 1,1 --- (3,3) (0,5) ---
Others (4,8) (6,9) 30,8 (1,2) (1,0) (21,5)
JANUARY - SEPTEMBER JULY - SEPTEMBER
€ Millions 2020 2019 % Chg. 2020 2019 % Chg.
Comparable EBITDA excluding severance expenses
GROUP 86,9 173,5 (49,9) 51,2 80,8 (36,6)
Education 112,1 132,2 (15,2) 56,4 68,5 (17,7)
Radio (5,7) 44,0 --- (0,8) 13,6 ---
Press Total - includes PBS&IT (15,4) 3,9 --- (3,2) (0,2) ---
Others (4,1) (6,6) 39,0 (1,2) (1,0) (19,0)
Adjustments between reported EBITDA and EBIT and comparable EBITDA and EBIT
JANUARY - SEPTEMBER JULY - SEPTEMBER
€ Millions 2020 2019 % Chg. 2020 2019 % Chg.
Mediapro sentence
One-offs in Operating Revenues 0,0 0,0 --- 0,0 0,0 ---
--- 0,0 0,0 ---
Effect in Expenses 0,0 51,0 (100,0) 0,0 0,0 ---
Mediapro Rulling 51,0 (100,0) 0,0 0,0 ---
To the reported results, the extraordinary expenditure of 51 million Mediapro is adjusted in 2019 to show the comparable
evolution of the business.
26You can also read